Italians Can Expect Nearly 21 More Healthy Years Than Latvians
Silver Data Lab Research Desk · Statistical analysis · Published on 20 July 2026
This study is open to members only
Its sources, filters and extraction date are declared above, as they are for every study. Sign in to read the analysis in full.
- Data source
- Eurostat
- Reference period
- 2024
- Last updated
- 11 October 2026
Re-checked against the source on 11 August 2026. No value in its datasets has moved between the snapshots we hold. Every revision we have observed →
Key estimates
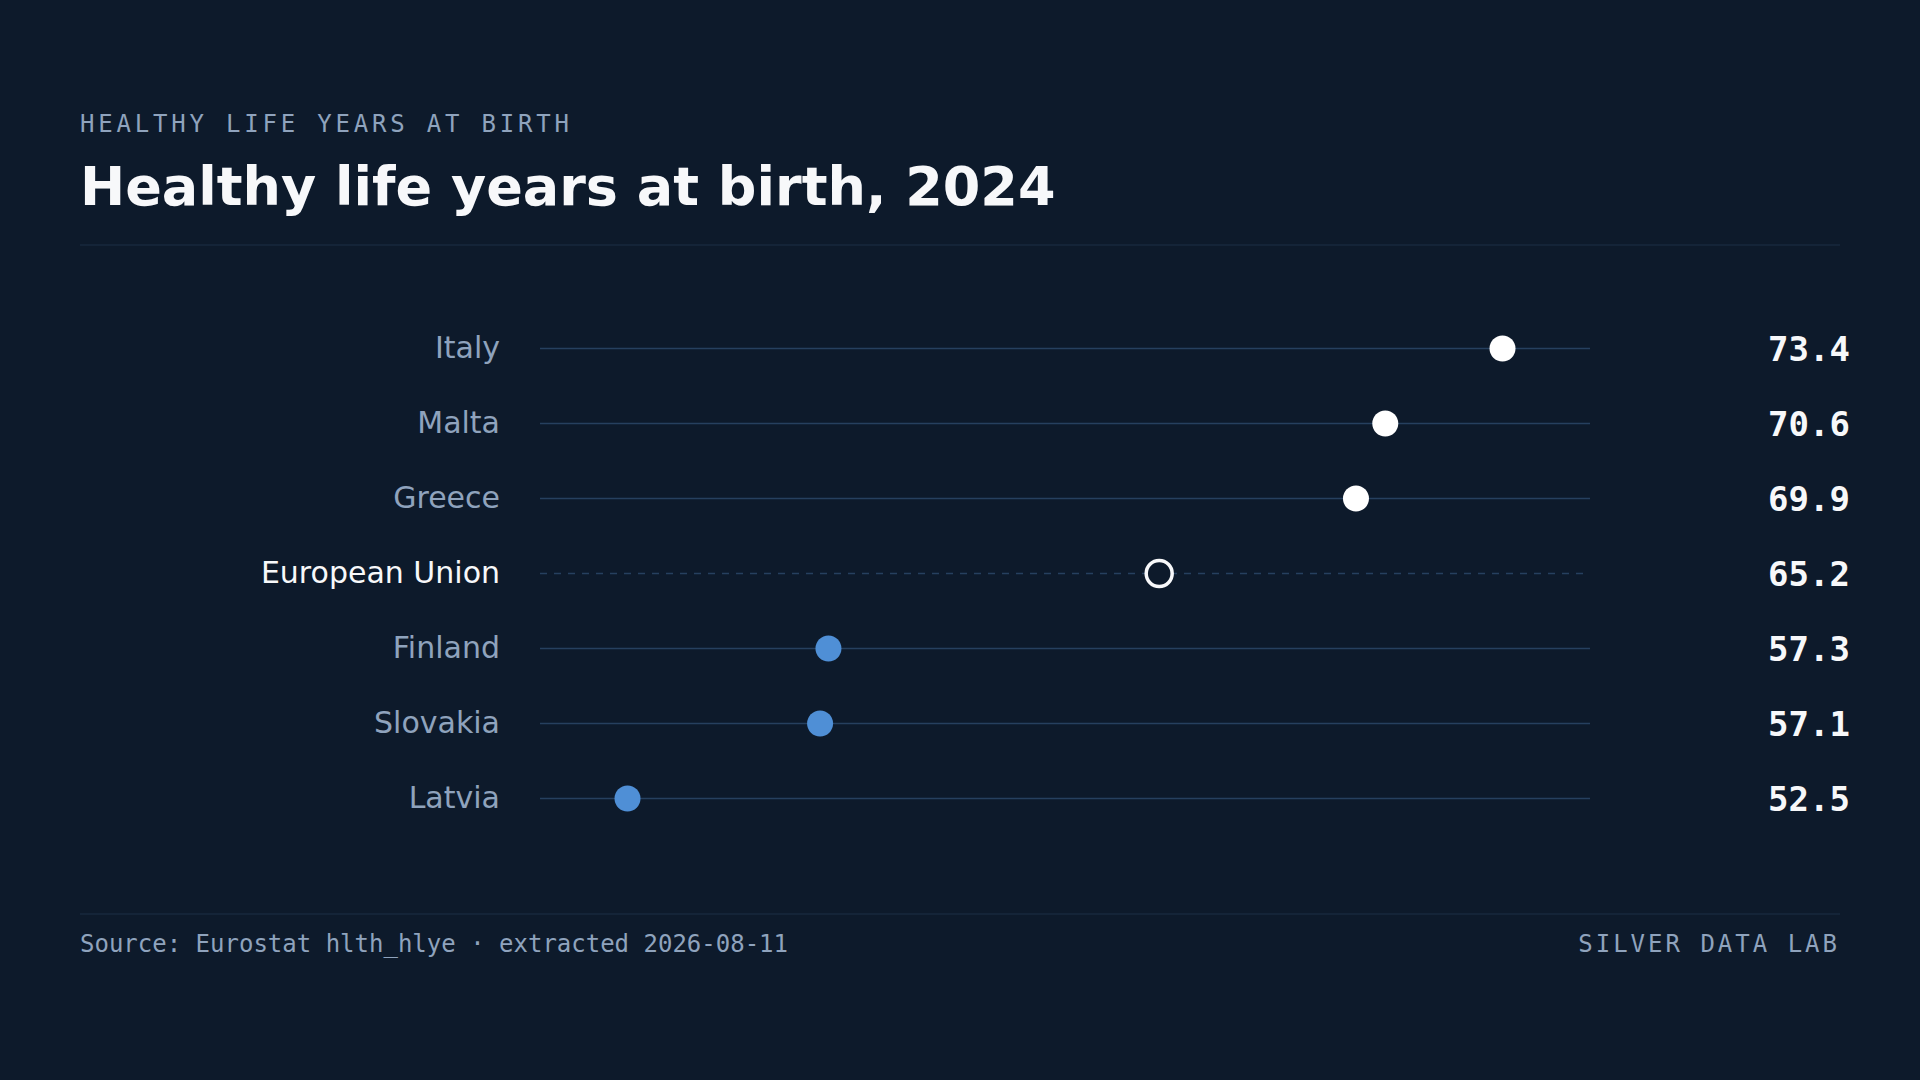
- A person born in the EU in 2024 could expect 65.2 years free of activity limitation.
- Italy records 73.4 healthy life years and Malta 70.6.
- Latvia records 52.5, Slovakia 57.1 and Finland 57.3.
- The gap between Italy and Latvia is 20.9 years.
- Finland has the highest life satisfaction in the Union and the third-lowest number of healthy life years.
Years lived without limitation
Healthy life years measure how long a person born today could expect to live without limitation in everyday activities. It combines mortality with self-reported disability, so it is a measure of the quality of a lifespan rather than its length.
Across the EU in 2024 the figure was 65.2 years.
The Finnish contradiction
Finland records the highest mean life satisfaction in the Union at 7.8 out of 10, and 57.3 healthy life years — third from bottom, behind Slovakia and Latvia.
Two official European indicators, both drawn from the same survey framework, place the same country at opposite ends of the Union. That is worth stating clearly rather than reconciling, because the resolution is instructive: they measure different things and both are correct.
Satisfaction asks how someone feels about their life. Healthy life years count how much of it they expect to spend without activity limitation, and the disability component of that comes from a question about whether a respondent is limited in what they can do.
There is a further complication, and it is the same one that affects the satisfaction ranking. The limitation question is self-assessed, so cultural differences in how readily people report limitation feed directly into the result. A population willing to describe itself as limited will record fewer healthy life years without being less healthy.
The top
Italy records 73.4 healthy life years, the highest in the Union, with Malta at 70.6 and Greece at 69.9.
Bulgaria at 69.1 is the entry that resists a wealth-based reading. It has the lowest life satisfaction in the Union, one of its lowest income levels, and the fourth-highest number of healthy life years. It also has one of the Union's shorter life expectancies, which means Bulgarians report a large share of a shorter life as unlimited.
That combination is the clearest evidence available here that the indicator is not a straightforward measure of health system performance.
The bottom
Latvia records 52.5 years, nearly 21 fewer than Italy. Slovakia at 57.1, Finland at 57.3, Estonia at 58.6 and the Netherlands at 59.5 complete the group below 60.
The presence of Finland and the Netherlands in that group — two high-income Member States with well-regarded health systems — is the strongest single argument for reading this indicator with care.
How to use it
Healthy life years is valuable as a companion to life expectancy, because a country can extend life without extending healthy life and this measure detects that. It is unreliable as a cross-country league table of health, because the disability component rests on self-assessment that does not travel well between languages and cultures.
The comparison it supports best is within a country over time, and the comparison it supports worst is exactly the one a ranking invites.
Healthy life years at birth, 2024
| Country | years | Gap to EU averagederived |
|---|---|---|
| Italy | 73.4b | +8.2 |
| Malta | 70.6 | +5.4 |
| Greece | 69.9 | +4.7 |
| European Unionaggregate | 65.2 | — |
| Finland | 57.3 | −7.9 |
| Slovakia | 57.1 | −8.1 |
| Latvia | 52.5 | −12.7 |
Flags carried by the source on these values: b break in time series
This table as data: CSV · JSON
Every Member State for this indicator+
Members see every Member State for this indicator here, not only the rows the ranking prints. Become a Member
What these figures cannot tell you
- The disability component is self-assessed
- Healthy life years combine life tables with a survey question on activity limitation. How readily people describe themselves as limited differs between countries and languages, and that variation enters the indicator directly. This is the main reason cross-country comparison is weak.
- Luxembourg is absent
- Eurostat publishes no value for Luxembourg for 2024, so the ranking and the counts here cover 26 Member States against an EU aggregate that includes all 27.
- At birth, under current conditions
- The figure is a synthetic expectancy computed from current mortality and limitation rates. It describes conditions in 2024 rather than predicting the experience of anyone actually born that year.
- Not comparable with life expectancy alone
- A country can have high life expectancy and low healthy life years, or the reverse. The two indicators answer different questions and neither substitutes for the other.
Frequently asked questions
- How many healthy years can a European expect?
- 65.2 years free of activity limitation for someone born in the EU in 2024, against a total life expectancy several years higher. National figures range from 73.4 years in Italy to 52.5 in Latvia.
- Which EU country has the most healthy life years?
- Italy, at 73.4 years in 2024, followed by Malta at 70.6 and Greece at 69.9. Bulgaria is fourth at 69.1, despite having one of the Union's shorter life expectancies.
- Why does Finland score badly on healthy life years?
- Finland records 57.3 healthy life years, third-lowest in the Union, while also recording the Union's highest life satisfaction. The disability component of this indicator is self-assessed, so how readily a population describes itself as limited affects the result directly — which is why it is a weak instrument for comparing countries.
- Is this the same as life expectancy?
- No. Life expectancy counts years lived; healthy life years count years expected without limitation in everyday activities. A country can extend one without extending the other, and this indicator exists precisely to detect that.
Methodological note
Healthy life years at birth are published by Eurostat by combining life table mortality data with the self-reported activity limitation question from EU-SILC. This study uses the figure at birth for both sexes combined.
Values are for 2024. Luxembourg has no published value for that year, so the national comparisons cover 26 Member States; the EU aggregate is as published.
The gap between the highest and lowest Member State, the count below 60 years, and the comparison with life satisfaction and life expectancy are derived by Silver Data Lab from the published values and the companion studies on this site.
Source data
The underlying series can be inspected and re-downloaded from the Eurostat data browser. The filters below are the ones applied.
Healthy life years by sex (from 2004 onwards)
hlth_hlye
- Filters applied:
- freq=A · unit=YR · sex=T · hlth_hle=HLY_Y0 · time=2024
- Extracted:
- 2026-08-11
- Source last updated:
- 2026-07-17
Download the data
The data the study you have just read is built on, exactly as it was downloaded and archived.
Yours as a Member.
Data downloadable by Members
How to cite
Record the vintage as well as the study: the figures on this page are the ones extracted on the dates below.
Silver Data Lab Research Desk (2026). Italians Can Expect Nearly 21 More Healthy Years Than Latvians. Silver Data Lab, published 20 July 2026, last updated 11 October 2026. https://www.silverdatalab.com/studies/healthy-life-years-in-the-eu
- Data: Eurostat, Healthy life years by sex (from 2004 onwards) (hlth_hlye), filters freq=A, unit=YR, sex=T, hlth_hle=HLY_Y0, time=2024; extracted 2026-08-11; source last updated 2026-07-17. https://doi.org/10.2908/hlth_hlye
Silver Data Lab's analysis is licensed CC BY 4.0. The statistics remain their publisher's and keep its terms of reuse.
Ask the research desk
A question about this study — a definition, a filter, a break in the series, what the figures can and cannot support — answered by the desk that made the extraction.
Members can write to the research desk
Studies where the same country leads or trails
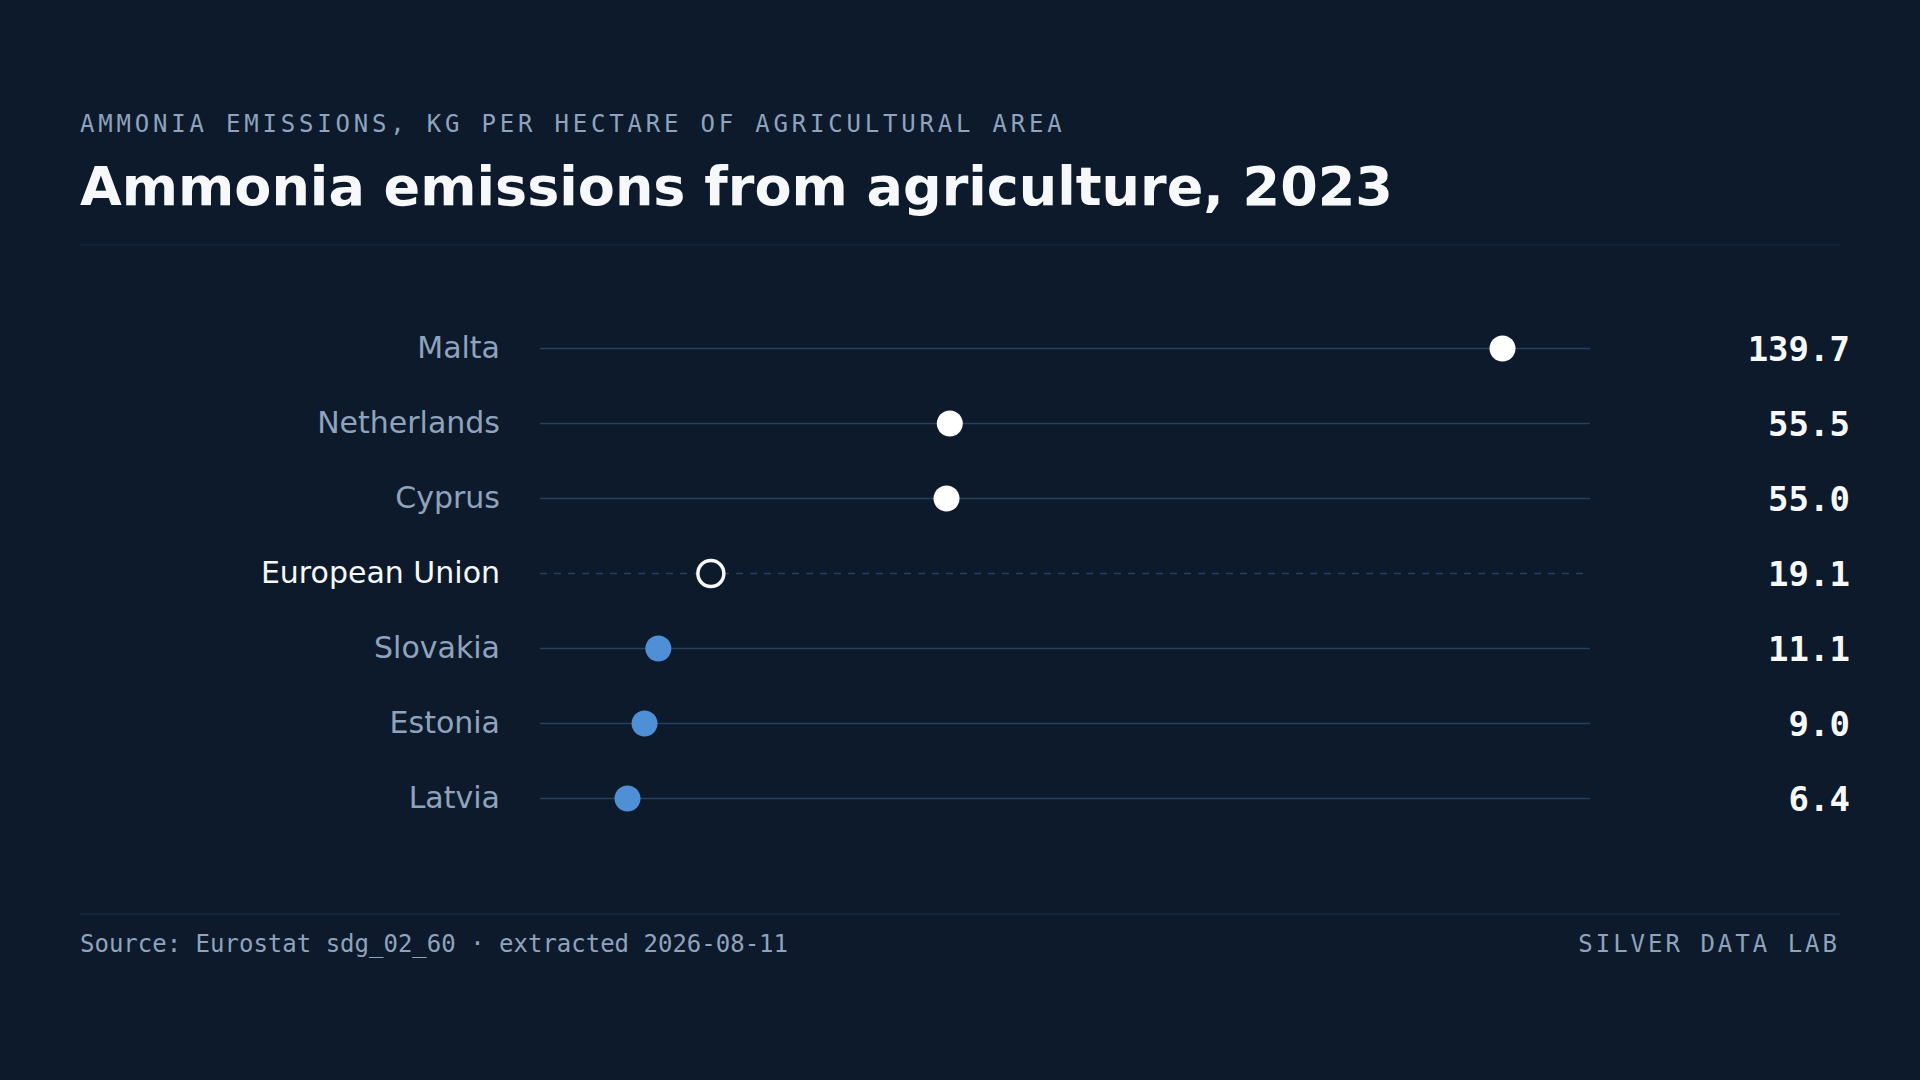
Dutch Farms Emit Nearly Three Times the EU Average of Ammonia per Hectare
EU agriculture emitted 19.2 kg of ammonia per hectare of agricultural area in 2023.
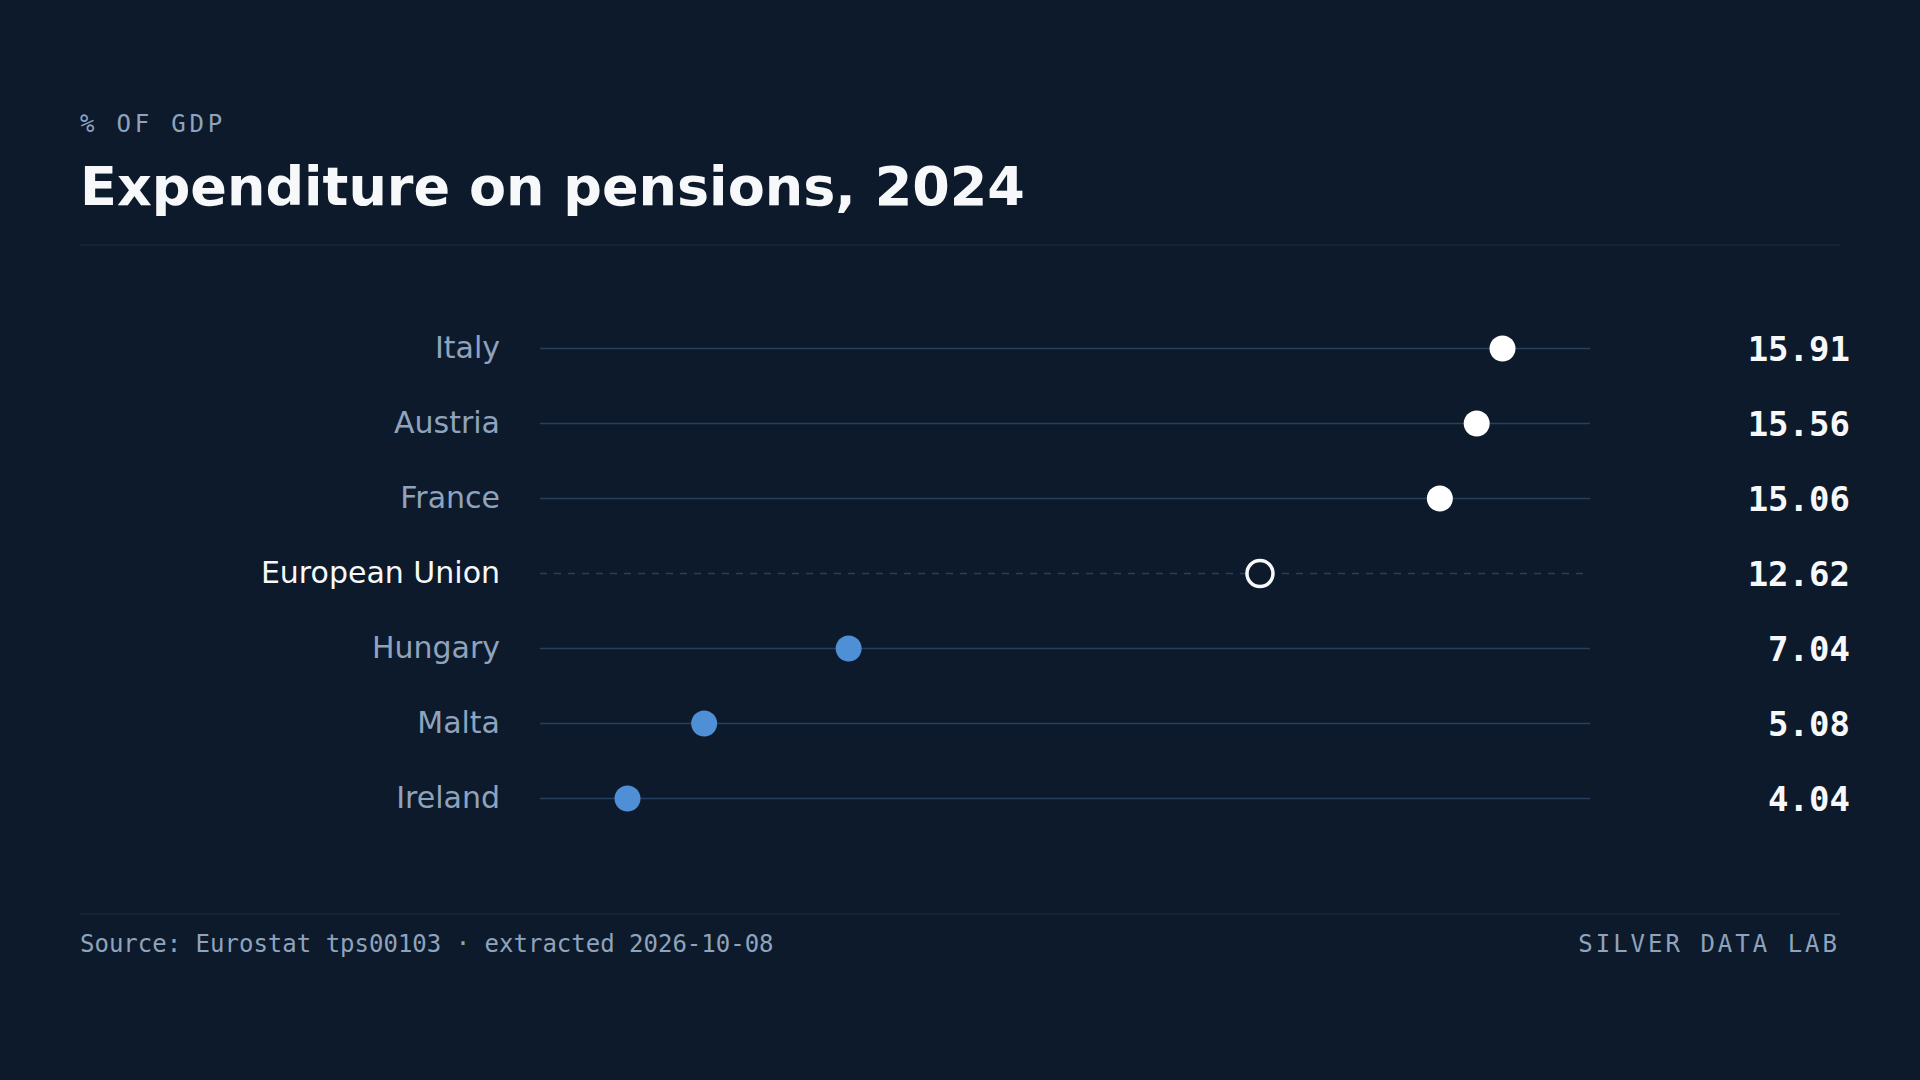
Italy Spends a Larger Share of GDP on Pensions Than Any Other EU Country
The EU spent a provisional 12.62% of its GDP on pensions in 2024, up from an estimated 12.31% in 2023 but still below the estimated 13.15% of 2013.
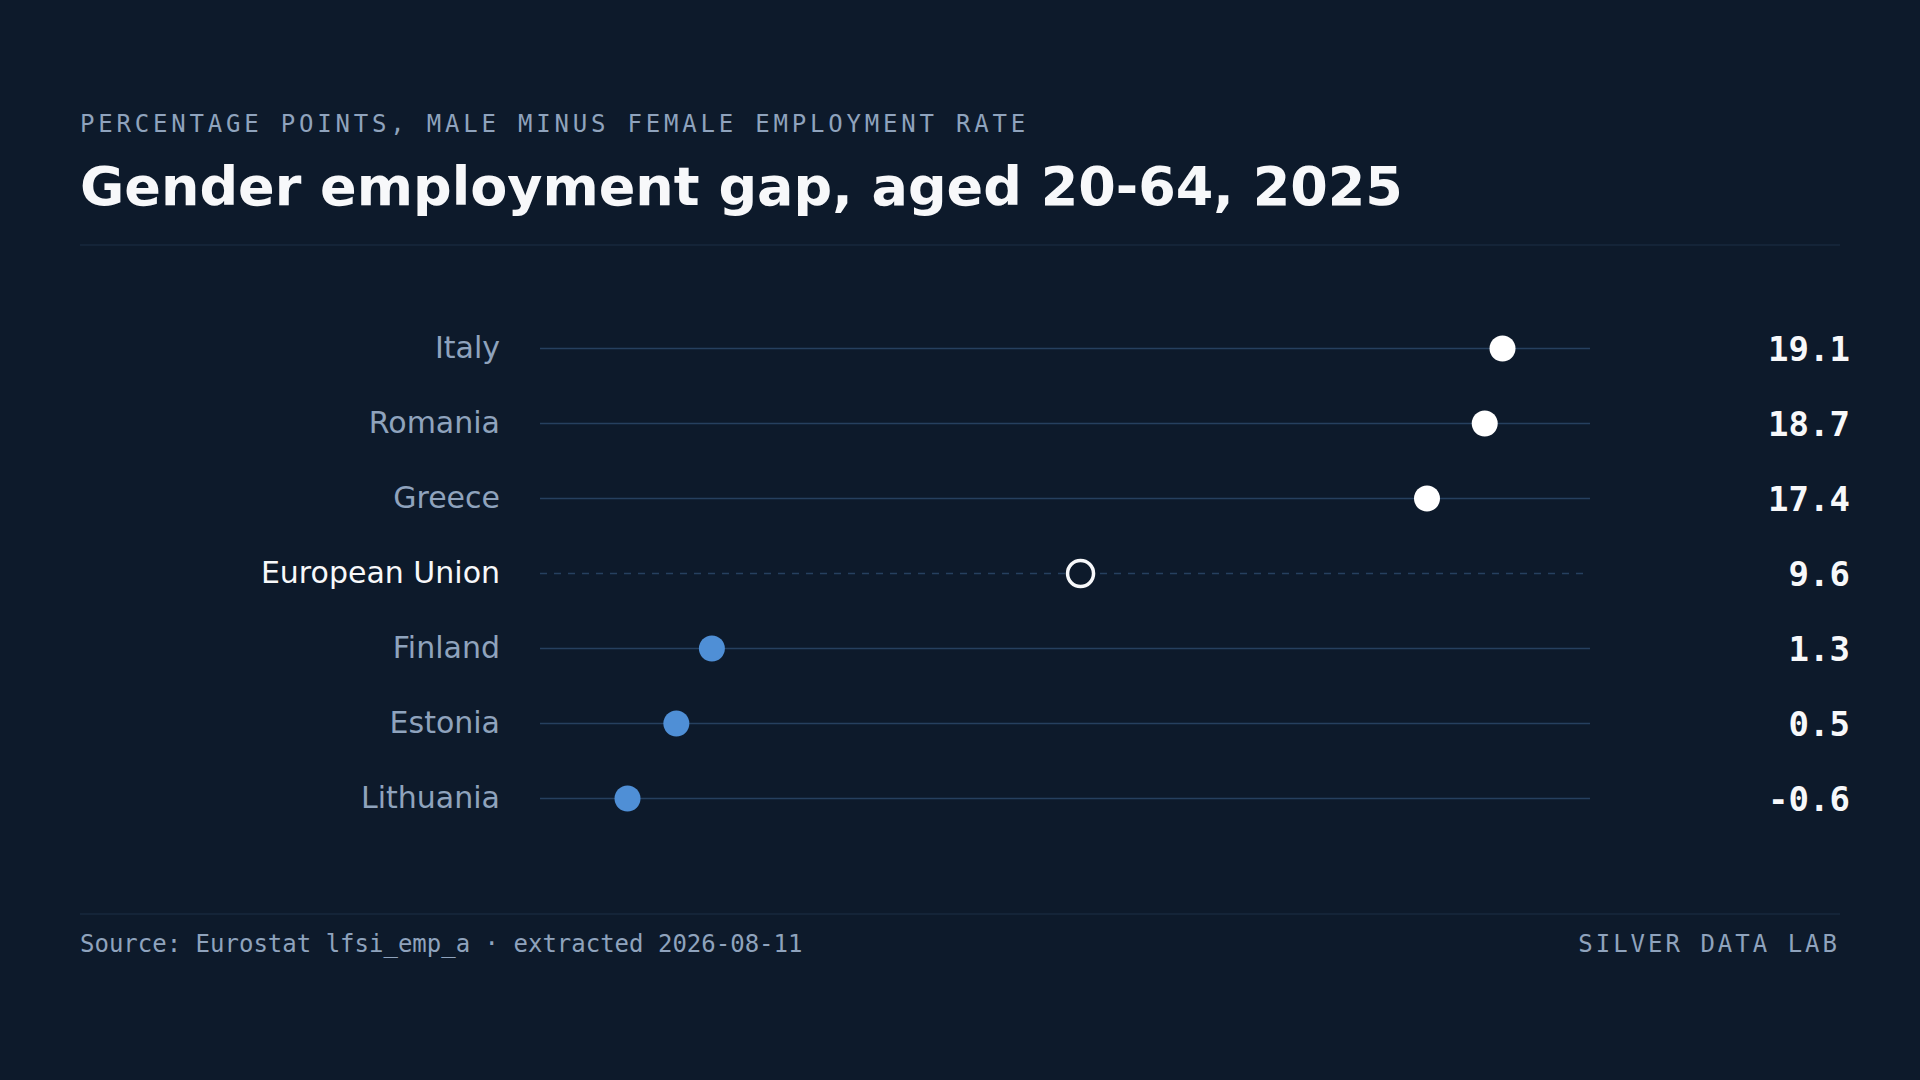
Lithuania Is the Only EU Country Where Women's Employment Exceeds Men's
Male employment exceeded female employment by 9.6 percentage points across the EU in 2025.