Lithuania Is the Only EU Country Where Women's Employment Exceeds Men's
Silver Data Lab Research Desk · Statistical analysis · Published on 14 June 2026
- Data source
- Eurostat
- Reference period
- 2025
- Last updated
- 11 October 2026
Re-checked against the source on 11 September 2026. No value in its datasets has moved between the snapshots we hold. Every revision we have observed →
Key estimates
- Male employment exceeded female employment by 9.6 percentage points across the EU in 2025.
- Italy records the widest gap at 19.1 points, ahead of Romania at 18.7 and Greece at 17.4.
- Lithuania records −0.6: female employment exceeds male employment.
- Estonia at 0.5 and Finland at 1.3 are the next narrowest.
- The gap is derived by subtraction from the two published employment rates and is labelled as derived.
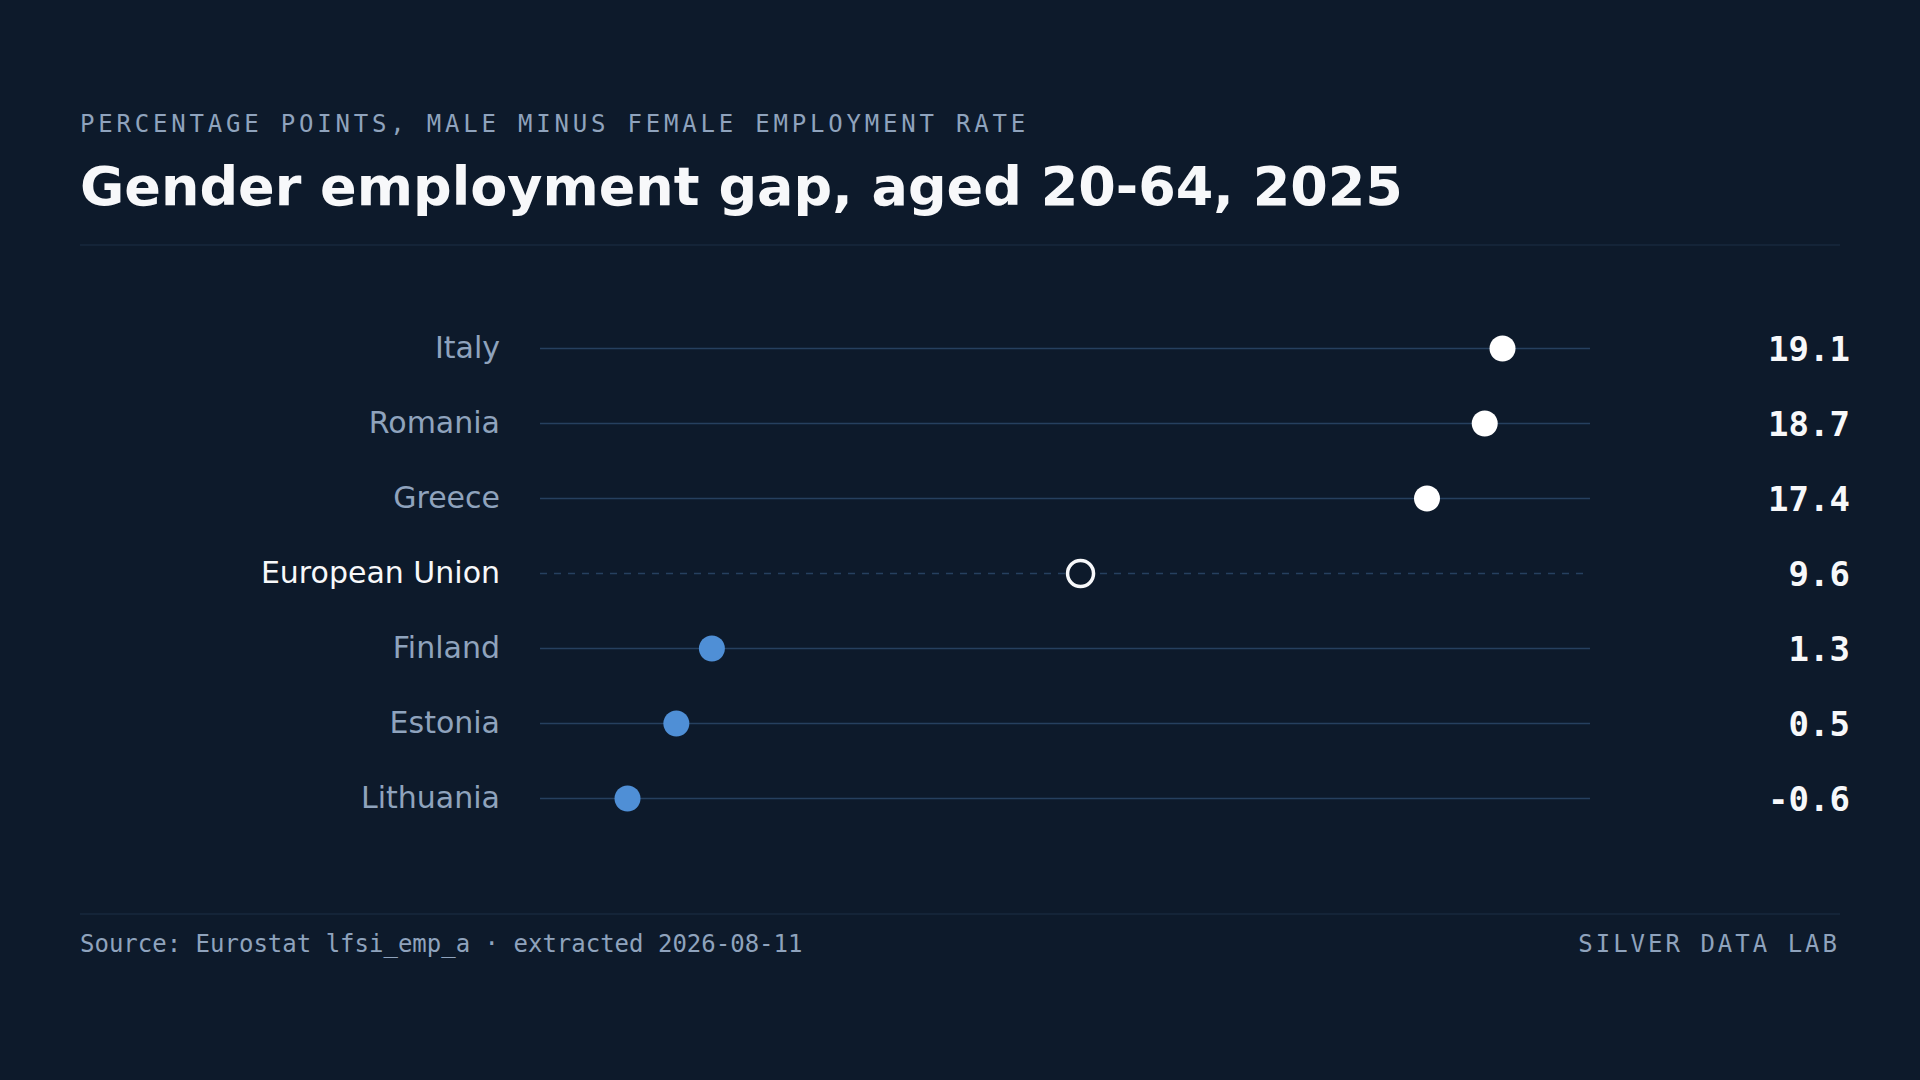
One number that separates the Union into two groups
The gender employment gap is the difference between the share of men aged 20 to 64 in work and the share of women. Across the EU in 2025 it was 9.6 percentage points: 80.9% of men and 71.3% of women.
The distribution behind that average is not a gradient. It is closer to two clusters with a thin middle.
The wide end
Italy records 19.1 points, the widest in the Union. Romania follows at 18.7, Greece at 17.4, Malta at 12.4 and Poland at 11.3.
The gap between third and fourth place is 5.0 points — larger than the distance between fourth and eleventh. Italy, Romania and Greece are separated from the rest of the Union rather than merely leading it.
For Italy this is the mechanism behind its position at the bottom of the overall employment ranking. Italian men record 77.1% employment, below the EU male figure of 80.9% but unremarkable; Italian women record 58.0%, the lowest female rate in the Union.
The narrow end, and the one that reverses
Lithuania records −0.6 points: Lithuanian women are more likely to be in work than Lithuanian men. It is the only Member State in the Union where that holds.
Estonia at 0.5 and Finland at 1.3 follow, then Latvia at 1.9 and Sweden at 3.9.
The Baltic states occupy three of the four narrowest positions. That is the same group that appears at the top of the life expectancy gender gap ranking, where Latvian women outlive Latvian men by 9.8 years — the widest in the Union.
Those two facts are related in a way worth stating carefully: in the Baltics, women participate in the labour market at rates equal to or above men's, and men die substantially earlier. This study establishes both figures from separate sources and does not claim a causal link between them.
What a narrow gap does not tell you
Lithuania's reversed employment gap sits alongside the third-widest income inequality in the Union, at an S80/S20 ratio of 6.5. Equality of participation and equality of outcome are different measures, and Lithuania scores at opposite ends of the two.
Gender employment gap, aged 20-64, 2025
| Country | Percentage points | Gap to EU averagepercentage points, derived |
|---|---|---|
| Italy | 19.1 | +9.5 |
| Romania | 18.7 | +9.1 |
| Greece | 17.4 | +7.8 |
| European Unionaggregate | 9.6 | — |
| Finland | 1.3 | −8.3 |
| Estonia | 0.5 | −9.1 |
| Lithuania | -0.6 | −10.2 |
This table as data: CSV · JSON
Every Member State for this indicator+
Members see every Member State for this indicator here, not only the rows the ranking prints. Become a Member
Embed this chart
Paste this code into a page. The frame carries the source and the extraction date, and links back to the study.
What these figures cannot tell you
- A derived figure
- Eurostat publishes male and female employment rates separately. The gap is computed by Silver Data Lab by subtraction and is labelled as derived wherever it appears.
- Participation, not quality
- The measure counts whether people are employed, not on what terms. A country can narrow its gap by moving women into part-time or low-paid work, and this indicator would record that as progress.
- The 20 to 64 band
- Employment gaps differ substantially by age, and the gap among younger cohorts is narrower than among older ones in most Member States. A single figure across the band conceals that.
- Percentage points, not ratios
- A gap of 9.6 points means different things at different employment levels. The same difference is proportionally larger in a country with low overall employment.
Frequently asked questions
- What is the gender employment gap in the EU?
- 9.6 percentage points in 2025: 80.9% of men aged 20 to 64 were in employment against 71.3% of women. The gap is computed by subtraction from the two published rates.
- Which EU country has the widest gender employment gap?
- Italy, at 19.1 percentage points in 2025, followed by Romania at 18.7 and Greece at 17.4. Those three are separated from the rest of the Union by a clear margin.
- Is there an EU country where more women work than men?
- One. Lithuania records −0.6 percentage points in 2025, meaning female employment exceeds male employment. Estonia at 0.5 and Finland at 1.3 are the next narrowest.
- Does a narrow employment gap mean equality?
- Not by itself. Lithuania has the Union's only reversed employment gap and its third-widest income inequality. Equal participation and equal outcomes are different measures and can point in opposite directions.
Methodological note
Male and female employment rates for the population aged 20 to 64 are published separately by Eurostat. The gender employment gap used here is the male rate minus the female rate, computed by Silver Data Lab and labelled as derived; Eurostat does not publish the difference.
Values are for 2025, the most recent year with complete coverage of the 27 Member States at the extraction date.
The comparisons with the life expectancy gender gap and with income inequality draw on companion studies on this site, each from a separate extraction, and are presented as observations from independent sources rather than as a combined finding.
Source data
The underlying series can be inspected and re-downloaded from the Eurostat data browser. The filters below are the ones applied.
Employment and labour force by sex and age — annual data
lfsi_emp_a
- Filters applied:
- freq=A · indic_em=EMP_LFS · unit=PC_POP · age=Y20-64 · sex=M, F · time=2025
- Extracted:
- 2026-09-11
- Source last updated:
- 2026-09-10
Download the data
The data the study you have just read is built on, exactly as it was downloaded and archived.
Yours as a Member.
Data downloadable by Members
How to cite
Record the vintage as well as the study: the figures on this page are the ones extracted on the dates below.
Silver Data Lab Research Desk (2026). Lithuania Is the Only EU Country Where Women's Employment Exceeds Men's. Silver Data Lab, published 14 June 2026, last updated 11 October 2026. https://www.silverdatalab.com/studies/gender-employment-gap-in-the-eu
- Data: Eurostat, Employment and labour force by sex and age — annual data (lfsi_emp_a), filters freq=A, indic_em=EMP_LFS, unit=PC_POP, age=Y20-64, sex=M, F, time=2025; extracted 2026-09-11; source last updated 2026-09-10. https://doi.org/10.2908/lfsi_emp_a
Silver Data Lab's analysis is licensed CC BY 4.0. The statistics remain their publisher's and keep its terms of reuse.
Ask the research desk
A question about this study — a definition, a filter, a break in the series, what the figures can and cannot support — answered by the desk that made the extraction.
Members can write to the research desk
Other studies on the same dataset
Employment Rates Vary Far More Between EU Regions Than Between Countries
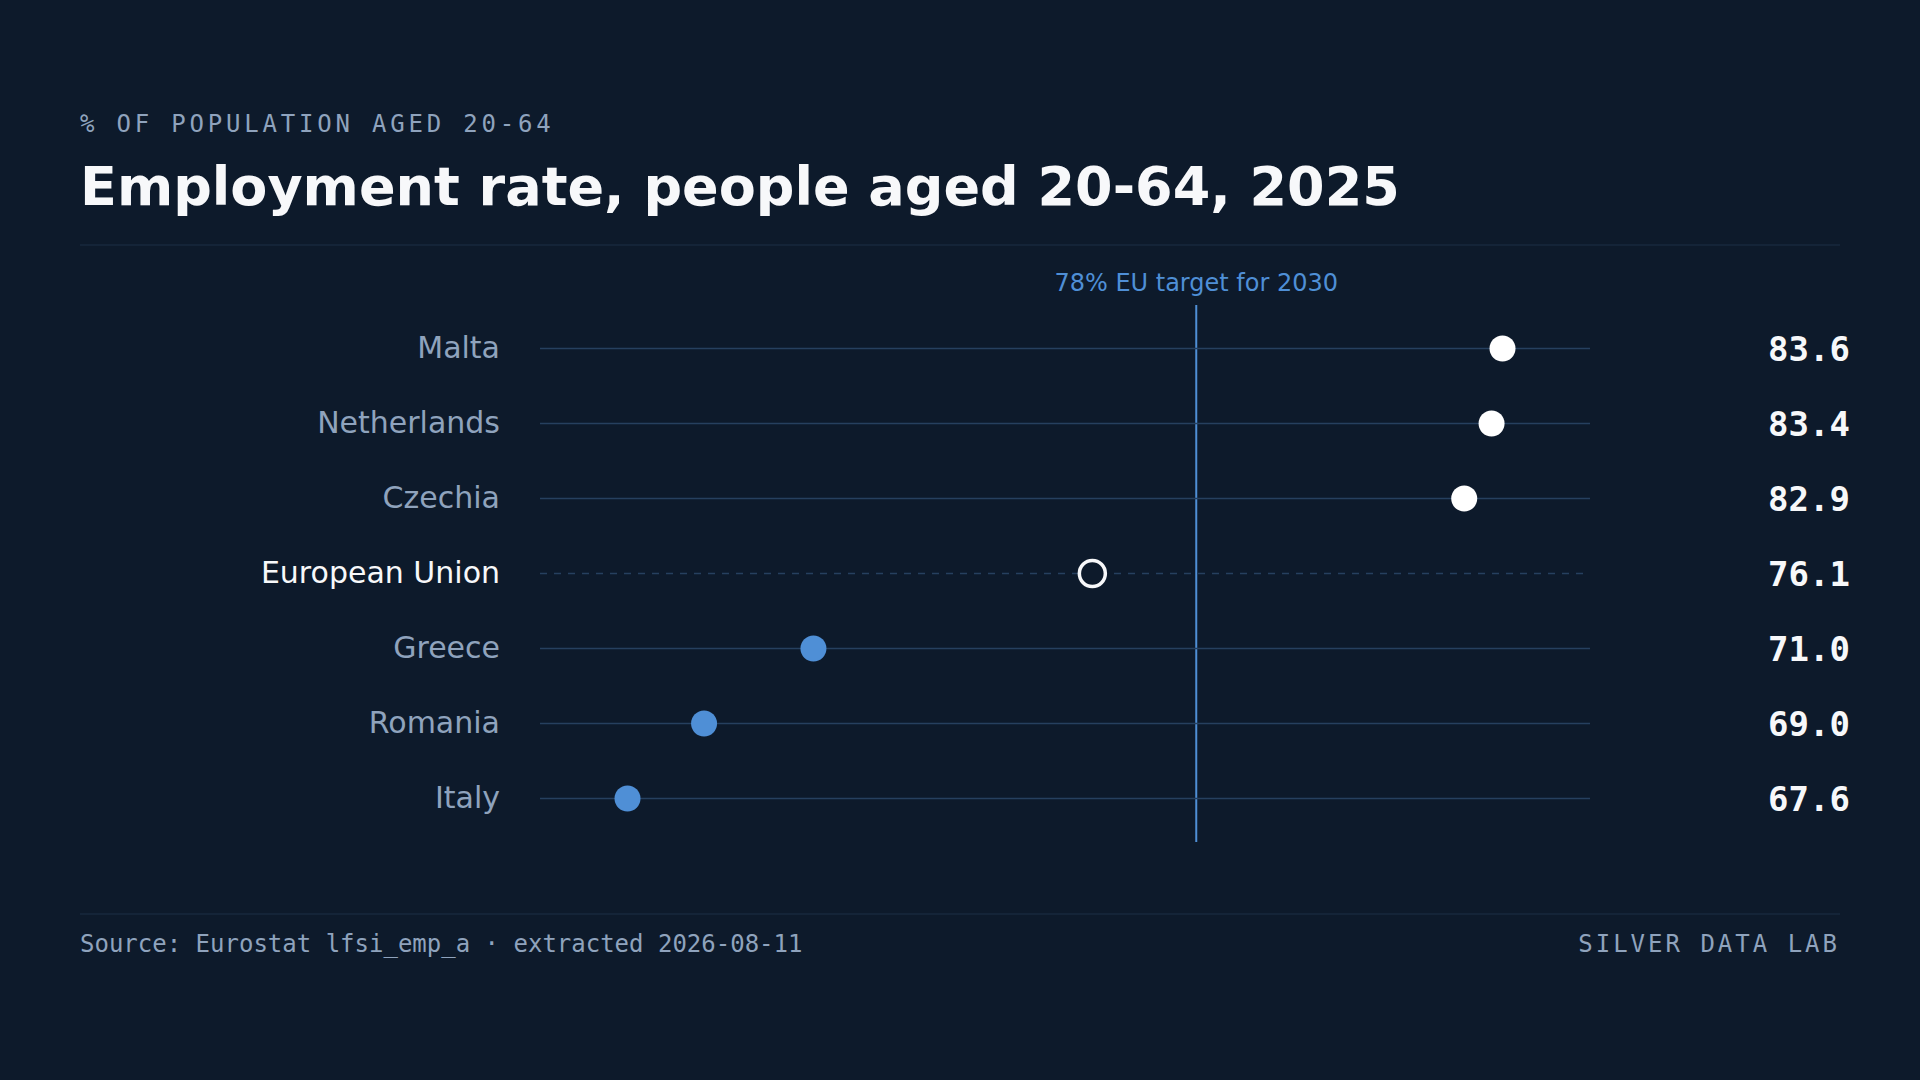
76.1% of people aged 20 to 64 were in employment across the EU in 2025, or 197.8 million people — the highest reading since the series began in 2009.
Most Danish Children Under Three Are in Full-Time Childcare
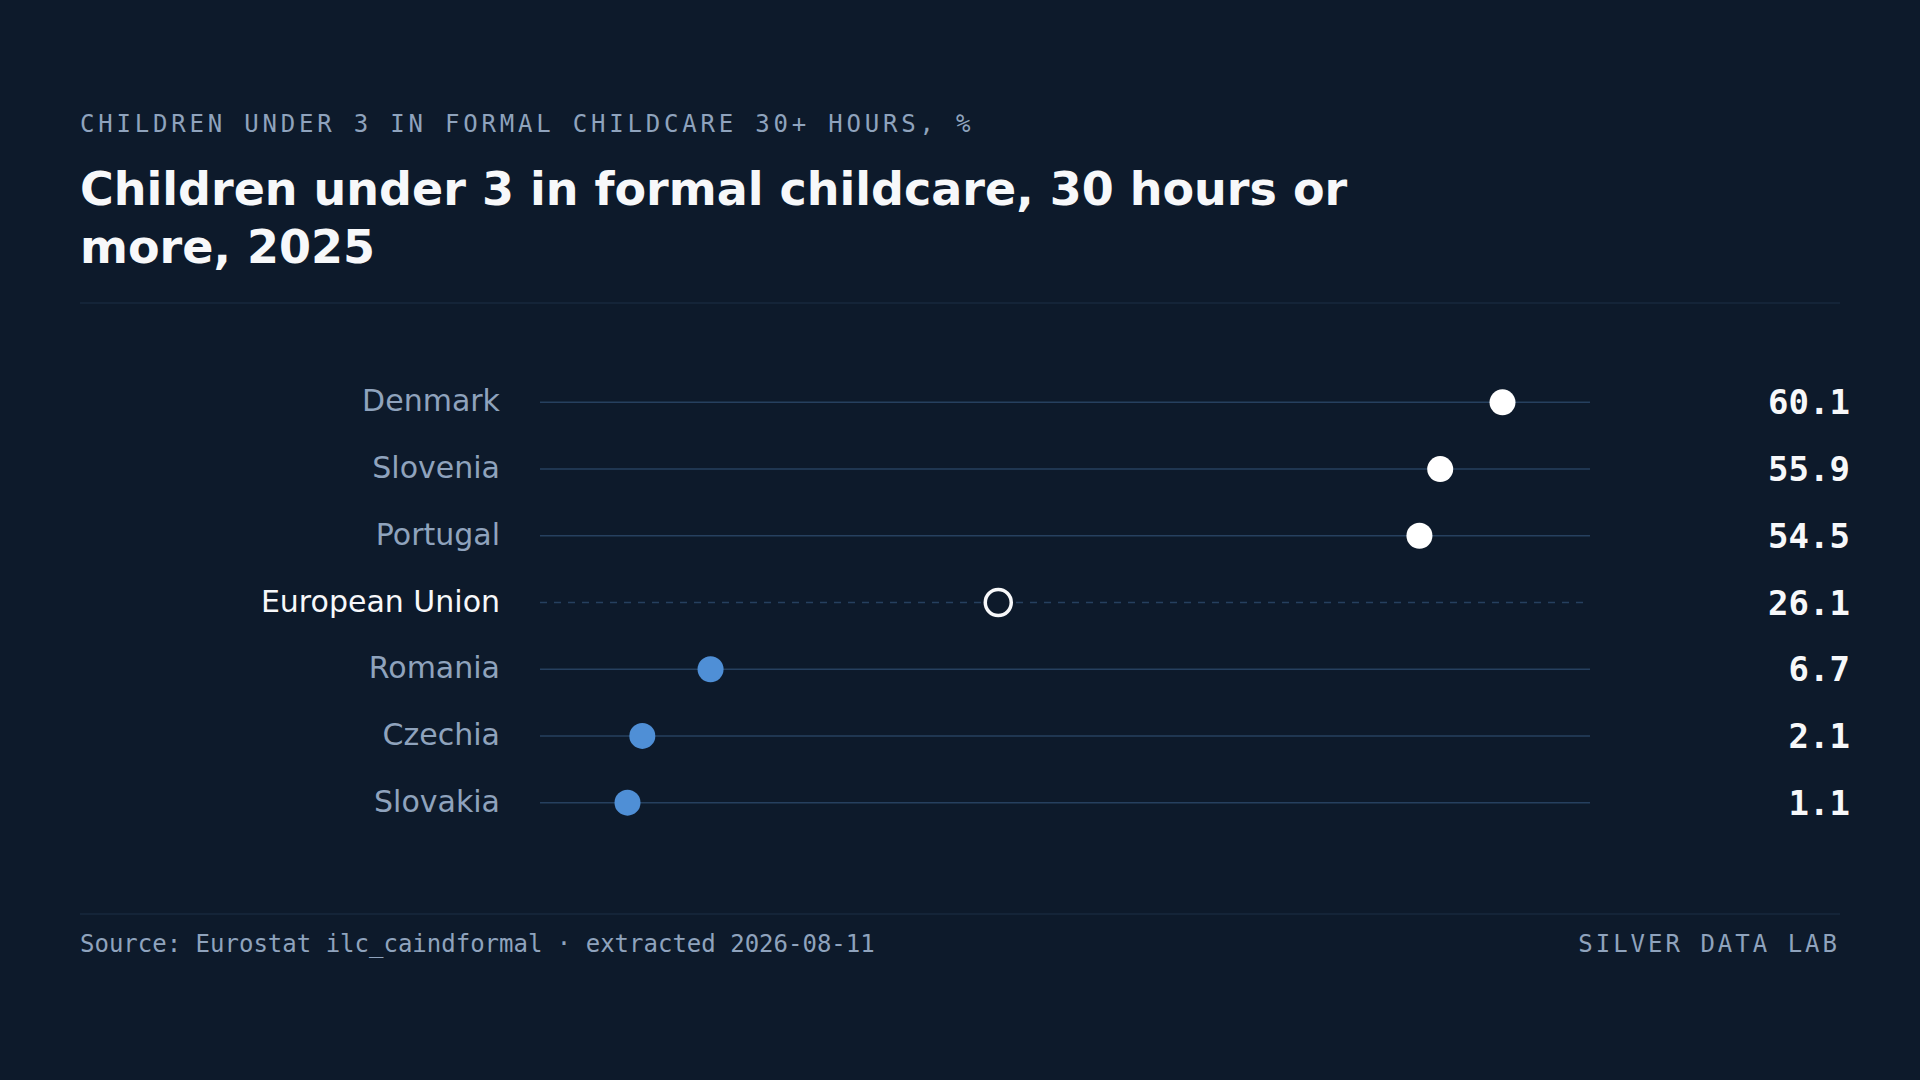
26.1% of EU children under three attended formal childcare for 30 hours a week or more in 2025.
Sweden's Youth Unemployment Is Higher Than Greece's
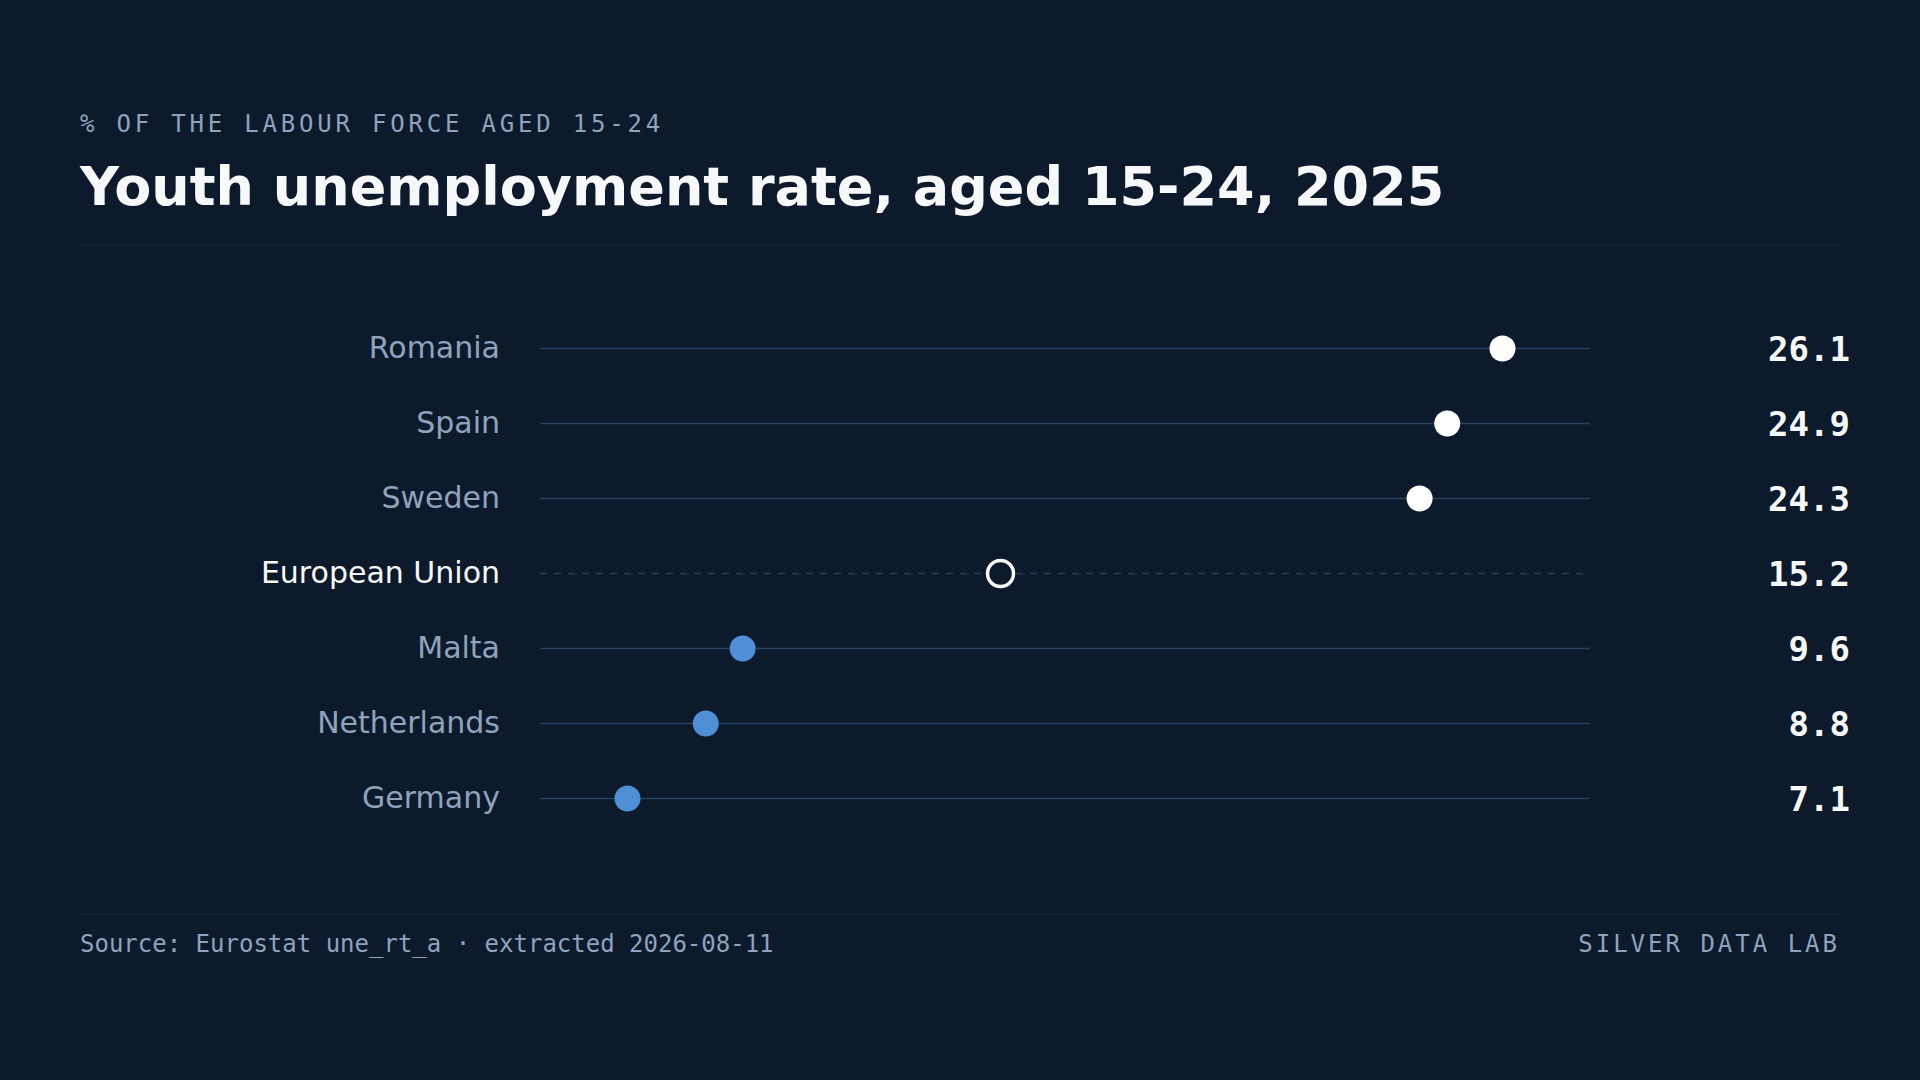
15.2% of the EU labour force aged 15 to 24 was unemployed in 2025.
Studies where the same country leads or trails
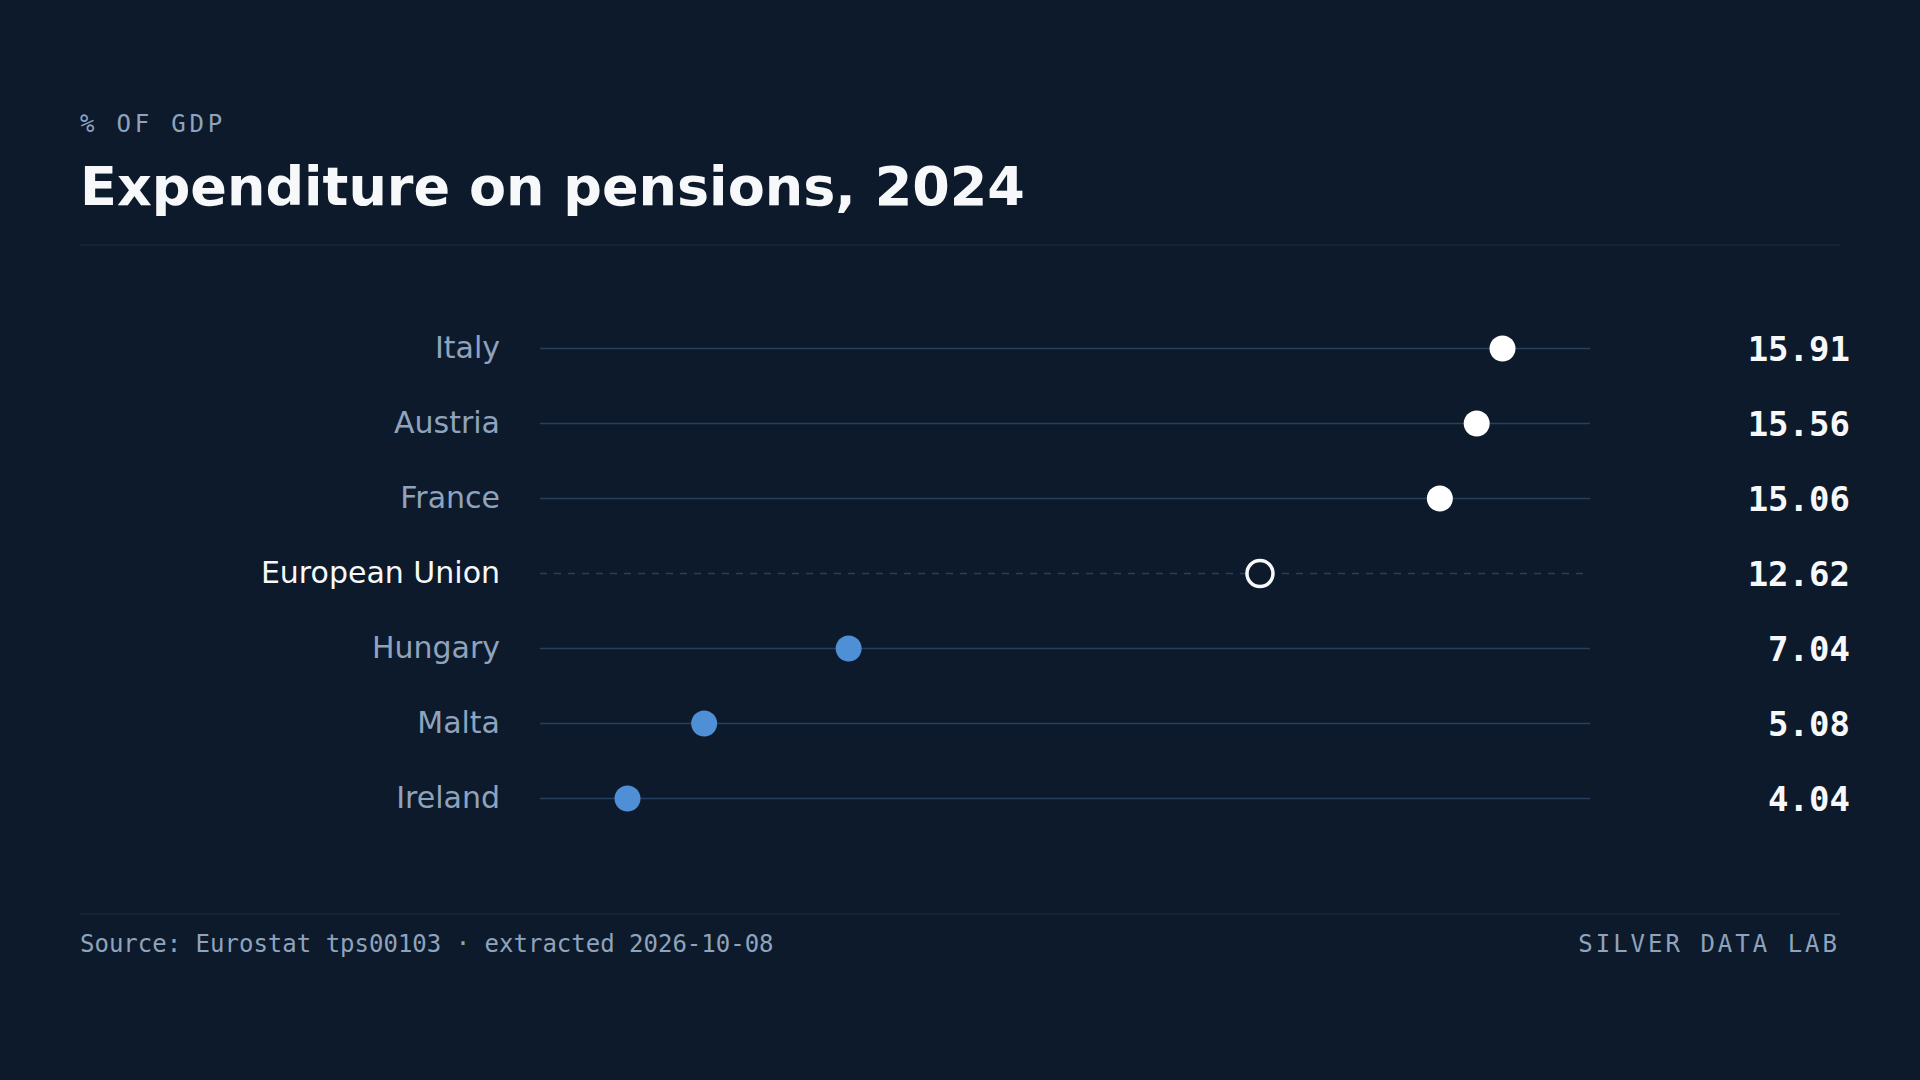
Italy Spends a Larger Share of GDP on Pensions Than Any Other EU Country
The EU spent a provisional 12.62% of its GDP on pensions in 2024, up from an estimated 12.31% in 2023 but still below the estimated 13.15% of 2013.
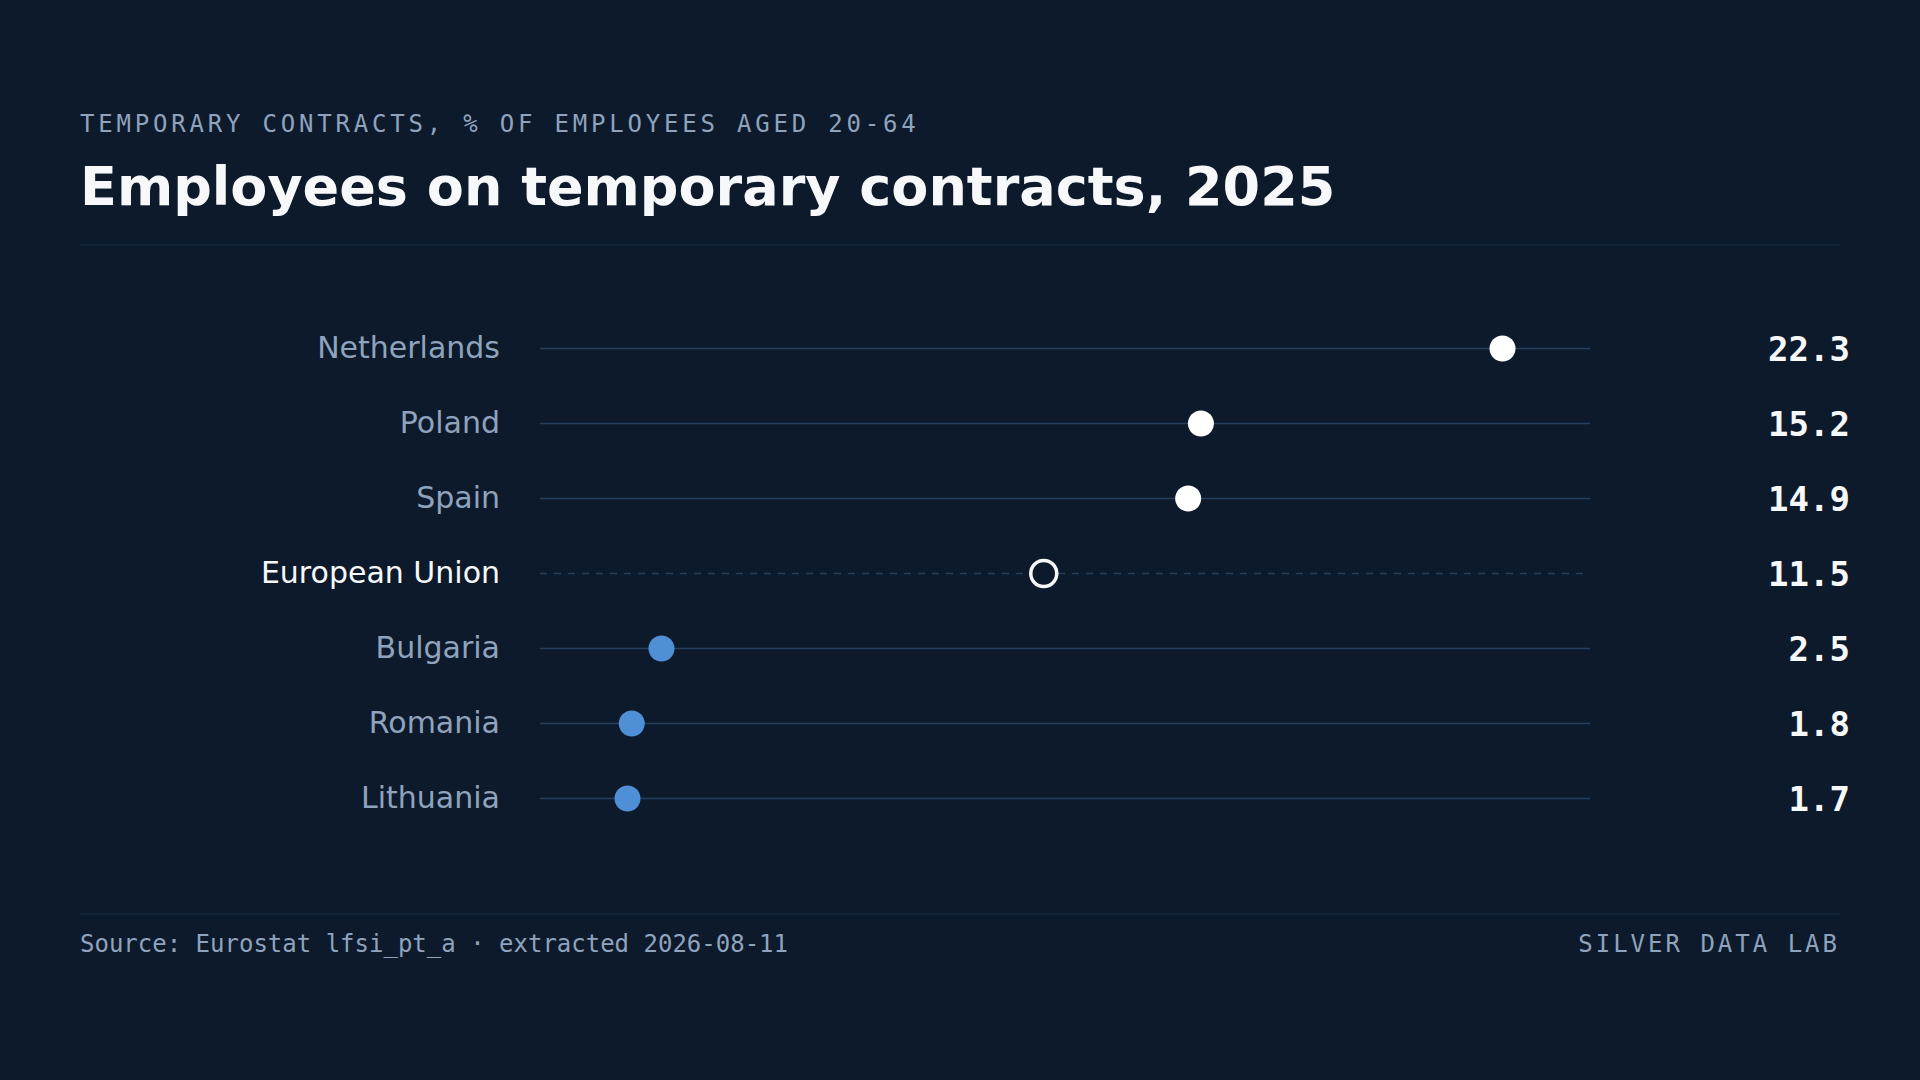
More Than One Dutch Employee in Five Is on a Temporary Contract
11.5% of employees aged 20 to 64 in the EU were on temporary contracts in 2025.
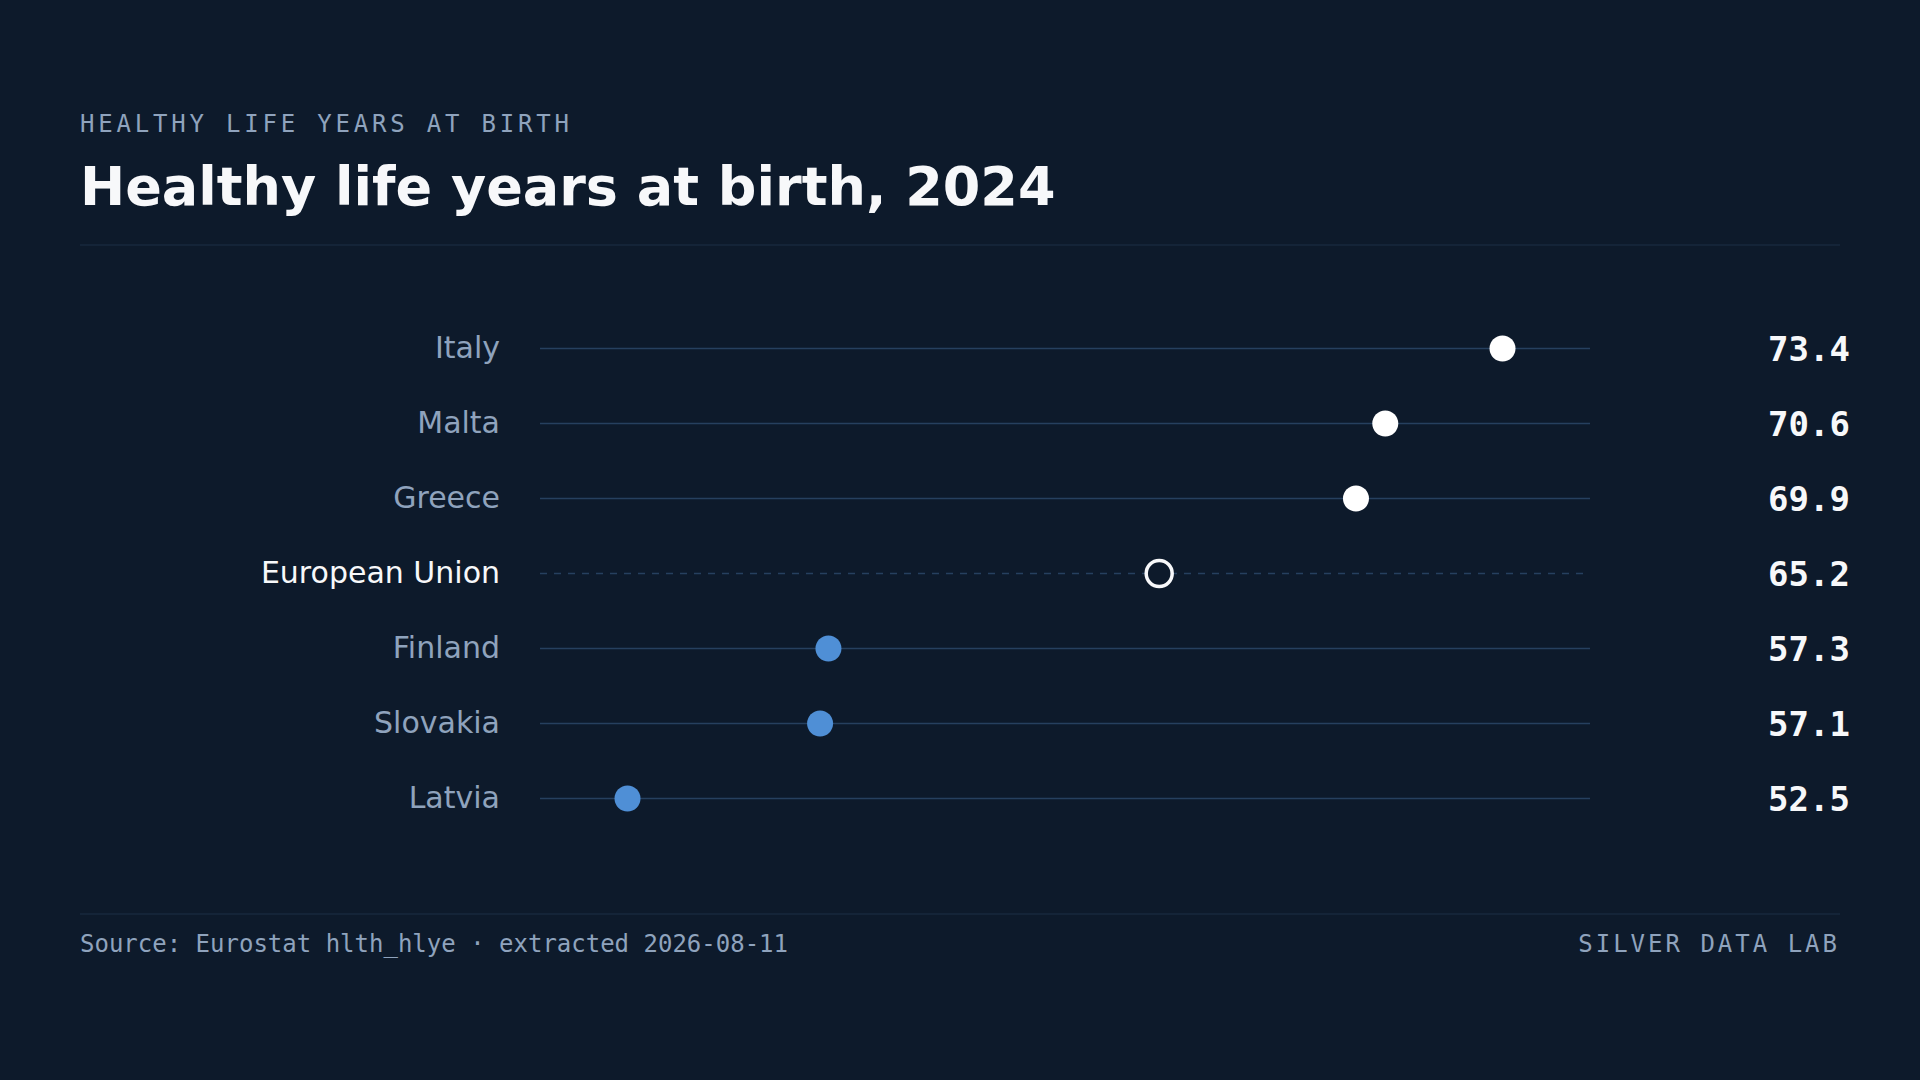
Italians Can Expect Nearly 21 More Healthy Years Than Latvians
A person born in the EU in 2024 could expect 65.2 years free of activity limitation.