Employment Rates Vary Far More Between EU Regions Than Between Countries
Silver Data Lab Research Desk · Statistical analysis · Published on 03 July 2026
- Data source
- Eurostat
- Reference period
- 2025
- Last updated
- 22 October 2026
Re-checked against the source on 22 October 2026. No value in its datasets has moved between the snapshots we hold. Every revision we have observed →
Key estimates
- 76.1% of people aged 20 to 64 were in employment across the EU in 2025, or 197.8 million people — the highest reading since the series began in 2009.
- The 2030 target of 78% is 1.9 percentage points away, after a gain of 0.4 points in the last year.
- Malta leads at 83.6% and Italy trails at 67.6%, a spread of 16.0 percentage points between the highest and lowest Member State.
- Italy's position is a gender story: at 58.0% Italian women record the lowest female employment rate in the Union, and the 19.1 point gap with Italian men is the widest anywhere in the EU.
- Regional distances are far larger than national ones: 36.9 points between the highest region and the lowest comparable one in 2025, against 16.0 points between Member States.
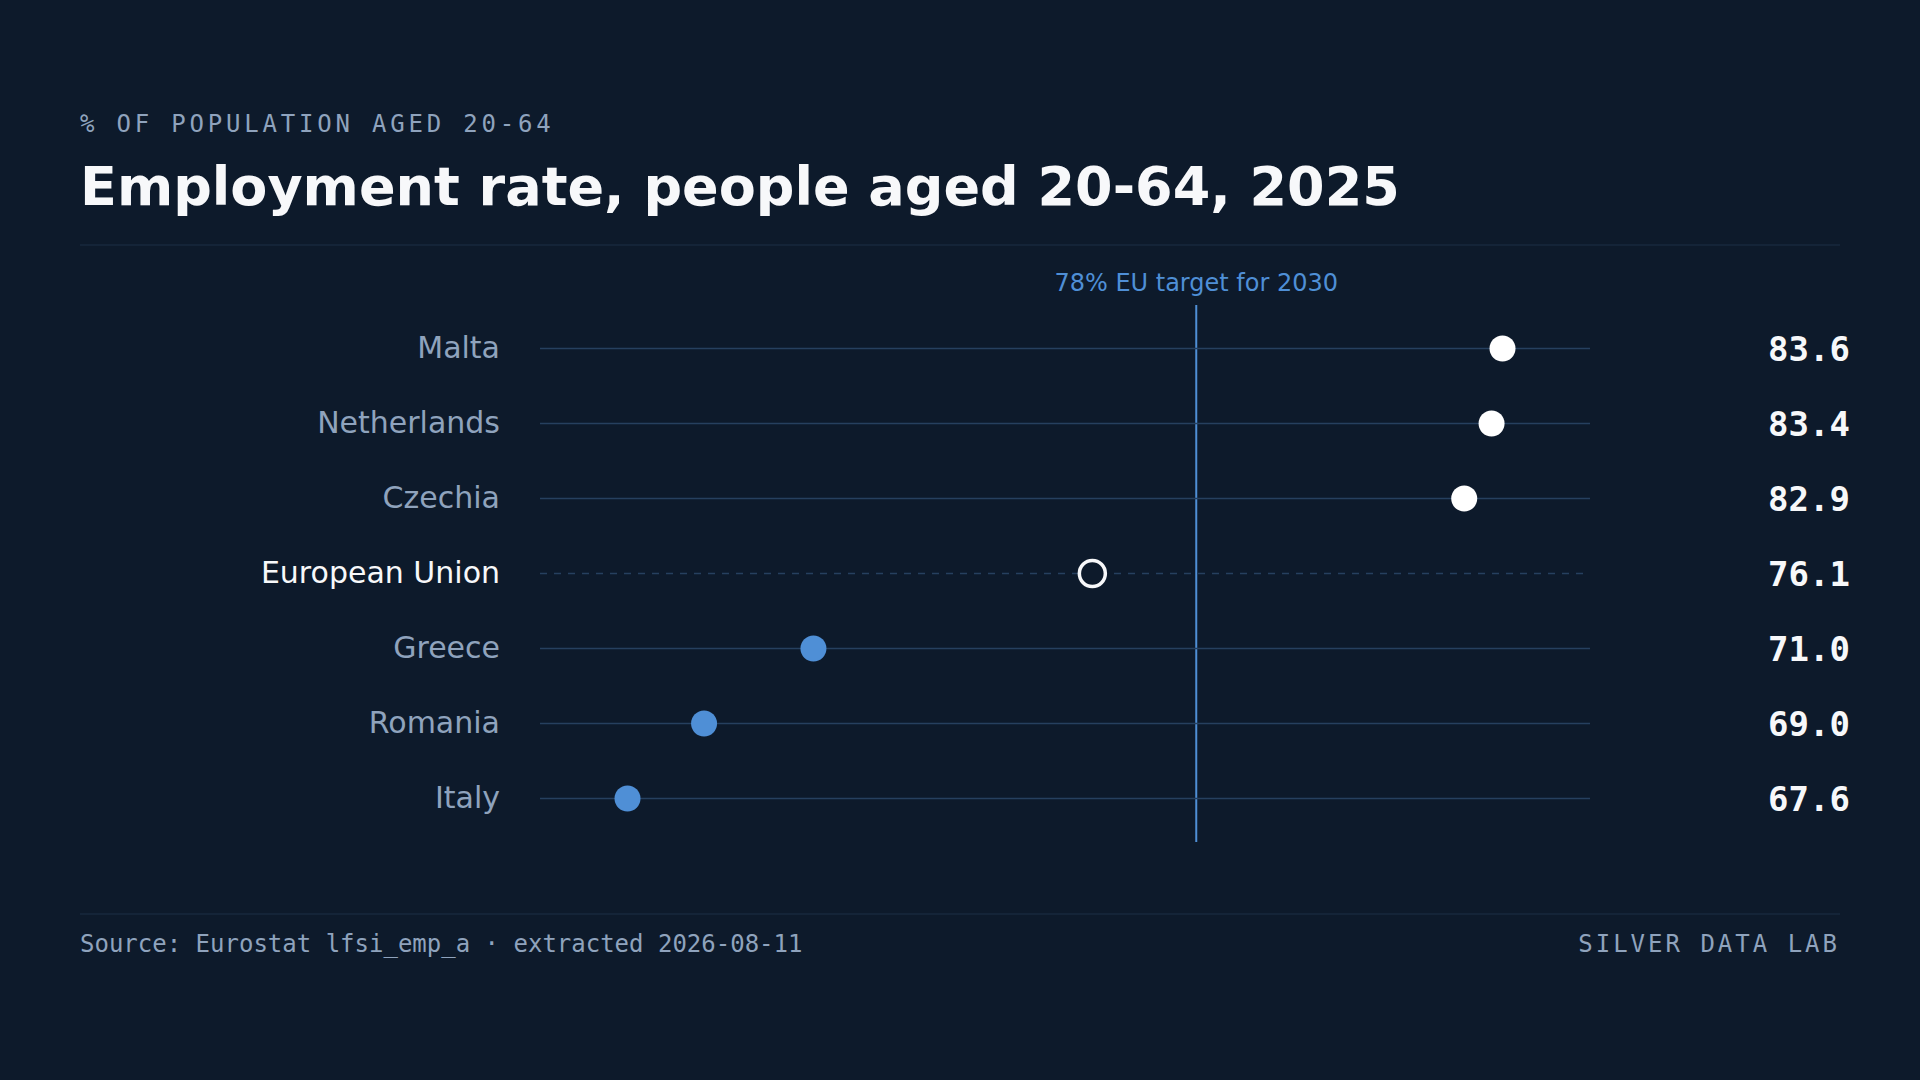
The EU is close to a target it has never met
The employment rate of people aged 20 to 64 reached 76.1% across the European Union in 2025. Behind that percentage are 197.8 million people in work, and the highest reading in a series that begins in 2009, when the same measure stood at 67.3%.
The figure matters because the Union has committed to a number. The European Pillar of Social Rights Action Plan sets a headline target of 78% by 2030. The distance left is 1.9 percentage points, and the gain over the last twelve months was 0.4 points. On that pace the target arrives late rather than never, which is a more interesting position than either success or failure: it makes the composition of the remaining gap the thing worth reading.
Where the Union is wide
The distance between Member States is 16.0 percentage points. Malta records the highest rate at 83.6%, followed by the Netherlands at 83.4% and Czechia at 82.9%. At the other end sit Greece at 71.0%, Romania at 69.0% and Italy at 67.6%.
Malta and the Netherlands already sit more than five points above the 2030 target, and Czechia 4.9 points above it. At the other end, Italy would have to gain 10.4 points to reach the target, Romania 9.0 and Greece 7.0. Gains of that size have happened: nine Member States added at least 10.4 points between 2015 and 2025, Greece itself 16.2, though a span that long crosses the break noted below. The EU aggregate is not a description of a typical country: sixteen of the twenty-seven Member States already meet the 78% target, and the Member State in the middle of the ranking is at 78.3%, above both the aggregate and the target.
Italy's gap is a gender gap
Italy's last place is not a general weakness spread evenly across its population. Italian men record an employment rate of 77.1%, which is low — three Member States are lower and Spain is level with it — but not extreme: it is 3.8 points under the EU male average of 80.9% and 0.7 above the lowest. Italian women record 58.0%, the lowest female employment rate in the Union, 1.5 points below Romania at 59.5% and further still below Greece at 62.3%.
The resulting distance between Italian men and Italian women is 19.1 percentage points, the widest of any Member State, ahead of Romania at 18.7 and Greece at 17.4. Across the EU as a whole the same gap is 9.6 points, women at 71.3% against men at 80.9%.
This reframes the national ranking. Italy's male rate is low and its female rate is the Union's lowest, and it is the female rate that puts the national average at the bottom of the table: a country that closed its gender gap to the EU average, with its male rate unchanged, would arithmetically no longer be last.
Regions diverge more than countries do
National averages compress the picture. The 244 EU regions with a published value for 2025 spread over 50.0 points, or 36.9 once Mayotte is set aside — either way more than twice the national one.
The highest regional rate is Warszawski stołeczny, the region around Warsaw, at 86.9%, ahead of Praha, the region of Prague, at 86.0% and Åland, the Finnish archipelago, at 85.5%. Five regions in total exceeded 85%, with a sixth exactly on it, against an EU aggregate of 76.1%.
Setting aside Mayotte, which is discussed below, the lowest are Guyane, the French department on the northern coast of South America, at 50.0%, then Calabria at 50.3% and Campania at 50.8%. A year earlier Calabria and Campania were both under half; in 2025 none is, and Guyane sits exactly on the line.
The pattern that survives inspection is not north against south in the abstract. It is capital and near-capital regions pulling away from peripheries within the same country. Warszawski stołeczny is the highest region in the Union while Poland sits thirteenth of the twenty-seven Member States, and the distance between it and Podkarpackie, Poland's lowest region, is 13.7 points — most of the way to the 16.0 points that separate the highest Member State from the lowest.
Employment rate, people aged 20-64, 2025
| Country | Employment rate (%) | Gap to EU averagepercentage points, derived |
|---|---|---|
| Malta | 83.6 | +7.5 |
| Netherlands | 83.4 | +7.3 |
| Czechia | 82.9 | +6.8 |
| European Unionaggregate | 76.1 | — |
| Greece | 71.0 | −5.1 |
| Romania | 69.0 | −7.1 |
| Italy | 67.6 | −8.5 |
This table as data: CSV · JSON
Every Member State for this indicator+
Members see every Member State for this indicator here, not only the rows the ranking prints. Become a Member
Embed this chart
Paste this code into a page. The frame carries the source and the extraction date, and links back to the study.
Employment rate by NUTS 2 region, people aged 20-64, 2025
| Country | Employment rate (%) | Gap to EU averagepercentage points, derived |
|---|---|---|
| Warszawski stołeczny (PL) | 86.9 | +10.8 |
| Praha (CZ) | 86.0 | +9.9 |
| Åland (FI) | 85.5 | +9.4 |
| European Unionaggregate | 76.1 | — |
| Campania (IT) | 50.8 | −25.3 |
| Calabria (IT) | 50.3 | −25.8 |
| Guyane (FR) | 50.0d | −26.1 |
Flags carried by the source on these values: d definition differs
This table as data: CSV · JSON
Every Member State for this indicator+
Members see every Member State for this indicator here, not only the rows the ranking prints. Become a Member
Embed this chart
Paste this code into a page. The frame carries the source and the extraction date, and links back to the study.
What these figures cannot tell you
- One region falsifies the simple version of the ranking
- Mayotte records 36.9% in 2025, below every region named above. It is excluded from the ranking here because Eurostat covers it through a separate annual survey, which makes it not directly comparable with the rest of the series. The definition-differs flag Mayotte also carries is not the reason and could not be: 46 of the 244 regions carry it, every French and every Spanish region among them. The exclusion is legitimate; leaving it unstated would not be. Read as 'the three lowest regions in the EU' without that qualification, the claim is false.
- Results before and after 2021 are not fully comparable
- A break in the series falls on 1 January 2021 with the introduction of the new EU Labour Force Survey framework. Comparisons that span that date — including the 2009 starting point and the decade of gains cited above — carry that discontinuity and should be read as an order of magnitude rather than an exact distance. A second and much narrower break is flagged at 2024, on every French region and every Bulgarian one — 33 of the 244 values. None of the 2025 values carries one, so a comparison between 2024 and 2025 is unaffected by it.
- Regional figures are by place of residence
- Eurostat assigns regional employment by region of usual residence, which can differ from place of work. In metropolitan areas with heavy commuting this inflates the residential regions around a city relative to the city itself, and it is a measurement artefact rather than a labour market phenomenon. It should not be confused with the real exclusion visible in youth and NEET indicators.
- Corsica's figures are flagged unreliable
- Corsica's sample is too small to support reliable regional estimates, and Eurostat flags its value accordingly: in 2025 Corsica is the only one of the 244 regions whose value carries that flag. No figure on this page rests on it. Mayotte is the separate case above: its value is printed only to say why the region is excluded, never to support a claim.
Frequently asked questions
- What is the EU employment rate in 2025?
- 76.1% of people aged 20 to 64 were in employment, or 197.8 million people. It is the highest level since the series began in 2009, up 0.4 percentage points on 2024, and 1.9 points below the 78% target set for 2030.
- Which EU country has the lowest employment rate?
- Italy, at 67.6% in 2025, behind Romania (69.0%) and Greece (71.0%). Malta recorded the highest rate, at 83.6%, so the distance between the highest and lowest Member State is 16.0 percentage points.
- Why is Italy's employment rate the lowest in the EU?
- Female participation. Italian women had an employment rate of 58.0% in 2025, the lowest in the Union, while Italian men were at 77.1%. The resulting gender gap of 19.1 percentage points is the widest of any Member State, against an EU average gap of 9.6 points.
- Which European region has the highest employment rate?
- Of the Union's own regions, Warszawski stołeczny — the region around Warsaw — at 86.9% in 2025, ahead of Praha at 86.0% and Åland, the Finnish archipelago, at 85.5%. Five of them exceeded 85%, with a sixth exactly on it.
- Which EU regions have the lowest employment rates?
- Setting aside Mayotte, the three lowest in 2025 were Guyane (50.0%), Calabria (50.3%) and Campania (50.8%). Mayotte is lower than any of them, at 36.9%, but it is covered by a separate annual survey, so it is not directly comparable. No comparable region now has fewer than half of people aged 20 to 64 in work; a year earlier Calabria and Campania both did.
- Does the employment rate mean the rest are unemployed?
- No. The denominator is the total population aged 20 to 64, not the labour force. The 23.9% not in employment in 2025 includes students, people caring for family members, the long-term sick and the early retired, alongside the unemployed.
Methodological note
The employment rate is the share of the population aged 20 to 64 that is in employment. The denominator is the total population of that age band, not the labour force — a rate of 76.1% does not mean that 23.9% are unemployed, since the remainder includes students, carers, the long-term sick and the early retired.
The age band is 20-64 throughout, which is the band the EU's 2030 target is defined on. Eurostat's default view for the regional dataset is 15-64 and produces figures roughly five points lower; the two are not interchangeable. Both extractions used here are archived under data/eurostat/ with their filters recorded, so any figure on this page can be rechecked against the file it came from. National and regional figures are both for 2025, which is the latest year complete in each series.
The national extraction carries the whole published series and both of the units the indicator is published in, the rate and the headcount, so the 197.8 million, the 67.3% recorded for 2009 and the gains over the last decade are read from the same file as the 2025 rates. The EU aggregate's own series begins in 2009, and so does every Member State's except France, which reaches back to 2003, and Sweden, which reaches back to 2005.
The gap between a country and the EU aggregate, wherever it appears, is derived by Silver Data Lab by subtraction and is labelled as derived. So is every other count, spread, distance and middle value on this page: the distances to the 2030 target, the regional spread, the counts of Member States and of regions, and the tallies of flagged values. Eurostat publishes none of them.
Source data
This study draws on 2 datasets from Eurostat. Each can be inspected and re-downloaded from its catalogue, and the filters below are the ones applied.
Employment and labour force by sex and age — annual data
lfsi_emp_a
- Filters applied:
- freq=A · indic_em=EMP_LFS · unit=PC_POP, THS_PER · age=Y20-64 · sex=T, F, M
- Extracted:
- 2026-10-22
- Source last updated:
- 2026-09-10
Employment rates by educational attainment level, citizenship and NUTS 2 region
lfst_r_lfe2emprtn
- Filters applied:
- freq=A · citizen=TOTAL · isced11=TOTAL · age=Y20-64 · sex=T · unit=PC
- Extracted:
- 2026-09-11
- Source last updated:
- 2026-09-10
Download the data
The data the study you have just read is built on, exactly as it was downloaded and archived.
Open to every reader as a sample of what Members download.
How to cite
Record the vintage as well as the study: the figures on this page are the ones extracted on the dates below.
Silver Data Lab Research Desk (2026). Employment Rates Vary Far More Between EU Regions Than Between Countries. Silver Data Lab, published 03 July 2026, last updated 22 October 2026. https://www.silverdatalab.com/studies/european-regional-employment-divide
- Data: Eurostat, Employment and labour force by sex and age — annual data (lfsi_emp_a), filters freq=A, indic_em=EMP_LFS, unit=PC_POP, THS_PER, age=Y20-64, sex=T, F, M; extracted 2026-10-22; source last updated 2026-09-10. https://doi.org/10.2908/lfsi_emp_a
- Data: Eurostat, Employment rates by educational attainment level, citizenship and NUTS 2 region (lfst_r_lfe2emprtn), filters freq=A, citizen=TOTAL, isced11=TOTAL, age=Y20-64, sex=T, unit=PC; extracted 2026-09-11; source last updated 2026-09-10. https://doi.org/10.2908/lfst_r_lfe2emprtn
Silver Data Lab's analysis is licensed CC BY 4.0. The statistics remain their publisher's and keep its terms of reuse.
Ask the research desk
A question about this study — a definition, a filter, a break in the series, what the figures can and cannot support — answered by the desk that made the extraction.
Members can write to the research desk
Other studies on the same dataset
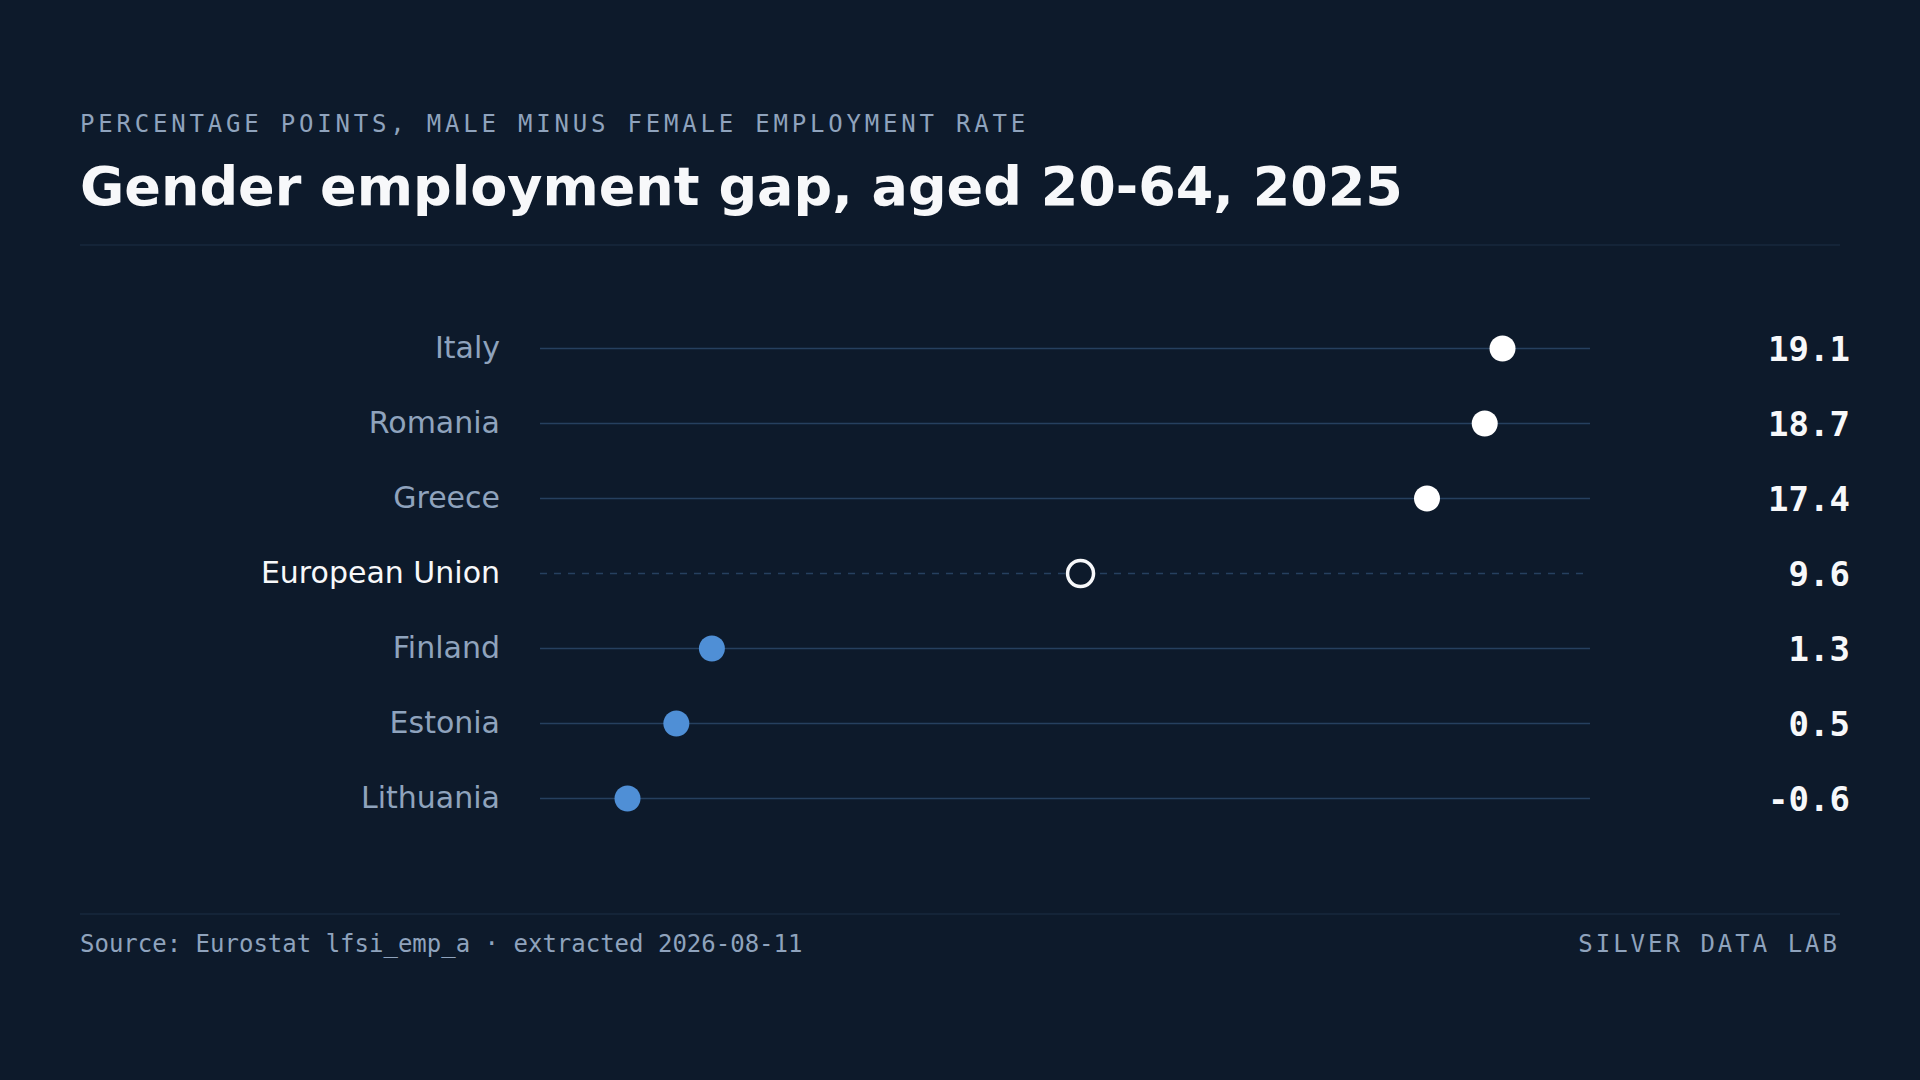
Lithuania Is the Only EU Country Where Women's Employment Exceeds Men's
Male employment exceeded female employment by 9.6 percentage points across the EU in 2025.
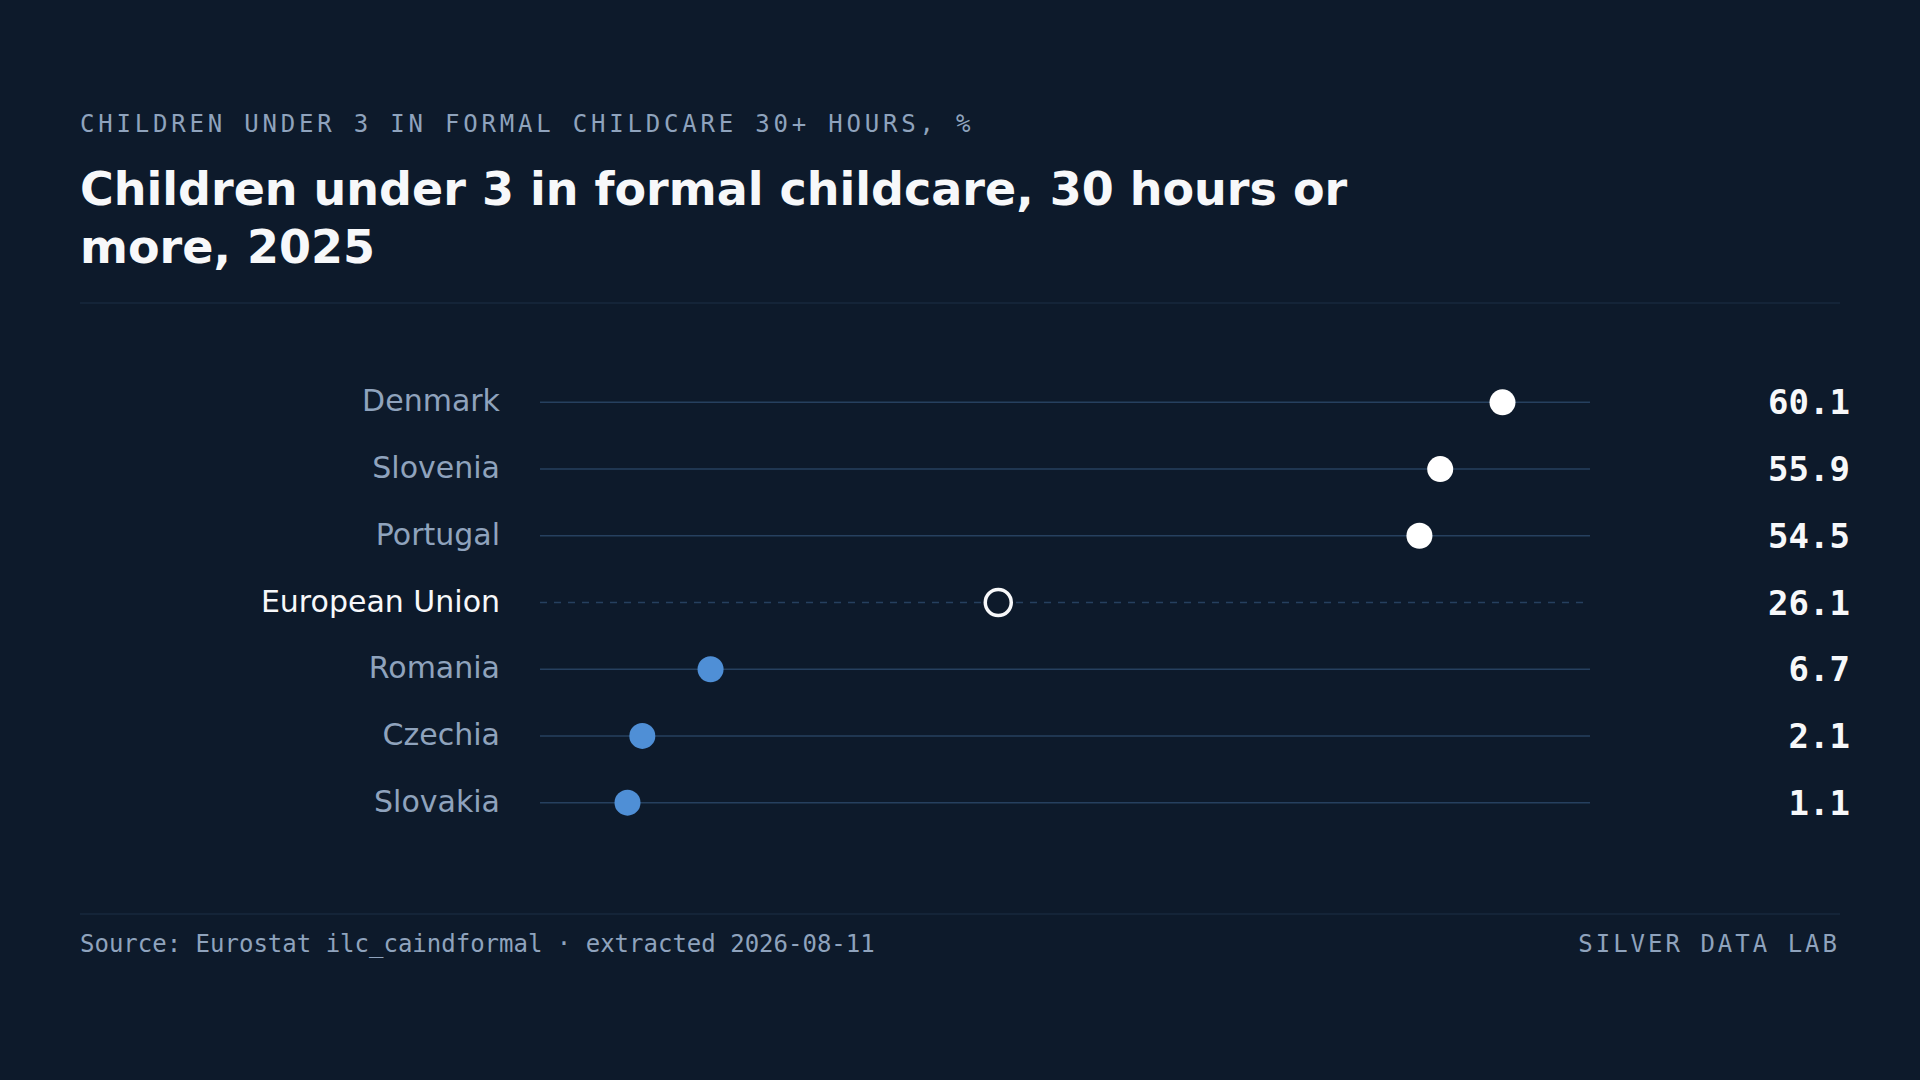
Most Danish Children Under Three Are in Full-Time Childcare
26.1% of EU children under three attended formal childcare for 30 hours a week or more in 2025.
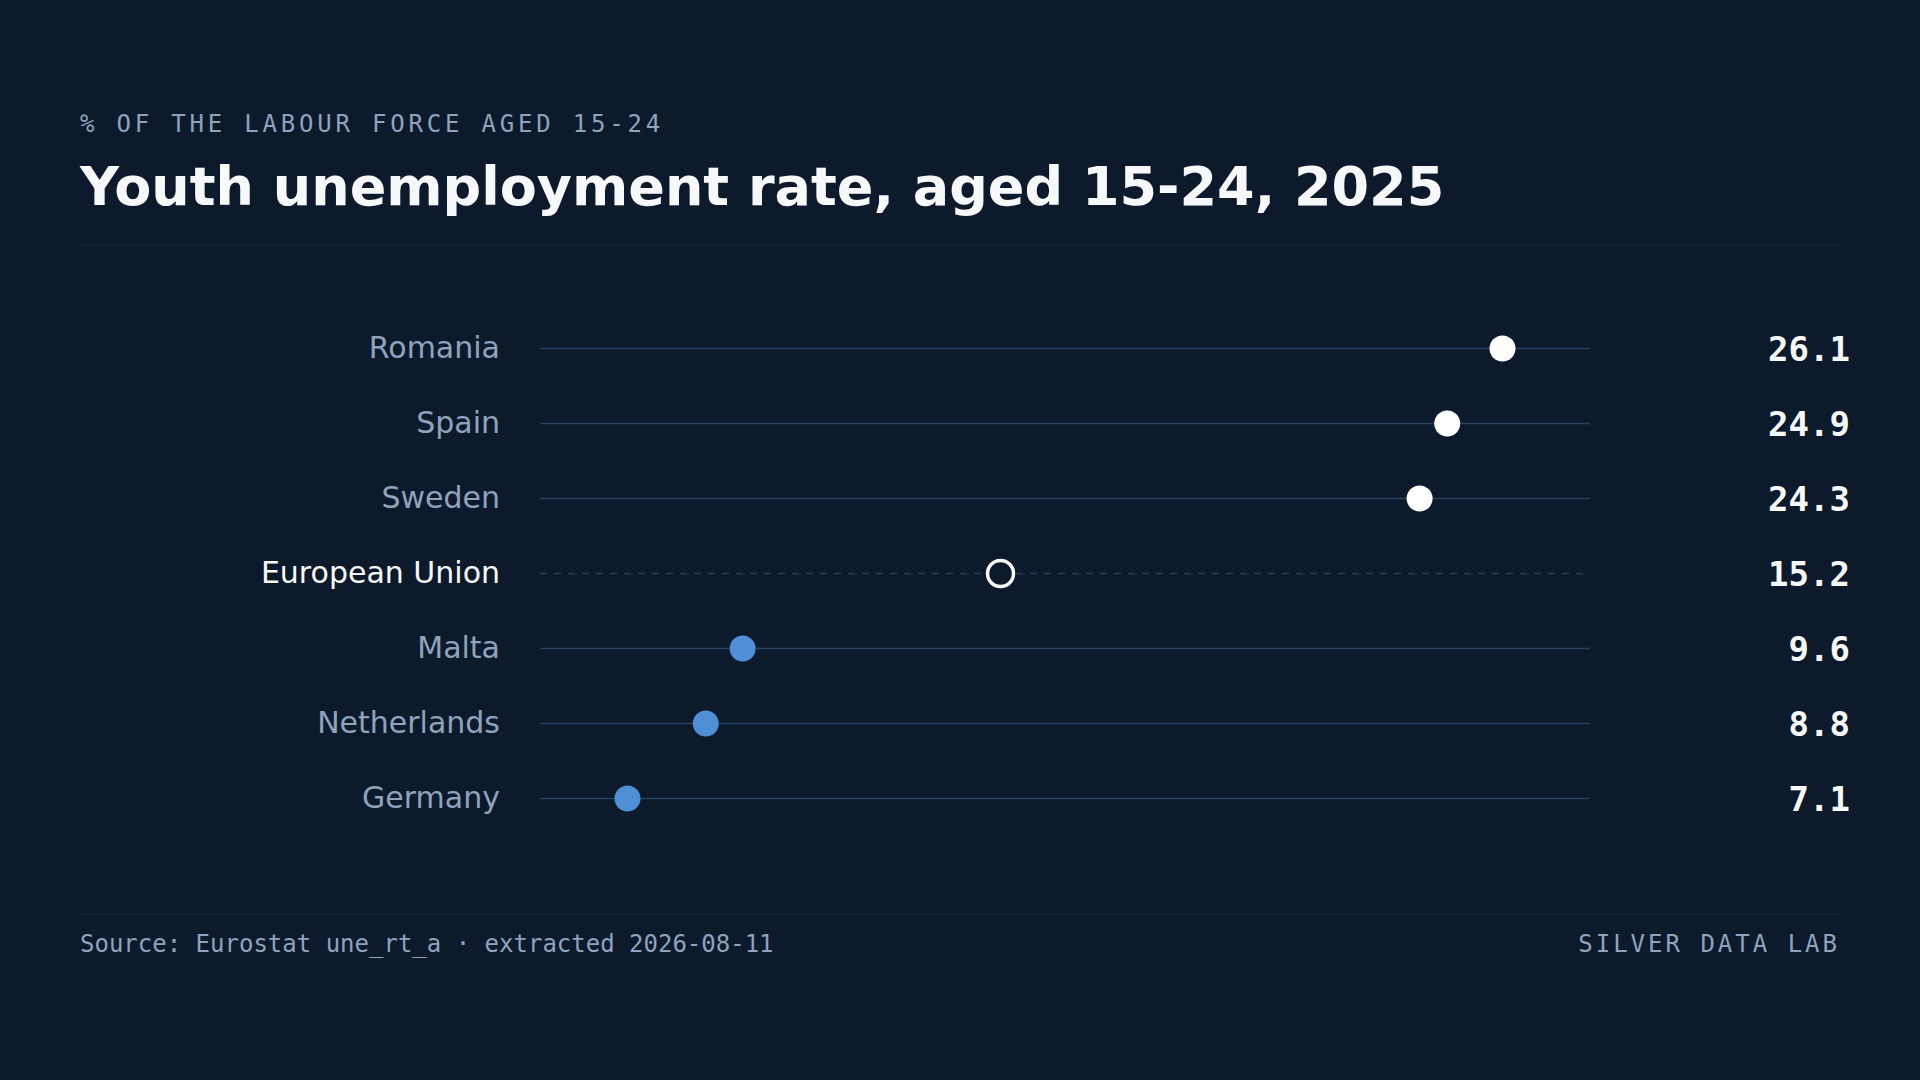
Sweden's Youth Unemployment Is Higher Than Greece's
15.2% of the EU labour force aged 15 to 24 was unemployed in 2025.
Studies where the same country leads or trails
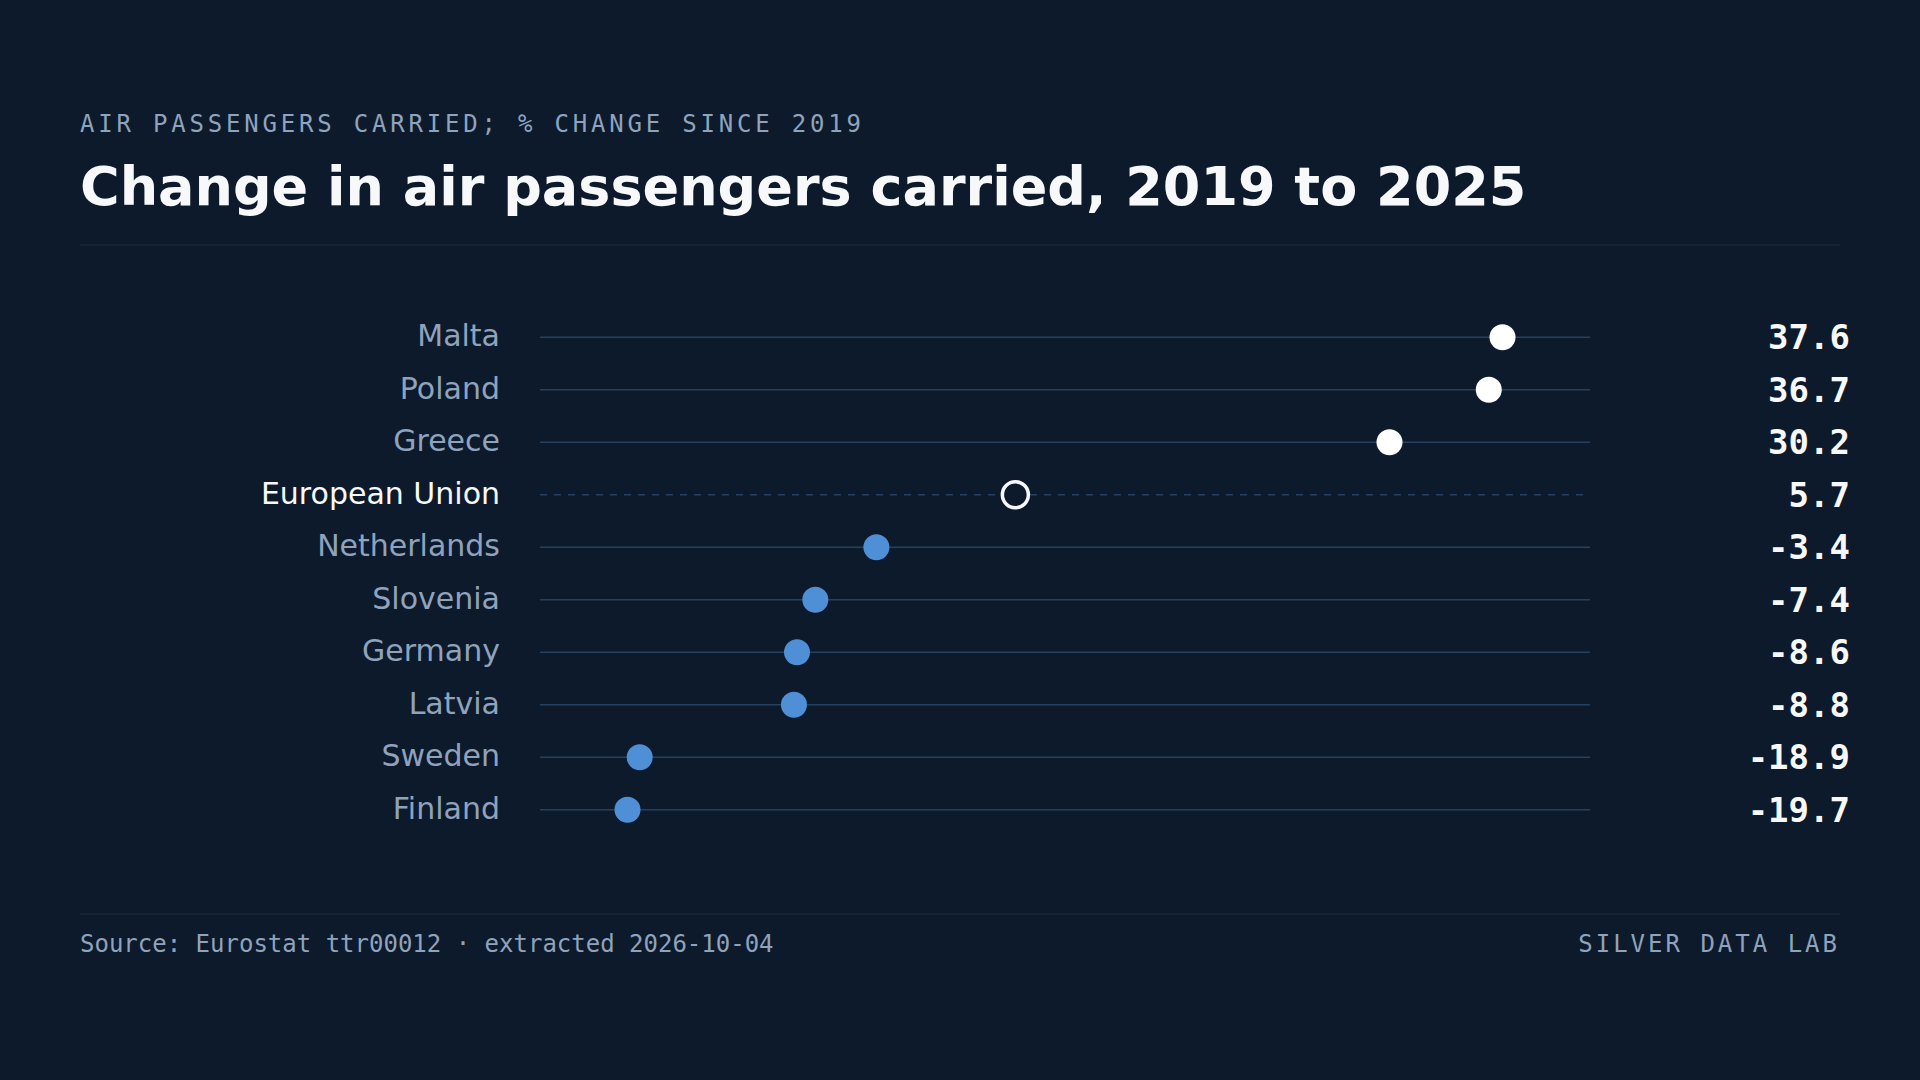
Air Travel in the EU Is Back Above Its Pre-Pandemic Level
Air passengers carried in the EU reached 1,093.6 million in 2025, 5.7% more than in 2019; the total first passed its 2019 level in 2024, by 0.7%.
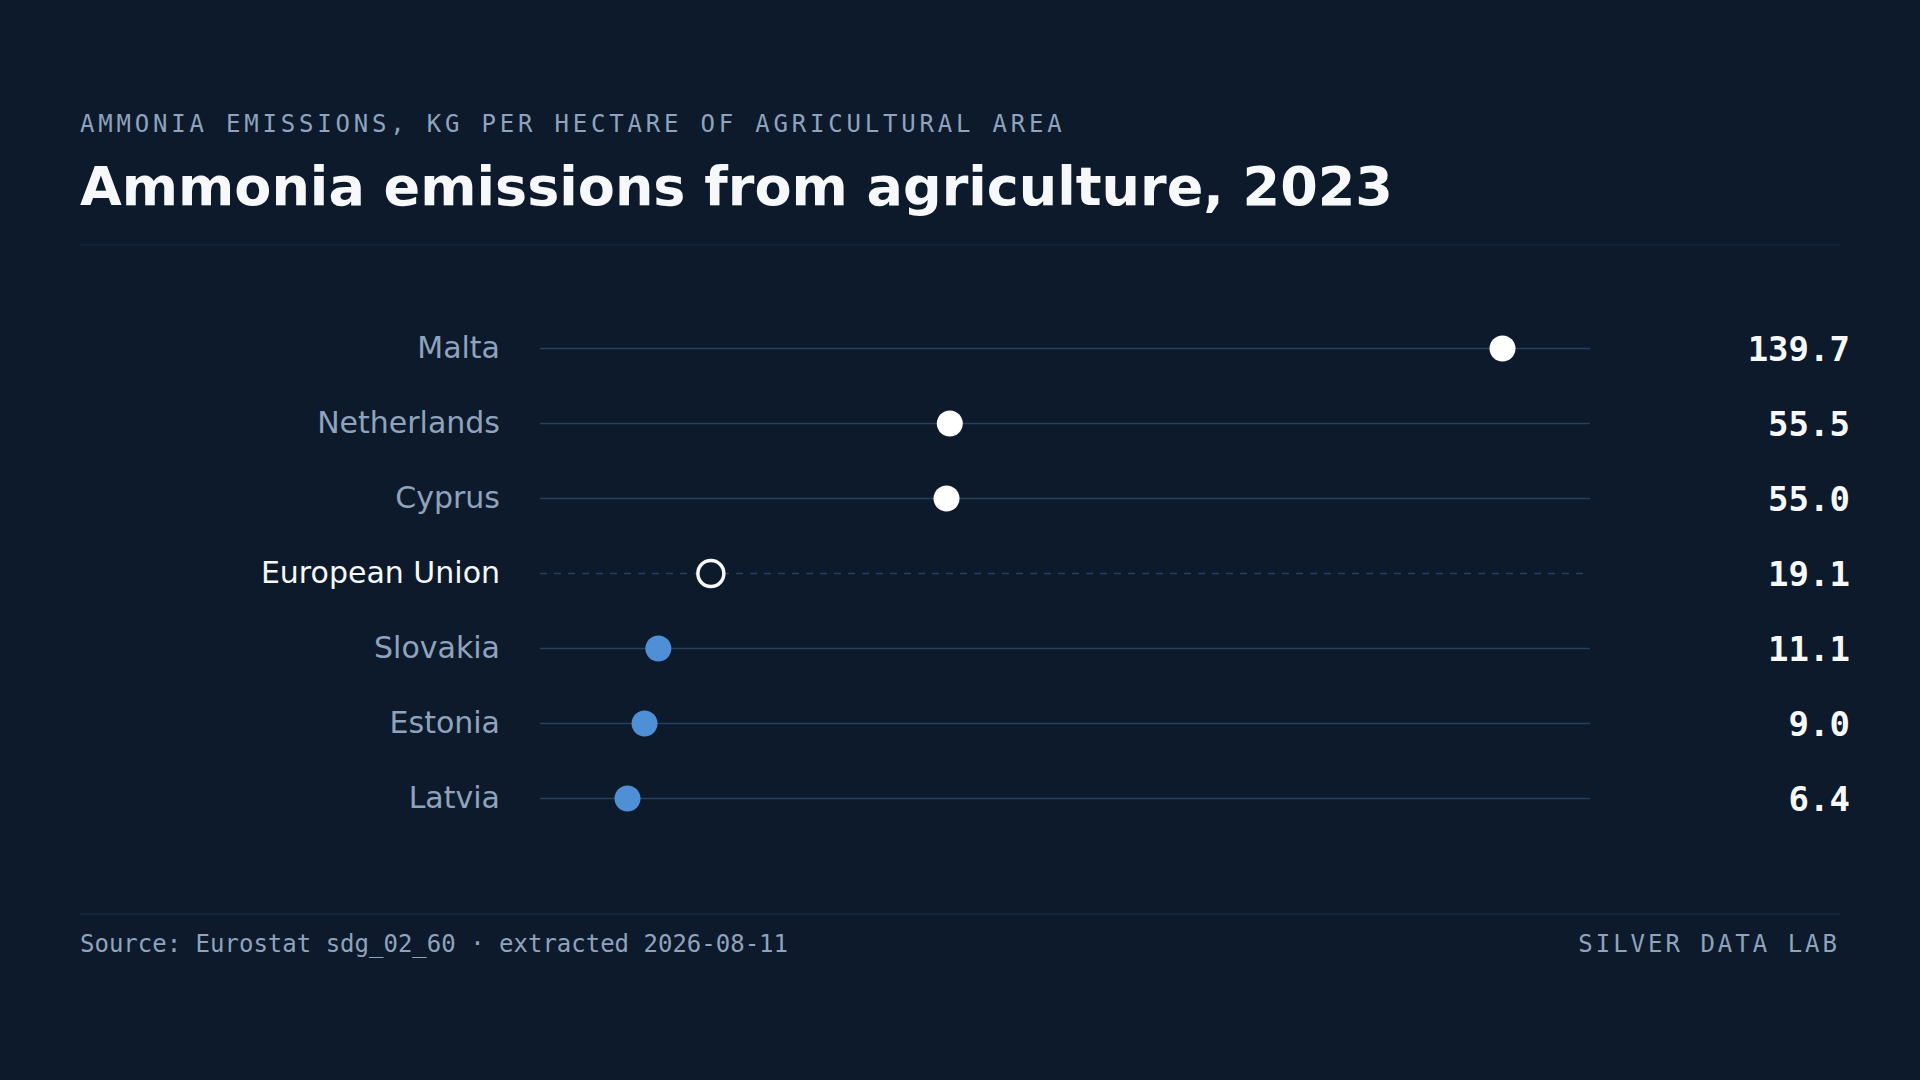
Dutch Farms Emit Nearly Three Times the EU Average of Ammonia per Hectare
EU agriculture emitted 19.2 kg of ammonia per hectare of agricultural area in 2023.
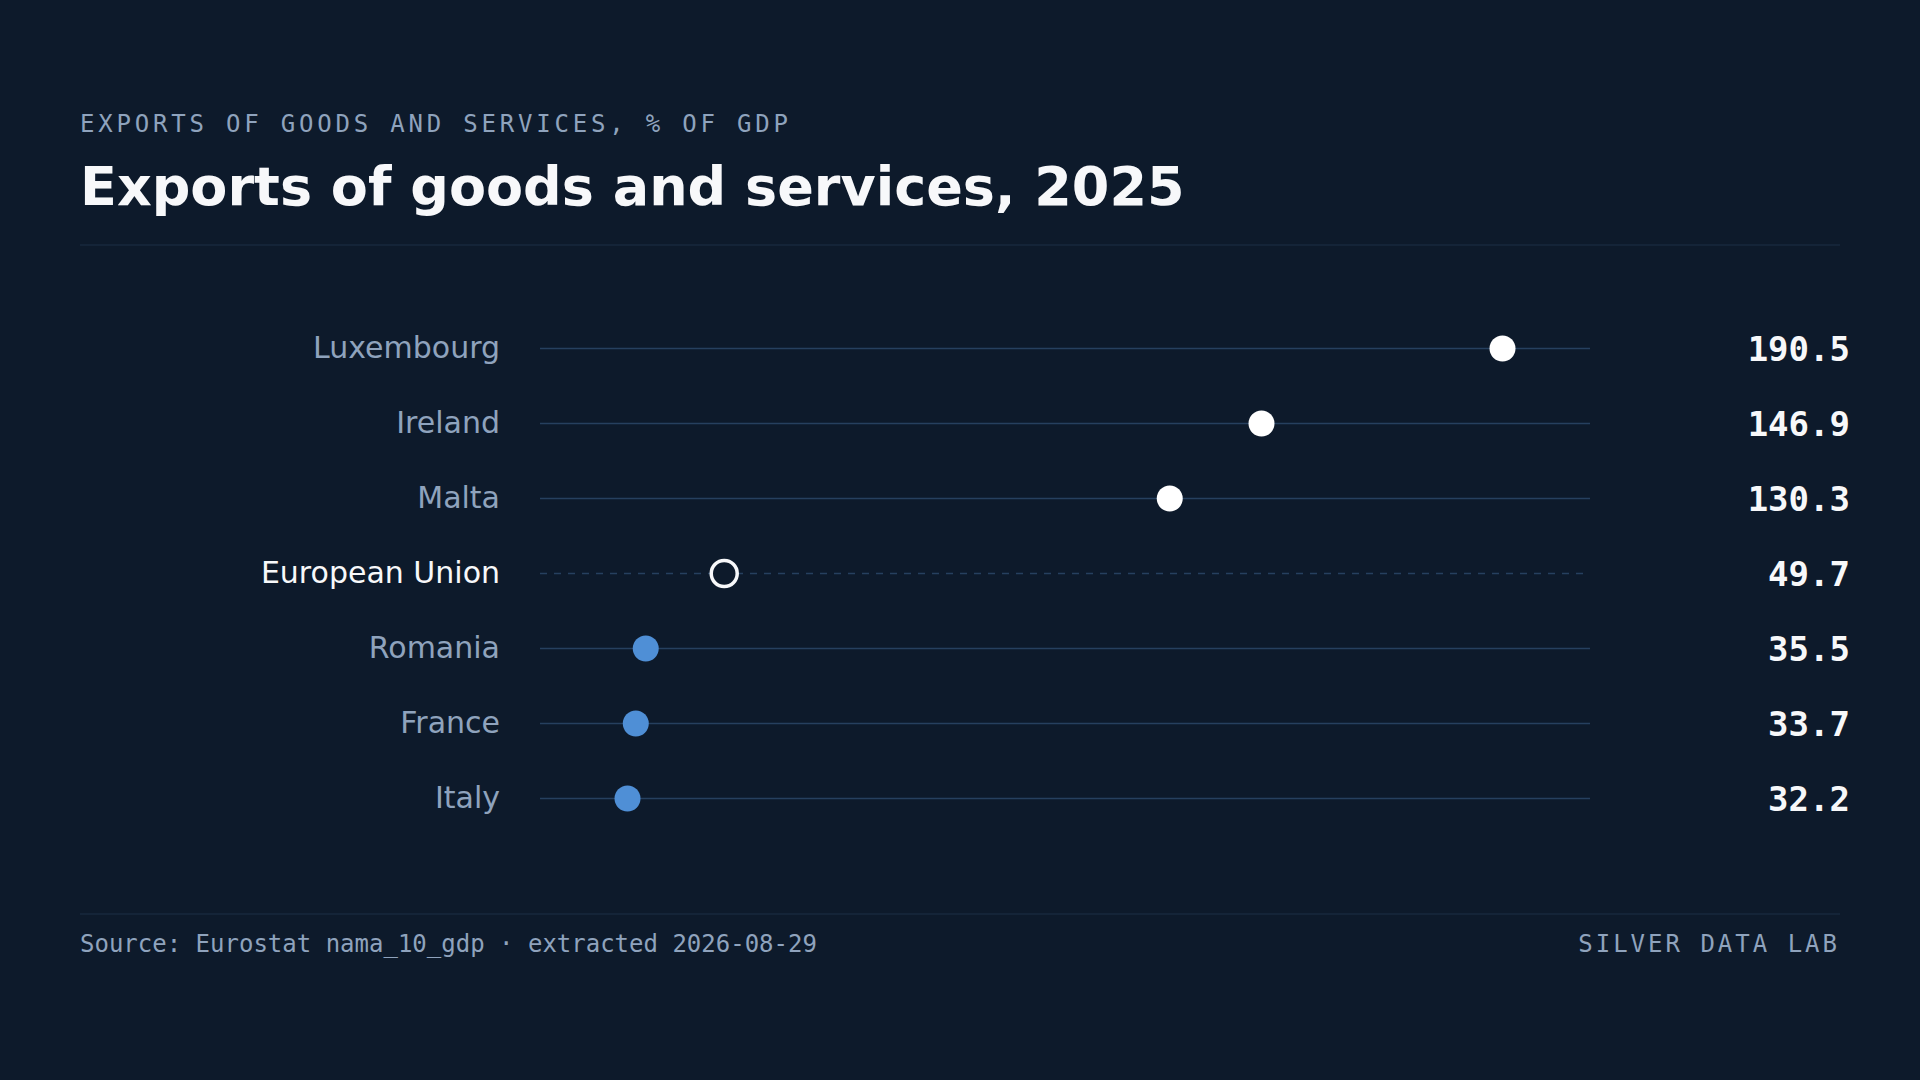
The EU's Four Biggest Economies Export Less Than Most Others for Their Size
Exports of goods and services from the 27 Member States equalled 49.6% of their combined GDP in 2025.