Dutch Farms Emit Nearly Three Times the EU Average of Ammonia per Hectare
Silver Data Lab Research Desk · Statistical analysis · Published on 23 July 2026
- Data source
- Eurostat
- Reference period
- 2023
- Last updated
- 11 October 2026
Re-checked against the source on 30 September 2026. 27 values in its datasets moved between snapshots, 7 of them figures stated on this page. Every revision we have observed →
Key estimates
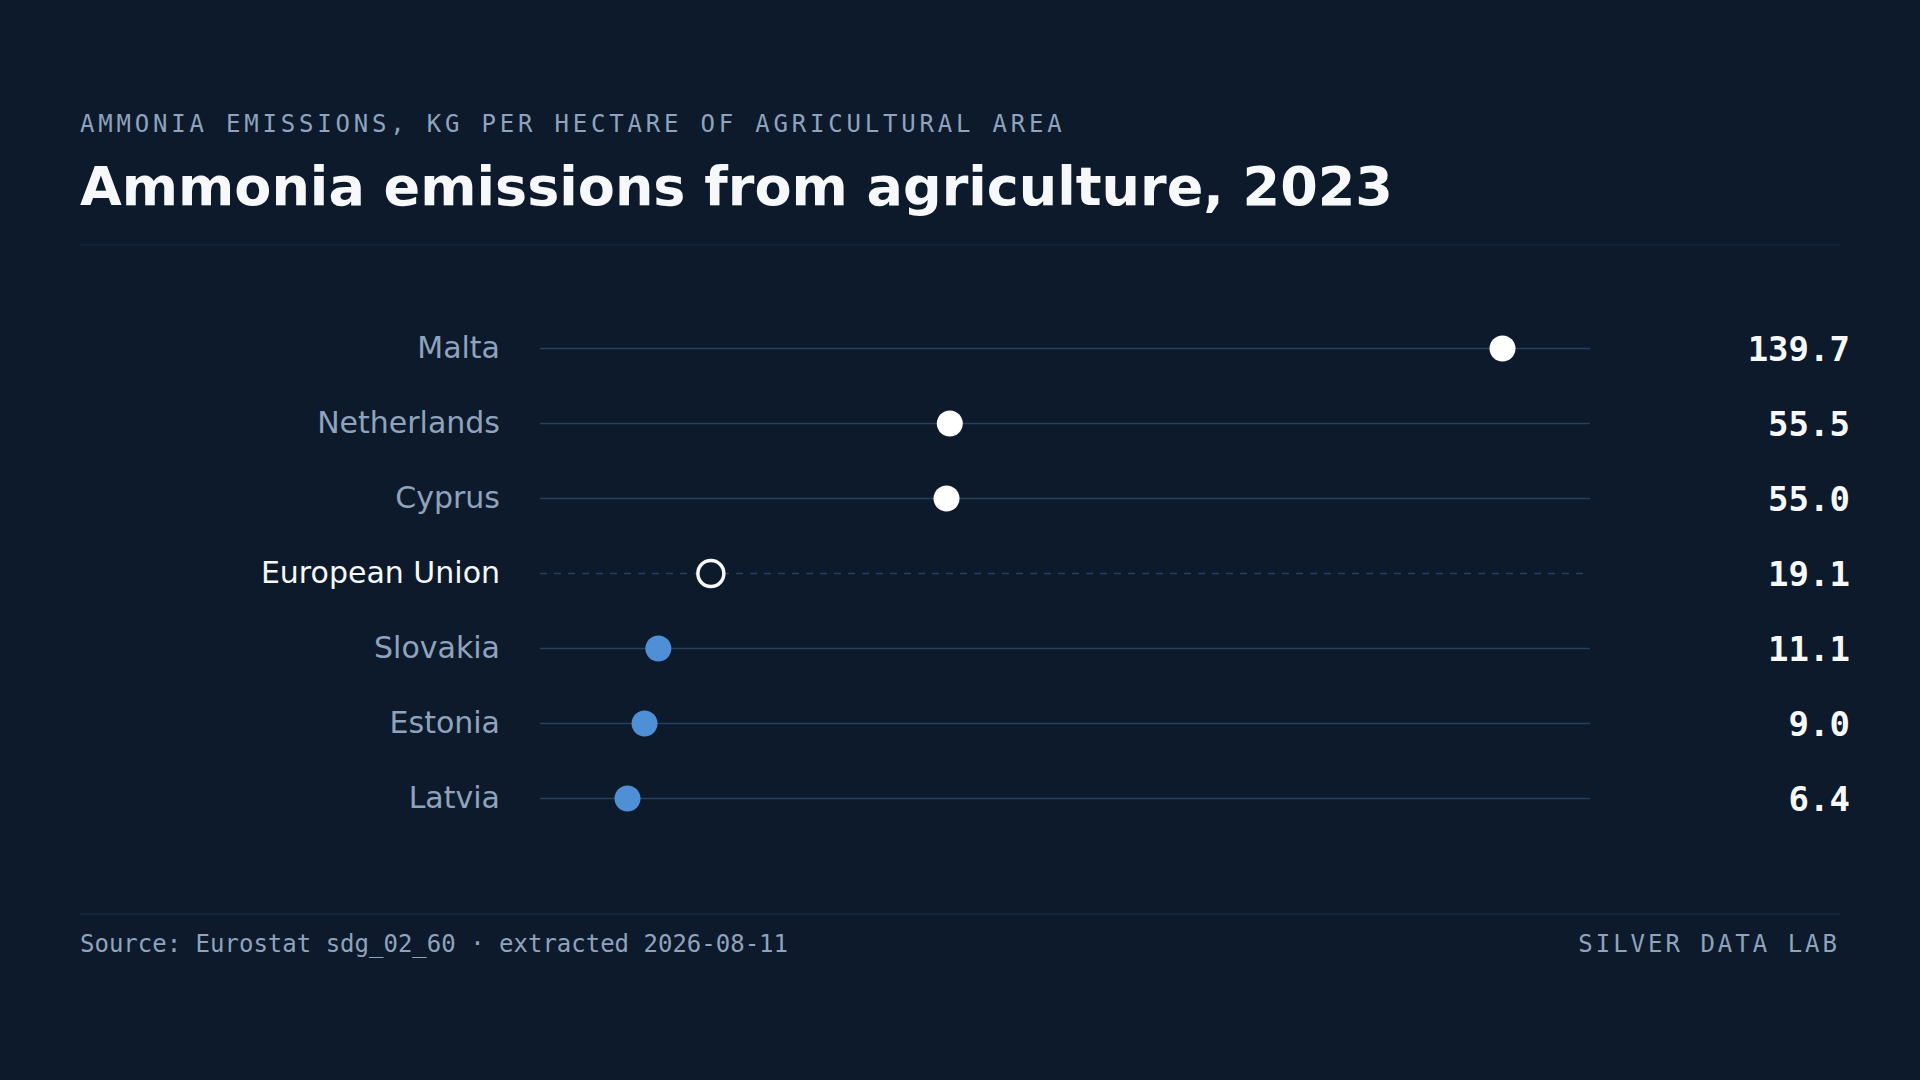
- EU agriculture emitted 19.2 kg of ammonia per hectare of agricultural area in 2023.
- Malta records 115.6 kg per hectare, six times the EU figure.
- Cyprus records 56.1 kg and the Netherlands 55.9 kg, both close to three times the EU level.
- Latvia records 6.3 kg, Estonia 8.9 kg, Bulgaria 9.7 kg and Lithuania 10.1 kg.
- Four Member States exceed 40 kg per hectare, and all four have intensive livestock sectors on small land areas.
A pollutant that comes almost entirely from farming
Ammonia is released when nitrogen in manure and fertiliser volatilises. Agriculture accounts for the overwhelming majority of it in the European Union, which makes this one of the few emissions series that is effectively a measure of one sector.
It matters because ammonia in the air forms fine particulates, which are the air pollutant most closely linked to mortality, and because deposited nitrogen damages sensitive habitats.
Measured per hectare of agricultural land, EU agriculture emitted 19.2 kg in 2023.
Intensity, not volume
Malta records 115.6 kg per hectare, six times the EU figure. Cyprus records 56.1 kg and the Netherlands 55.9 kg. Belgium follows at 43.2 kg.
The common factor is a large livestock population on a small agricultural area. Malta has very little farmland and a concentrated livestock sector; the Netherlands has the Union's most intensive agriculture, producing 7.3% of EU agricultural output on about a twelfth of France's land.
Expressing emissions per hectare is what makes that visible. The same indicator in tonnes ranks the countries with the most farmland first: France emits 547,220 tonnes, Spain 425,930 and Germany 422,610. Per hectare all three are unremarkable — France at 19.1 kg sits just below the EU figure and Spain at 17.1 kg below that.
Neither presentation is more correct. They answer different questions: absolute totals describe a country's contribution to the European burden, and per-hectare figures describe how hard each hectare is being worked.
The Dutch problem in one number
The Netherlands at 55.9 kg per hectare is the case with the most direct policy consequence. Dutch nitrogen deposition has been the subject of court rulings requiring reductions in livestock numbers, and this indicator is a reasonable proxy for what those rulings are about.
It also sits with what this site records about the Netherlands elsewhere — the Union's highest circular material use rate, at 32.7%, on top of that agricultural output. Intensity produces both, and the same efficiency that generates the output generates the emissions.
On this indicator, though, the Netherlands is third and not first. Malta at 115.6 kg and Cyprus at 56.1 kg are higher, and both are islands with very little farmland: Malta emits 1,181 tonnes in total against the Dutch 100,705. A per-hectare ranking puts a small livestock sector on a tiny area above a large one on a large area, which is worth knowing before reading the top of this table as a ranking of agricultural pressure.
The low end
Latvia records 6.3 kg per hectare, Estonia 8.9 kg, Bulgaria 9.7 kg and Lithuania 10.1 kg.
The Baltic states have extensive agriculture on large land areas with comparatively small livestock populations, which is the mirror image of the Dutch position; Bulgaria sits among them on the same measure. Their organic shares are also among the Union's highest — Estonia at 22.4% and Latvia at 14.8% in 2020 — and the two facts describe the same farming system from different angles.
What the indicator does not settle
A low figure per hectare can mean careful management or simply extensive farming on a lot of land. This series does not distinguish them, and the Baltic figures are consistent with both.
Nor does it capture where the ammonia ends up. Deposition depends on wind, terrain and the location of sensitive habitats, so the environmental damage from a kilogram emitted is not the same everywhere.
Ammonia emissions from agriculture, 2023
| Country | kg per hectare | Gap to EU averagederived |
|---|---|---|
| Malta | 115.6 | +96.4 |
| Cyprus | 56.1 | +36.9 |
| Netherlands | 55.9 | +36.7 |
| European Unionaggregate | 19.2 | — |
| Bulgaria | 9.7 | −9.5 |
| Estonia | 8.9 | −10.3 |
| Latvia | 6.3 | −12.9 |
This table as data: CSV · JSON
Every Member State for this indicator+
Members see every Member State for this indicator here, not only the rows the ranking prints. Become a Member
Embed this chart
Paste this code into a page. The frame carries the source and the extraction date, and links back to the study.
What these figures cannot tell you
- Per hectare, not per unit of output
- A farm producing twice as much food with the same emissions looks identical to one producing half as much. This measures emissions against land area, not against what the land produces.
- Extensive farming and good management look the same
- A low figure can reflect careful nutrient handling or simply a large area of low-intensity land. The indicator cannot separate them, which limits what a good result proves.
- Emission, not deposition
- Where ammonia settles depends on wind, terrain and the proximity of sensitive habitats. The environmental harm caused by a kilogram emitted varies considerably and is not measured here.
- Inventory estimates, not measurements
- National ammonia figures are modelled from livestock numbers, manure management practices and fertiliser use rather than measured directly, and methodologies differ between Member States.
Frequently asked questions
- How much ammonia does EU agriculture emit?
- 19.2 kg per hectare of agricultural area in 2023. Agriculture accounts for the overwhelming majority of ammonia emissions in the Union, so this is effectively a single-sector measure.
- Which EU country emits the most ammonia per hectare?
- Malta, at 115.6 kg per hectare in 2023, followed by Cyprus at 56.1 kg and the Netherlands at 55.9 kg. All three combine substantial livestock sectors with very small agricultural areas.
- Why does ammonia matter?
- It forms fine particulate matter in the atmosphere, the air pollutant most closely associated with mortality, and nitrogen deposited from it damages sensitive habitats. Dutch nitrogen deposition has been the subject of court rulings requiring livestock reductions.
- Which EU country emits the least?
- Latvia at 6.3 kg per hectare, followed by Estonia at 8.9 kg and Bulgaria at 9.7 kg. The Baltic states farm large areas at low intensity, which is the opposite of the Dutch pattern — though a low figure per hectare can reflect extensive land use rather than careful management.
Methodological note
Eurostat publishes ammonia emissions from agriculture in kilograms per hectare of utilised agricultural area, derived from national emission inventories reported under the air pollution framework.
Values are for 2023, the most recent year with complete coverage of the 27 Member States at the extraction date.
The same indicator is extracted a second time in tonnes, declared below, and is the source of every absolute figure here. The two are not interchangeable and are never mixed inside a ranking: one says how hard each hectare is worked, the other how much a country contributes to the European total.
The count of Member States above 40 kg per hectare and the ratios against the EU figure are derived by Silver Data Lab from the published values. The comparisons with organic area, agricultural output and circular material use draw on companion studies on this site, each with its own extraction.
Source data
This study draws on 2 datasets from Eurostat. Each can be inspected and re-downloaded from its catalogue, and the filters below are the ones applied.
Ammonia emissions from agriculture
sdg_02_60
- Filters applied:
- freq=A · unit=KG_HA · time=2023
- Extracted:
- 2026-09-30
- Source last updated:
- 2026-09-28
Ammonia emissions from agriculture — absolute volumes
sdg_02_60
- Filters applied:
- freq=A · unit=T · time=2023
- Extracted:
- 2026-09-30
- Source last updated:
- 2026-09-28
Download the data
The data the study you have just read is built on, exactly as it was downloaded and archived.
Yours as a Member.
Data downloadable by Members
How to cite
Record the vintage as well as the study: the figures on this page are the ones extracted on the dates below.
Silver Data Lab Research Desk (2026). Dutch Farms Emit Nearly Three Times the EU Average of Ammonia per Hectare. Silver Data Lab, published 23 July 2026, last updated 11 October 2026. https://www.silverdatalab.com/studies/ammonia-emissions-from-agriculture-in-the-eu
- Data: Eurostat, Ammonia emissions from agriculture (sdg_02_60), filters freq=A, unit=KG_HA, time=2023; extracted 2026-09-30; source last updated 2026-09-28. https://doi.org/10.2908/sdg_02_60
- Data: Eurostat, Ammonia emissions from agriculture — absolute volumes (sdg_02_60), filters freq=A, unit=T, time=2023; extracted 2026-09-30; source last updated 2026-09-28. https://doi.org/10.2908/sdg_02_60
Silver Data Lab's analysis is licensed CC BY 4.0. The statistics remain their publisher's and keep its terms of reuse.
Ask the research desk
A question about this study — a definition, a filter, a break in the series, what the figures can and cannot support — answered by the desk that made the extraction.
Members can write to the research desk
Studies where the same country leads or trails
Air Travel in the EU Is Back Above Its Pre-Pandemic Level
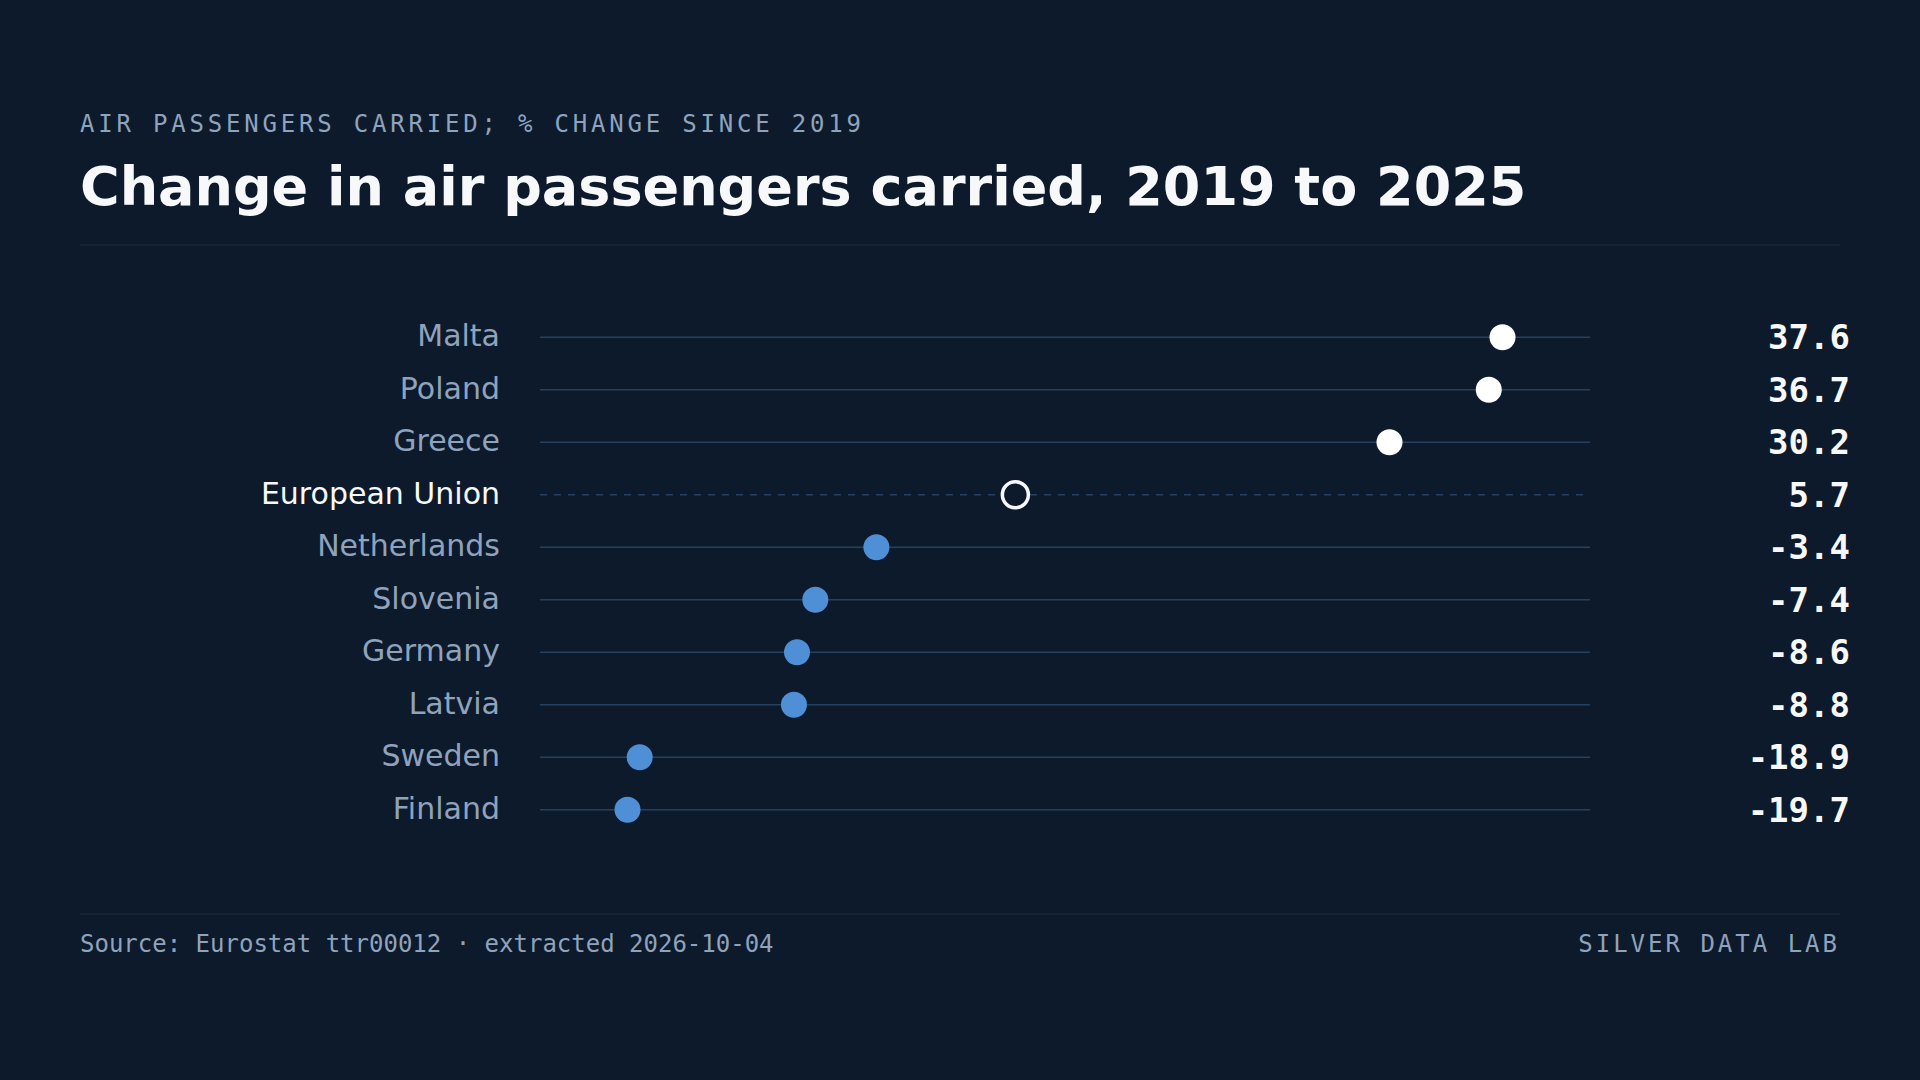
Air passengers carried in the EU reached 1,093.6 million in 2025, 5.7% more than in 2019; the total first passed its 2019 level in 2024, by 0.7%.
Employment Rates Vary Far More Between EU Regions Than Between Countries
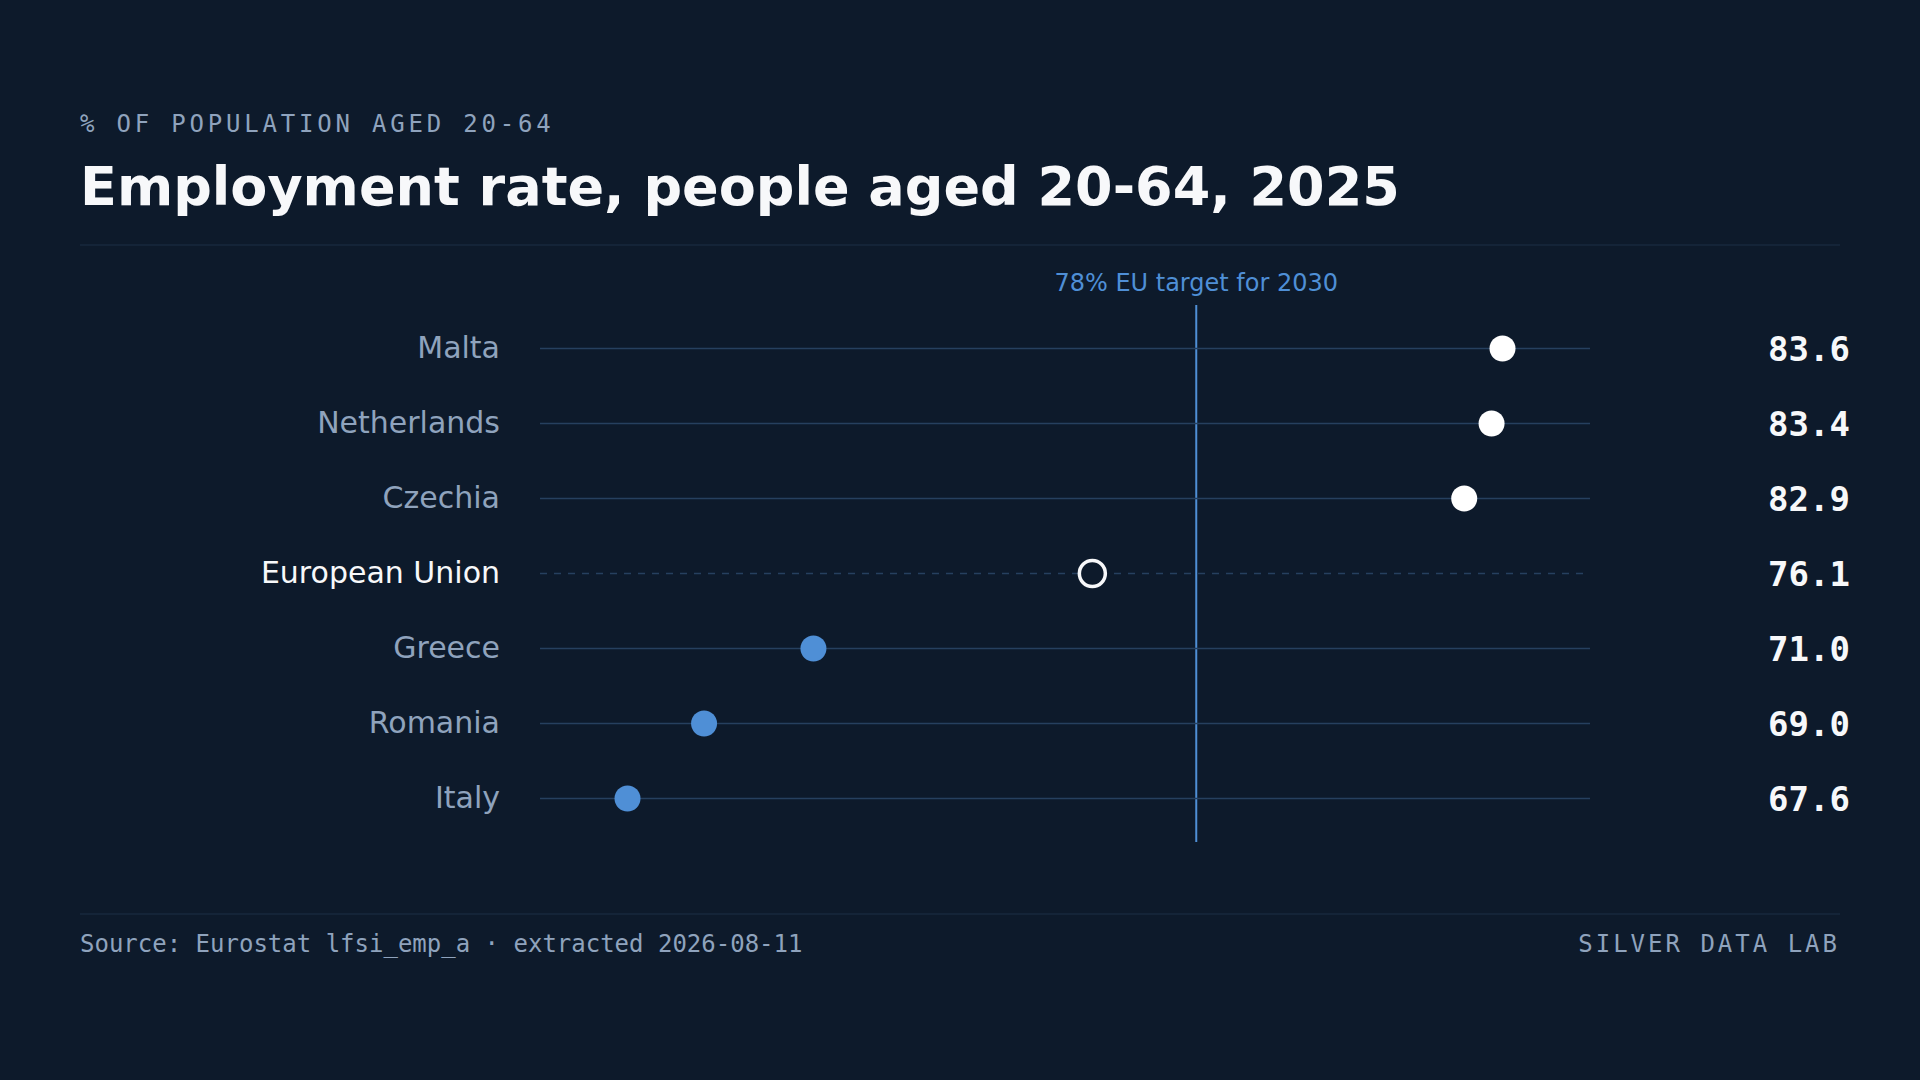
76.1% of people aged 20 to 64 were in employment across the EU in 2025, or 197.8 million people — the highest reading since the series began in 2009.
Germany Buys More Services From Abroad Than It Sells
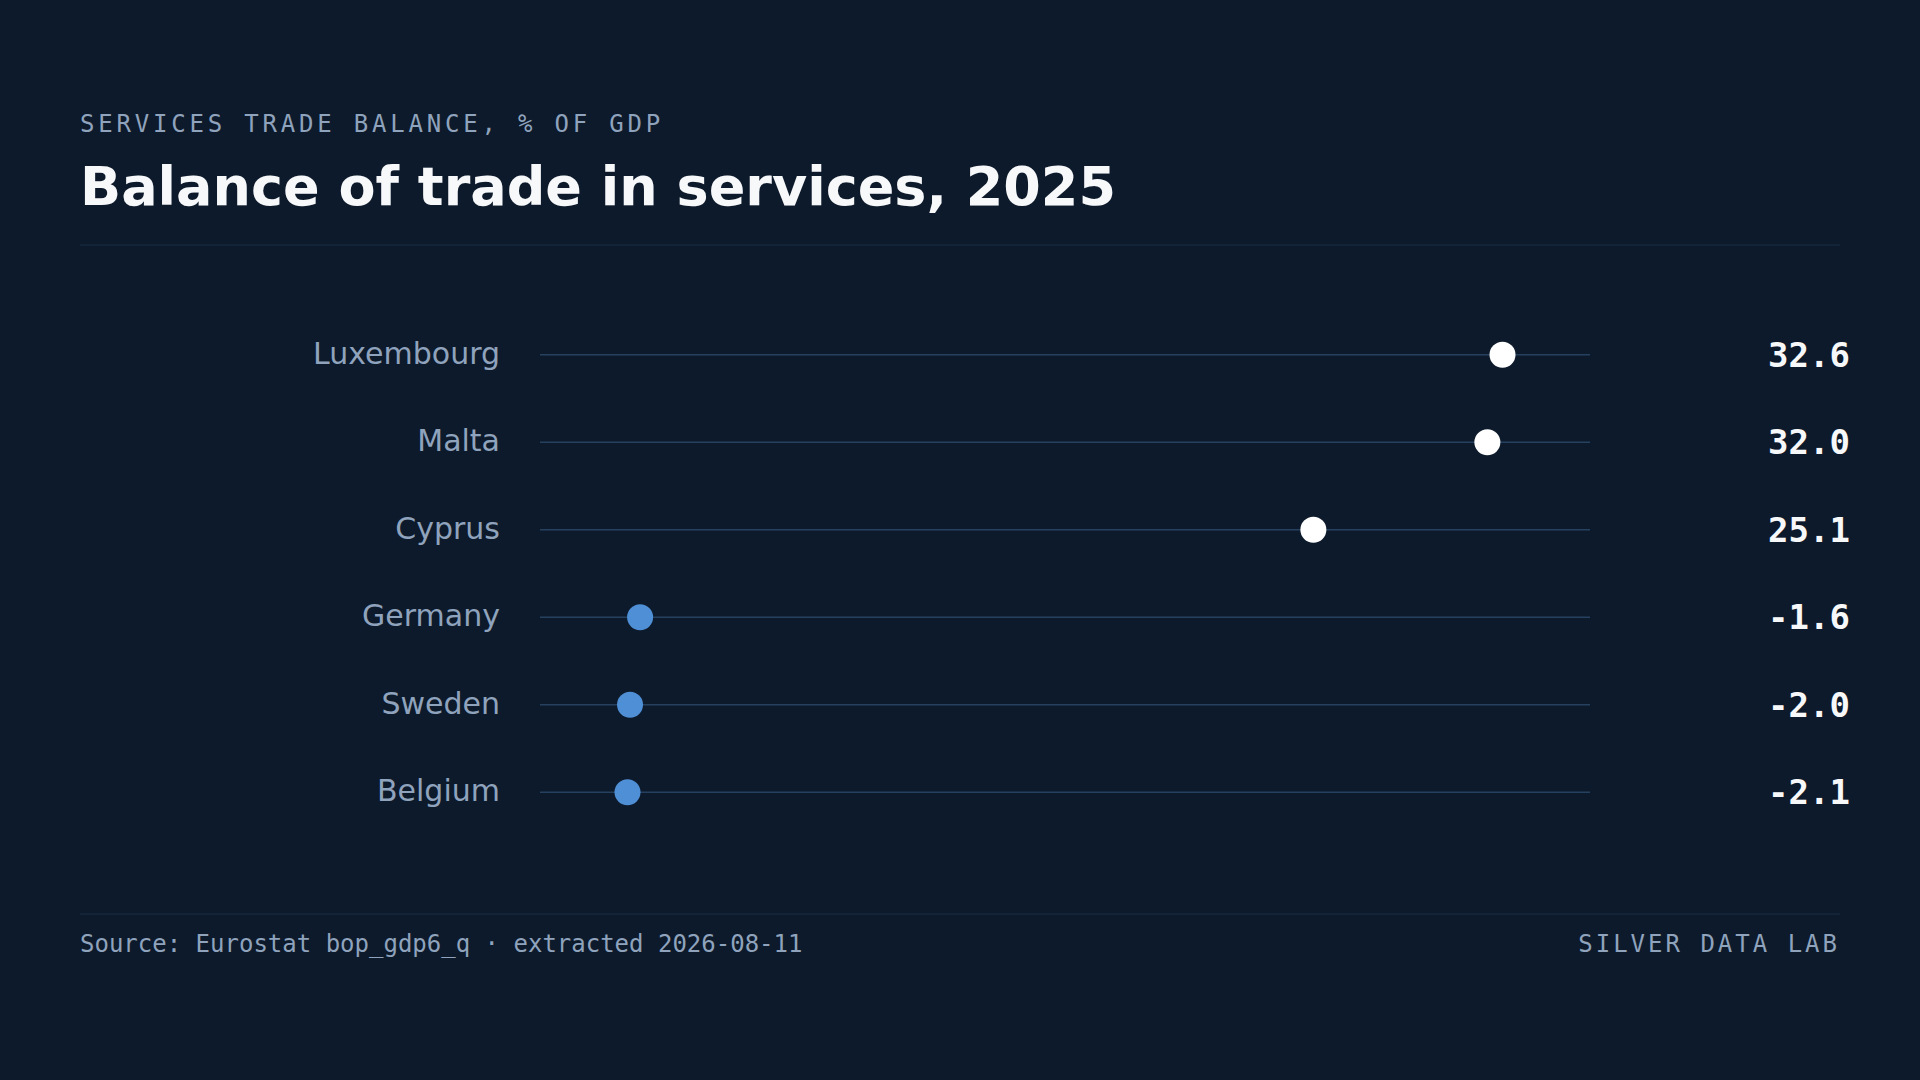
Malta records a services trade surplus worth 33.2% of GDP, Luxembourg 30.3% and Cyprus 27.4%.