Air Travel in the EU Is Back Above Its Pre-Pandemic Level
Silver Data Lab Research Desk · Statistical analysis · Published on 04 October 2026
- Data source
- Eurostat
- Reference period
- 2025
- Last updated
- 11 October 2026
Re-checked against the source on 22 October 2026. 2 values in its datasets moved between snapshots, 1 of them figures stated on this page. Every revision we have observed →
Key estimates
- Air passengers carried in the EU reached 1,093.6 million in 2025, 5.7% more than in 2019; the total first passed its 2019 level in 2024, by 0.7%.
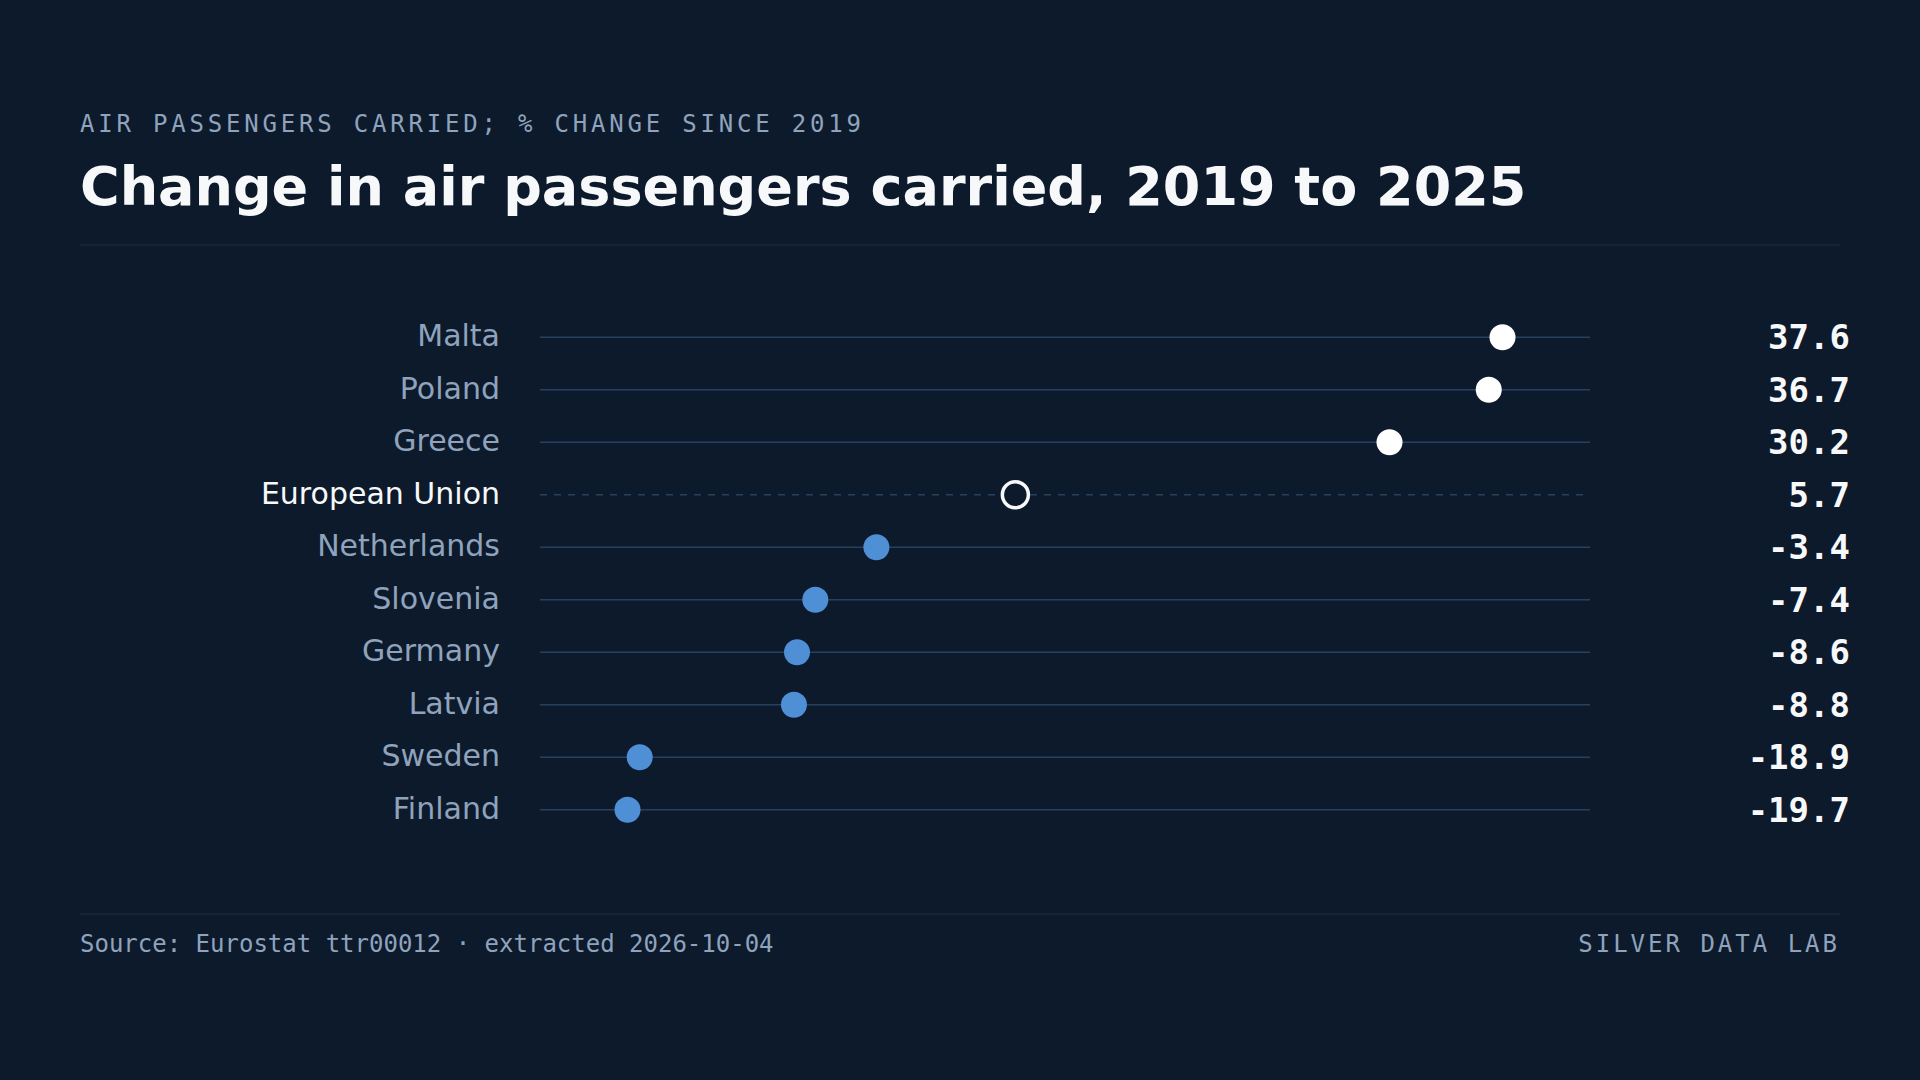
- Malta carried 37.6% more air passengers than in 2019, Poland 36.7% more and Greece 30.2% more, the three largest increases among the 27 Member States.
- Six Member States are still below 2019: Finland by 19.7%, Sweden by 18.9%, Latvia by 8.8%, Germany by 8.6%, Slovenia by 7.4% and the Netherlands by 3.4%.
- Spain is the largest air market in the EU, with 272.1 million passengers in 2025, ahead of Germany at 207.2 million, Italy at 193.3 million and France at 172.0 million.
- In 2020 the EU total fell to 276.7 million passengers, 73.3% below 2019.
Passengers on flights, not people
Eurostat counts air passengers airport by airport. Every passenger whose flight starts or ends at a reporting airport is recorded, including those who change planes there, and Eurostat builds a total for each country from the airports' declarations. The unit is a passenger on a flight rather than a traveller: someone who flies out and back is counted twice, and someone who connects through a hub airport is counted once on arrival and again on departure.
A flight between two Member States therefore appears in the figures of both. Eurostat removes that overlap when it builds the EU total, which is why the 27 national figures for 2025 add up to 1,470.3 million passengers while the EU total is 1,093.6 million, about a quarter less. National counts overlap, and they differ in size by a factor of more than a hundred, from Spain's 272.1 million to Slovenia's 1.6 million. So this study compares each country with itself: the passengers carried in 2025 against those carried in 2019, the last year before the pandemic.
The EU total passed its 2019 level in 2024
Across the EU, 1,035.1 million passengers were carried in 2019, after growth of 32.5% in the five years from 2014. In 2020 the total fell to 276.7 million, 73.3% below that level. The climb back was slow: 374.8 million in 2021, 816.7 million in 2022 and 964.2 million in 2023, still 6.9% short. In 2024 the total reached 1,042.3 million and passed 2019 by 0.7%.
In 2025 the EU carried 1,093.6 million passengers, 4.9% more than in 2024 and 5.7% more than in 2019, the highest figure in a series that starts in 2014. For six years that is a modest gain: the five years before 2019 had added close to a third.
Twenty-one Member States up, six down
Beneath the total, 21 Member States carried more air passengers in 2025 than in 2019 and six carried fewer. The distance between the two ends is wide: from 37.6% more in Malta to 19.7% fewer in Finland.
Malta's count rose from 7.3 million to 10.1 million, Poland's from 46.9 million to 64.2 million and Greece's from 56.1 million to 73.0 million, increases of 37.6%, 36.7% and 30.2%. Croatia follows at 26.7%, Portugal at 22.1%, Cyprus at 21.9%, Luxembourg and Romania at 21.4%, Italy at 20.3%, Spain at 19.2% and Hungary at 18.3%.
Two groups stand out among the gainers. One is southern Europe: Malta, Greece, Croatia, Portugal, Cyprus, Italy and Spain all carry at least 19% more passengers than in 2019. The other is central and eastern Europe, where Poland, Romania and Hungary are all more than 18% up and Slovakia is up 14.0%. Neither group is uniform. Slovenia, on the Adriatic like Croatia, is 7.4% below its 2019 level, and Czechia and Bulgaria are only 2.2% and 2.6% above theirs.
Six Member States still below 2019
Finland carried 18.7 million air passengers in 2025, against 23.3 million in 2019, a fall of 19.7%. Sweden carried 30.5 million against 37.6 million, a fall of 18.9%. Latvia is 8.8% below its 2019 count, Germany 8.6%, Slovenia 7.4% and the Netherlands 3.4%.
Germany has the largest shortfall in absolute terms: 207.2 million passengers in 2025 against 226.8 million in 2019, 19.5 million fewer, which is more than the shortfalls of the other five added together.
The Swedish decline did not begin with the pandemic. Sweden's count peaked at 38.9 million in 2018 and had already fallen to 37.6 million in 2019; Bulgaria and Slovenia are the only other Member States that carried fewer passengers in 2019 than in 2018. Finland's path differs in another way: it is the one Member State that carried fewer passengers in 2021 than in 2020, 4.6 million against 5.4 million.
Around the Baltic the picture is mixed. Latvia, 8.8% short of 2019, is also the only Member State whose count fell between 2024 and 2025, by 1,707 passengers; Estonia's rose that year by just 157, although it stands 6.6% above its 2019 level. Lithuania is 9.6% above 2019 and Denmark 4.5%.
The table records these differences without explaining them. It does not separate residents from visitors, short trips from long ones, or travellers who begin their journey in a country from those who only change planes there.
Spain ahead of Germany, Italy ahead of France
Spain is the largest air market in the EU, with 272.1 million passengers in 2025, followed by Germany with 207.2 million, Italy with 193.3 million and France with 172.0 million. These four are the only Member States above 100 million; the Netherlands is fifth with 78.4 million.
Germany carried more passengers than Spain in every year of the series up to 2017. Spain has been ahead in every year since 2018, by a margin that shrank to 1,327 passengers in 2020 and widened to 64.9 million in 2025. Italy trailed France until 2022 and has been ahead of it since 2023, and the distance between Italy and Germany has narrowed from 66.1 million passengers in 2019 to 14.0 million in 2025.
In absolute terms Spain added 43.9 million passengers between 2019 and 2025 and Italy 32.6 million, the two largest increases in the Union; Poland and Greece follow with 17.2 million and 16.9 million.
What the count leaves out
The annual table publishes one total per country. Domestic flights, flights to other Member States and flights leaving the EU are not shown separately, so a rise in long-haul tourism and a rise in short domestic hops look the same here. The smallest airports need not report at all: below 15,000 passenger units a year, a measure that adds an airport's freight and mail to its passengers, there is no obligation to send figures, and Eurostat's metadata notes that only some countries report such airports anyway.
Change in air passengers carried, 2019 to 2025
| Country | % change from 2019 (derived) | Gap to EU totalpercentage points, derived |
|---|---|---|
| Malta | 37.6 | +31.9 |
| Poland | 36.7 | +31.0 |
| Greece | 30.2 | +24.5 |
| European Unionaggregate | 5.7 | — |
| Netherlands | -3.4 | −9.1 |
| Slovenia | -7.4 | −13.1 |
| Germany | -8.6 | −14.3 |
| Latvia | -8.8 | −14.5 |
| Sweden | -18.9 | −24.6 |
| Finland | -19.7 | −25.4 |
This table as data: CSV · JSON
Every Member State for this indicator+
Members see every Member State for this indicator here, not only the rows the ranking prints. Become a Member
Embed this chart
Paste this code into a page. The frame carries the source and the extraction date, and links back to the study.
Air passengers carried, 2025
| Country | passengers carried |
|---|---|
| Spain | 272,121,512 |
| Germany | 207,239,776 |
| Italy | 193,278,859 |
| France | 171,964,002 |
This table as data: CSV · JSON
Every Member State for this indicator+
Members see every Member State for this indicator here, not only the rows the ranking prints. Become a Member
Embed this chart
Paste this code into a page. The frame carries the source and the extraction date, and links back to the study.
What these figures cannot tell you
- A passenger is counted on every flight
- Eurostat's passengers carried are passengers on flights, not people. A return trip counts twice, and a passenger who changes planes is counted at the transfer airport both on arrival and on departure, so a country with a large connecting hub records its transfer traffic twice. A change in connecting traffic moves that country's figure without anyone starting or ending a journey there.
- National figures overlap; the EU total does not
- A flight between two Member States is counted in both. For the EU total Eurostat keeps only the departure declaration on routes that both airports report, so the 27 national figures for 2025 add up to 1,470.3 million against an EU total of 1,093.6 million. National counts cannot be added together, and a country's share of the EU total cannot be read off this table.
- Breaks when airports enter or leave the count
- The legal reporting obligation applies to airports above 15,000 passenger units a year. Eurostat's metadata lists three causes of breaks in the series: an airport closed temporarily, an airport that falls below the threshold and drops out, and one that crosses it and starts reporting. Eurostat documents each break country by country in the notes attached to its metadata, and the figures here are not adjusted for them.
- No split by type of flight
- This annual table carries the total only. Domestic, intra-EU and extra-EU traffic are not separated, and neither are residents and visitors. Eurostat's monthly companion table splits traffic by type of transport but covers recent months only, so it cannot be set against 2019; the detailed dataset this table is drawn from, avia_paoc, carries that split for earlier years too and is not used here.
Frequently asked questions
- How many air passengers are there in the EU each year?
- Eurostat counted 1,093.6 million air passengers carried in the EU in 2025. The figure counts passengers per flight rather than people, so a return trip counts twice, and a flight between two Member States is counted once in the EU total.
- Has EU air travel recovered from the pandemic?
- In total, yes. The EU carried 1,035.1 million passengers in 2019 and 276.7 million in 2020. It passed the 2019 level in 2024, at 1,042.3 million, and reached 1,093.6 million in 2025, 5.7% above 2019. Six Member States had still not returned to their 2019 count in 2025.
- Which EU countries have fewer air passengers than before the pandemic?
- Finland, 19.7% below its 2019 count in 2025, Sweden 18.9% below, Latvia 8.8%, Germany 8.6%, Slovenia 7.4% and the Netherlands 3.4%. In absolute terms Germany is furthest behind, with 19.5 million passengers fewer than in 2019.
- Which EU country has the most air passengers?
- Spain, with 272.1 million passengers carried in 2025, followed by Germany with 207.2 million, Italy with 193.3 million and France with 172.0 million. Spain has been ahead of Germany every year since 2018, and Italy ahead of France since 2023.
Methodological note
The measure is the number of air passengers carried, by reporting country, in Eurostat's annual table compiled from the declarations of airports under Regulation (EC) No 437/2003. A passenger is recorded for each flight that begins or ends at a reporting airport, transfer passengers included and direct transit passengers on the same aircraft excluded. The EU total is Eurostat's own aggregate, from which the double counting of flights between two reporting airports has been removed.
Values cover 2014 to 2025 for all 27 Member States and the EU aggregate; no value used here carries a Eurostat flag. Passenger numbers are quoted in the text in millions rounded to one decimal, except differences of under a million, which are given exactly; the second ranking carries the exact published counts.
Silver Data Lab derived the percentage changes between years, each one computed from two published counts for the same geography; the differences in passengers between years and between countries; the sum of the 27 national figures for 2025 and its comparison with the EU total; the factor between the largest and smallest national counts; and the counts of Member States above or below their 2019 level. Nothing else is computed.
Source data
The underlying series can be inspected and re-downloaded from the Eurostat data browser. The filters below are the ones applied.
Air transport of passengers by country (yearly data)
ttr00012
- Filters applied:
- freq=A · unit=PAS · tra_meas=PAS_CRD · tra_cov=TOTAL · schedule=TOTAL
- Extracted:
- 2026-10-22
- Source last updated:
- 2026-10-21
Download the data
The data the study you have just read is built on, exactly as it was downloaded and archived.
Yours as a Member.
Data downloadable by Members
How to cite
Record the vintage as well as the study: the figures on this page are the ones extracted on the dates below.
Silver Data Lab Research Desk (2026). Air Travel in the EU Is Back Above Its Pre-Pandemic Level. Silver Data Lab, published 04 October 2026, last updated 11 October 2026. https://www.silverdatalab.com/studies/air-passengers-in-the-eu
- Data: Eurostat, Air transport of passengers by country (yearly data) (ttr00012), filters freq=A, unit=PAS, tra_meas=PAS_CRD, tra_cov=TOTAL, schedule=TOTAL; extracted 2026-10-22; source last updated 2026-10-21. https://doi.org/10.2908/ttr00012
Silver Data Lab's analysis is licensed CC BY 4.0. The statistics remain their publisher's and keep its terms of reuse.
Ask the research desk
A question about this study — a definition, a filter, a break in the series, what the figures can and cannot support — answered by the desk that made the extraction.
Members can write to the research desk
Studies where the same country leads or trails
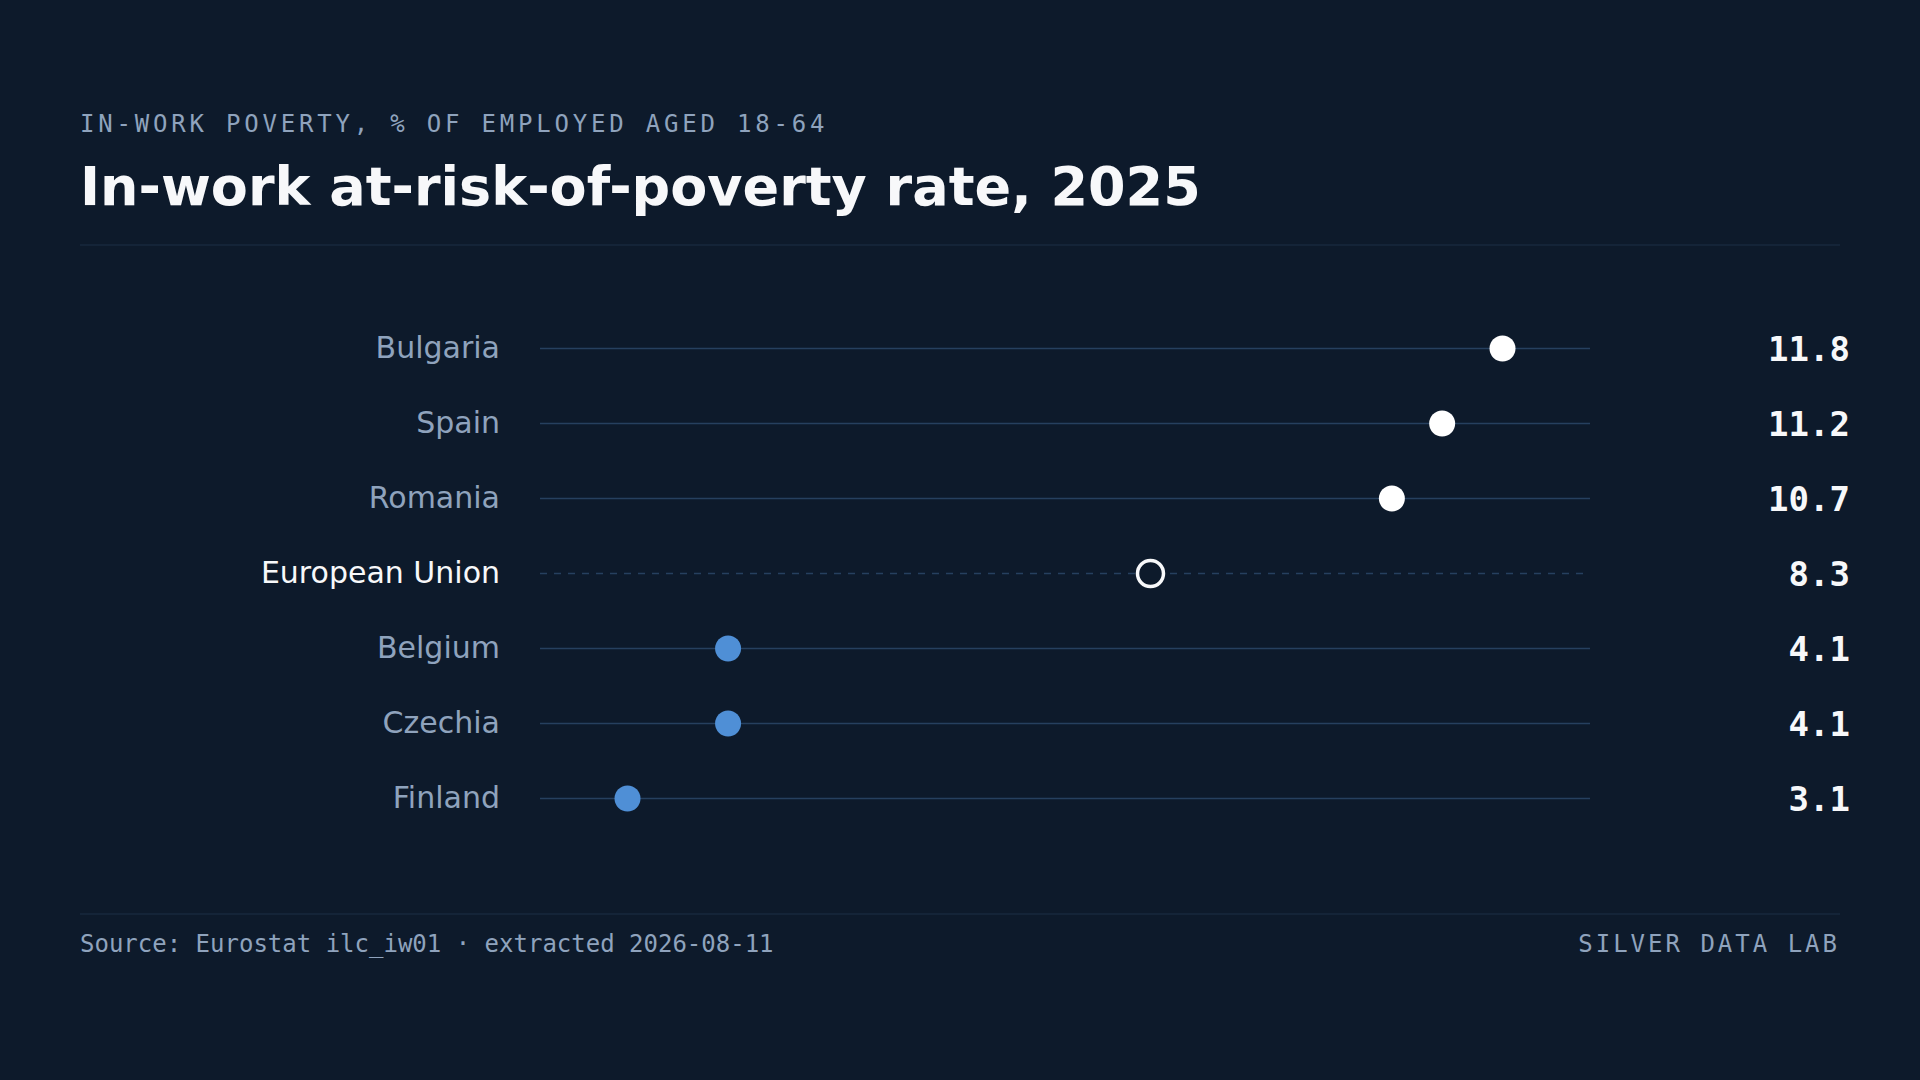
11.8% of Bulgarians With a Job Are Poor, the Highest Share in the EU
8.3% of employed people aged 18 to 64 in the EU lived below the at-risk-of-poverty line in 2025.
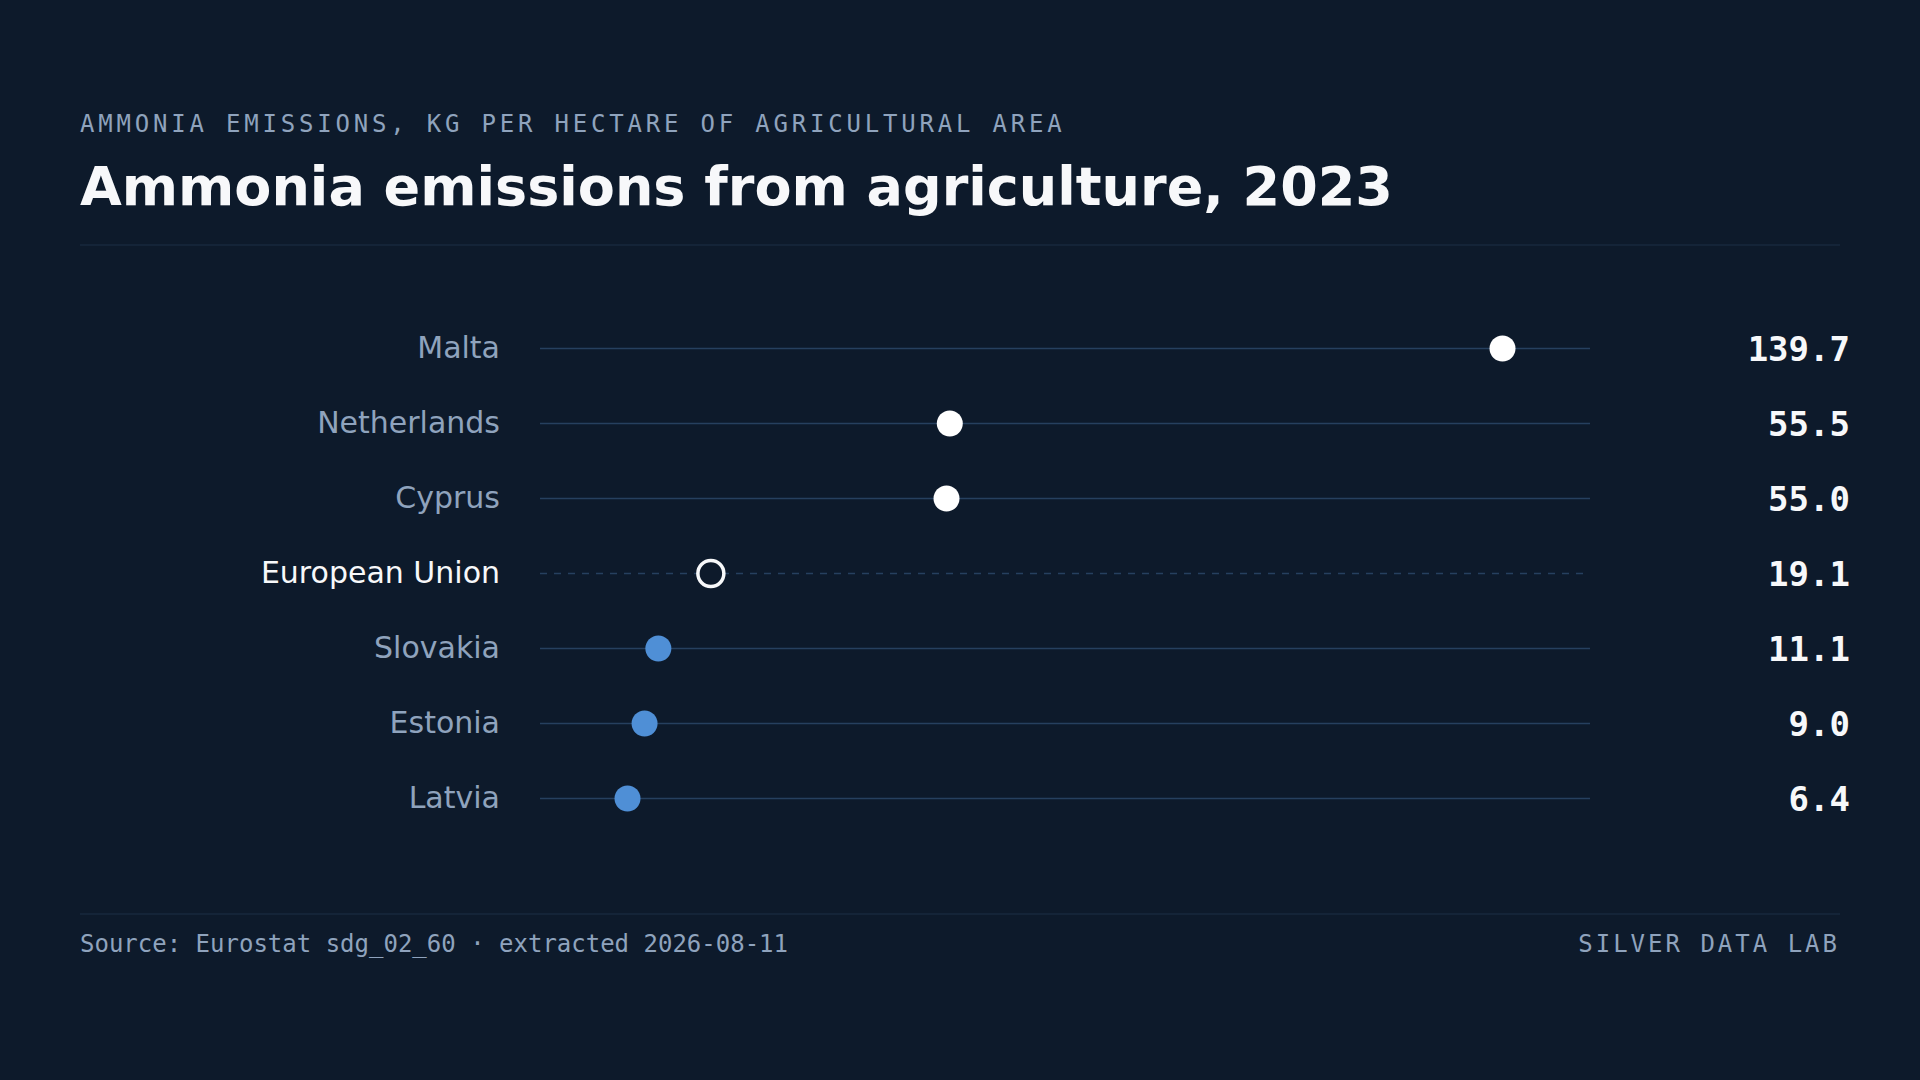
Dutch Farms Emit Nearly Three Times the EU Average of Ammonia per Hectare
EU agriculture emitted 19.2 kg of ammonia per hectare of agricultural area in 2023.
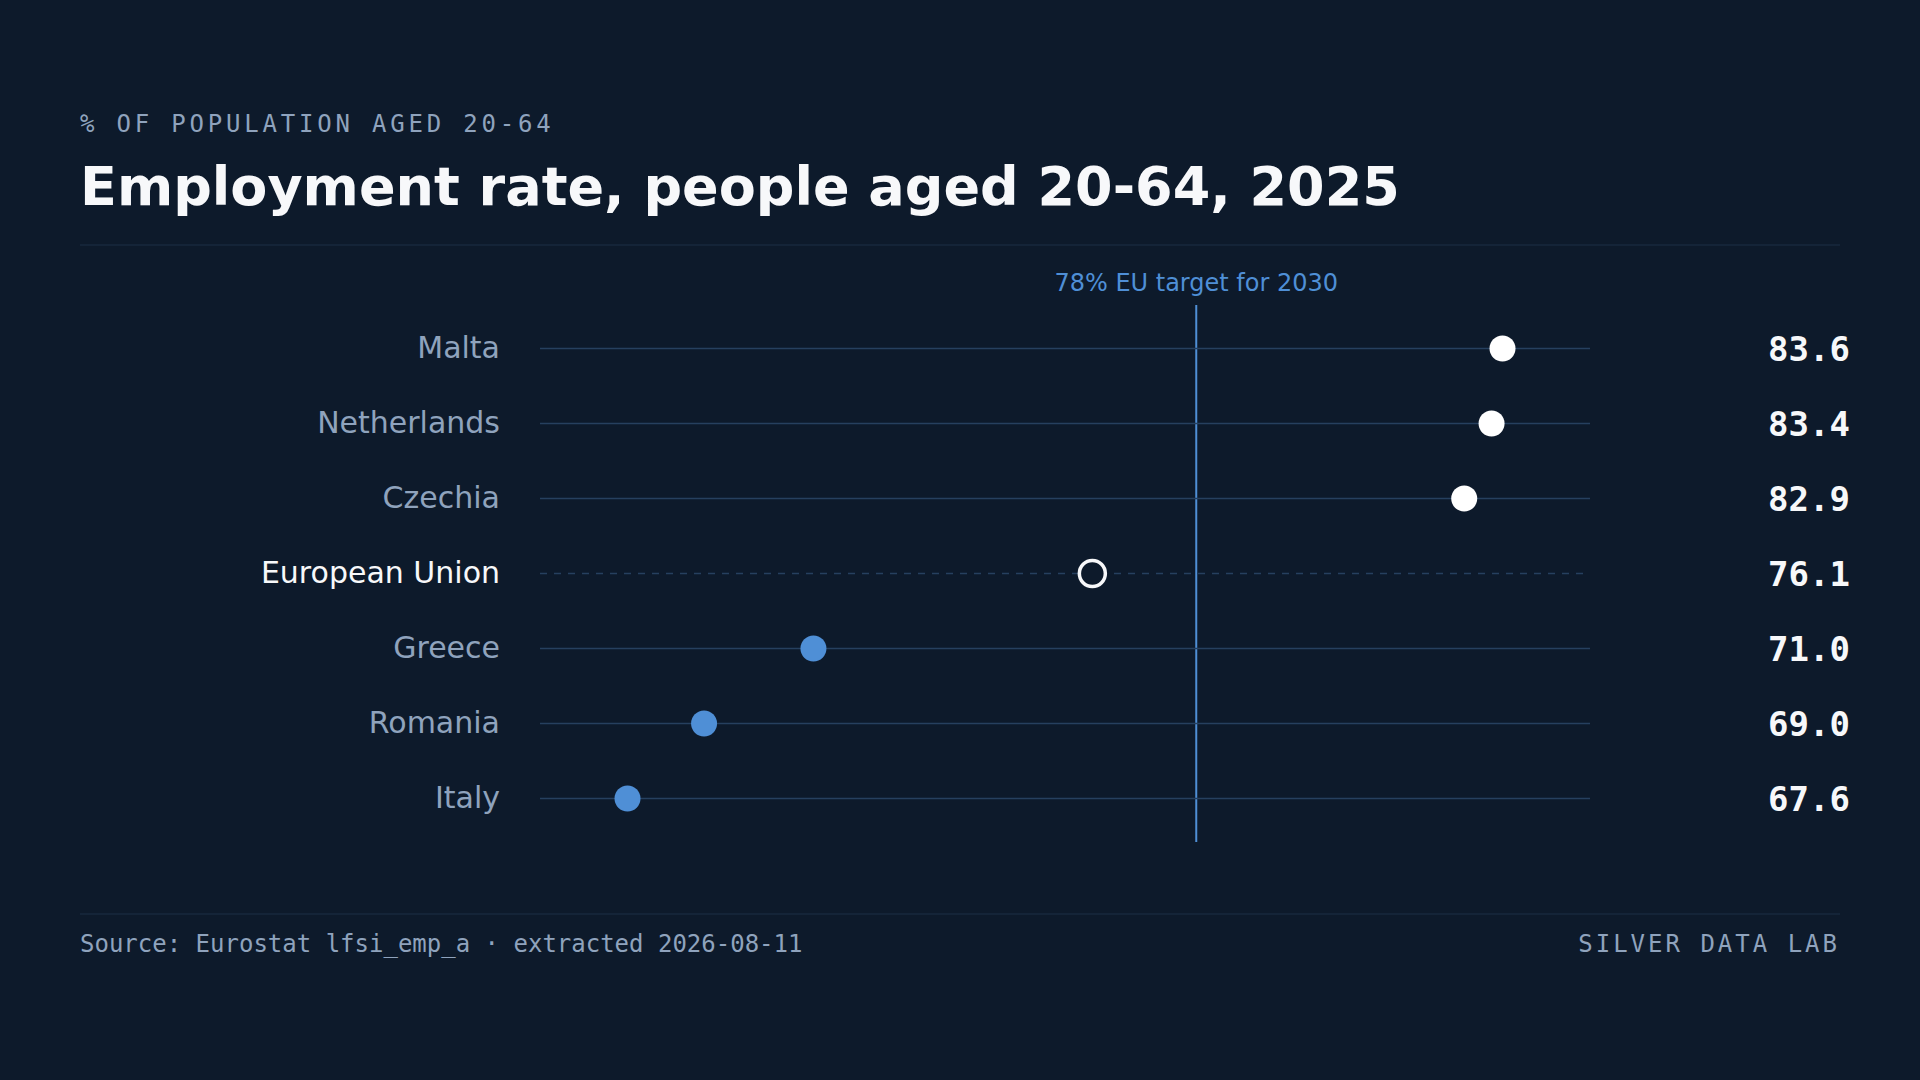
Employment Rates Vary Far More Between EU Regions Than Between Countries
76.1% of people aged 20 to 64 were in employment across the EU in 2025, or 197.8 million people — the highest reading since the series began in 2009.