More Than One Dutch Employee in Five Is on a Temporary Contract
Silver Data Lab Research Desk · Statistical analysis · Published on 14 June 2026
- Data source
- Eurostat
- Reference period
- 2025
- Last updated
- 11 October 2026
Re-checked against the source on 10 October 2026. No value in its datasets has moved between the snapshots we hold. Every revision we have observed →
Key estimates
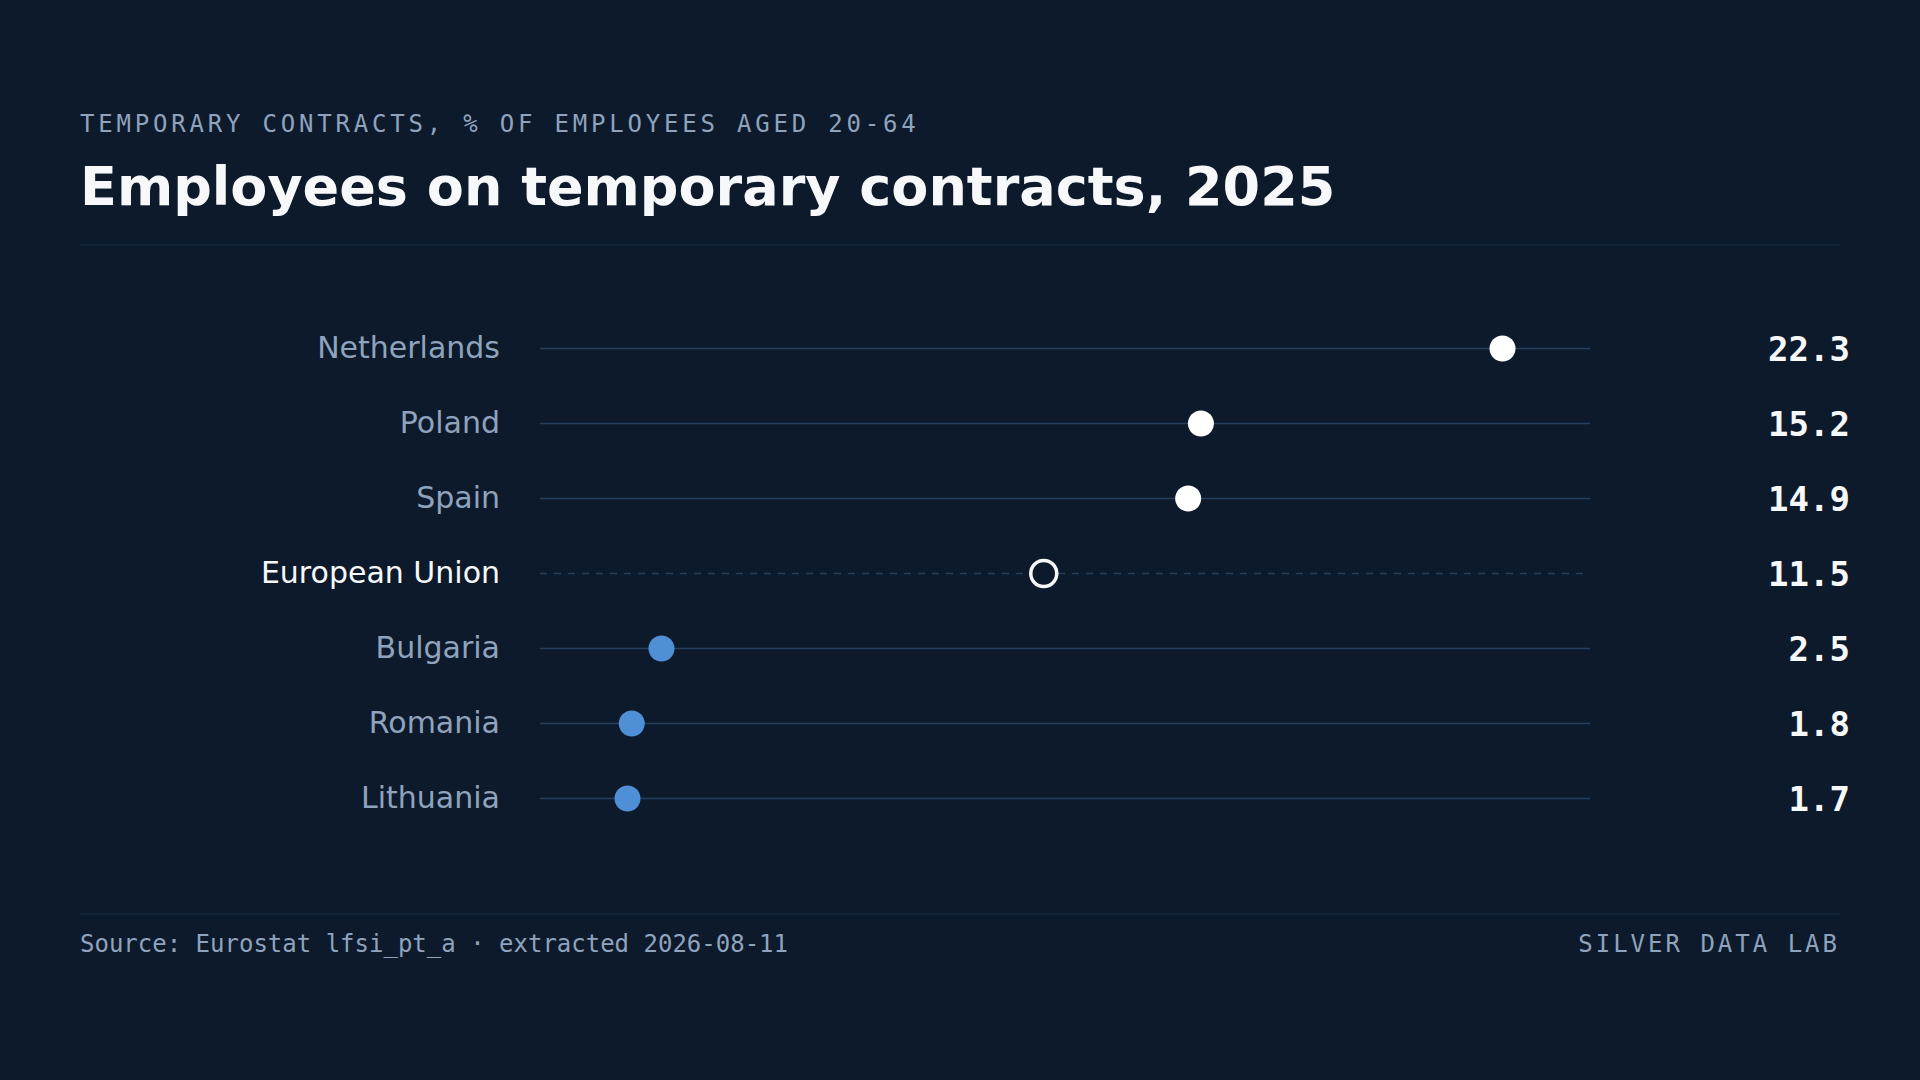
- 11.5% of employees aged 20 to 64 in the EU were on temporary contracts in 2025.
- The Netherlands records 22.3%, more than one employee in five.
- Lithuania records 1.7%, Romania 1.8% and Bulgaria 2.5%.
- Seven Member States are below 5% and only eight are above the EU rate.
- The Dutch rate is thirteen times the Lithuanian one, a spread wider than any difference in unemployment between the two.
What a temporary contract is, and what it is not
An employee is counted as temporary if their job has an agreed end date: a fixed-term contract, a seasonal engagement, a replacement post, an agency placement with a defined term.
Across the EU in 2025, 11.5% of employees aged 20 to 64 held one. The national figures run from 22.3% to 1.7%.
A ranking of legal systems
The spread here is thirteen to one, which is far wider than differences in unemployment, wages or economic performance between the same countries. That alone suggests the indicator is measuring something other than labour market conditions.
What it is largely measuring is how each Member State's employment law is written: how easily a permanent contract can be ended, what a fixed-term contract may be used for, how many times it may be renewed and after how long it converts to a permanent one.
Where dismissal from a permanent job is difficult and costly, employers use fixed terms to preserve flexibility, and the temporary share rises. Where dismissal is comparatively straightforward, a permanent contract carries less risk and there is less reason to avoid offering one.
The Netherlands and Spain
The Netherlands records 22.3%, the highest in the Union. Spain records 14.9%, Poland 15.2% and Portugal 14.8%.
Spain's position is the one that has moved most. It held the top of this ranking for only four years before the Netherlands took it, and never by more than two points; Poland led it for the eight years before that, by as much as four points over Spain. A 2021 labour reform then restricted the grounds on which fixed-term contracts could be used, and the Spanish rate fell from 24.9% that year to 14.9% in 2025, the largest fall in the Union over those years by more than a factor of two. Two of the source's own notes sit between that movement and the reform, though: the labour force survey moved to a new framework in the same year, so values either side of it are not strictly comparable, and Eurostat flags the Spanish figures from that year onwards as reported on a definition that differs — the flag the ranking above carries. How much of the fall each accounts for is not something this table can say.
That the Netherlands has taken the top position is the counterpoint. It is a country with low unemployment, high employment and the Union's largest part-time share, and it makes heavier use of temporary contracts than any other Member State.
The low end
Lithuania records 1.7%, Romania 1.8%, Bulgaria 2.5%, Latvia 2.5% and Estonia 2.9%.
Seven Member States are below 5%, and all seven are in central and eastern Europe.
A low temporary share is often read as a sign of secure employment, and here it should not be. In several of these Member States, dismissal from a permanent contract is comparatively straightforward, which makes a permanent contract less permanent than the same words would imply further west. The instrument employers elsewhere achieve with a fixed term is available inside the standard contract.
Why the indicator is still worth having
None of that makes the measure useless. It identifies where a two-tier labour market exists — where a protected group of permanent employees coexists with a larger group cycling through fixed terms — and that division has real consequences for training, mortgages and household formation.
It does mean a low figure and a secure workforce are not the same thing, and a ranking of temporary contracts is not a ranking of job security.
Employees on temporary contracts, 2025
| Country | % of employees aged 20-64 | Gap to EU averagepercentage points, derived |
|---|---|---|
| Netherlands | 22.3 | +10.8 |
| Poland | 15.2 | +3.7 |
| Spain | 14.9d | +3.4 |
| European Unionaggregate | 11.5 | — |
| Bulgaria | 2.5 | −9.0 |
| Romania | 1.8 | −9.7 |
| Lithuania | 1.7 | −9.8 |
Flags carried by the source on these values: d definition differs
This table as data: CSV · JSON
Every Member State for this indicator+
Members see every Member State for this indicator here, not only the rows the ranking prints. Become a Member
Embed this chart
Paste this code into a page. The frame carries the source and the extraction date, and links back to the study.
What these figures cannot tell you
- Contract form is not job security
- A low temporary share can reflect permanent contracts that are easy to terminate rather than employment that is genuinely stable. The indicator measures the legal form of the contract, not the protection it delivers.
- Employees only
- The rate is calculated among employees, so the self-employed are excluded entirely. In Member States with high self-employment, a large part of insecure work sits outside this measure.
- Involuntary and voluntary are not separated
- Some temporary work is chosen — students, people between career stages, seasonal workers who prefer it. This series does not distinguish that from temporary work accepted for lack of an alternative.
- Legal definitions differ at the margin
- What counts as a fixed-term engagement depends on national contract law, and agency and probationary arrangements are treated differently between Member States.
Frequently asked questions
- How many Europeans work on temporary contracts?
- 11.5% of employees aged 20 to 64 in the EU in 2025. National rates range from 22.3% in the Netherlands to 1.7% in Lithuania.
- Which EU country uses temporary contracts most?
- The Netherlands, at 22.3% of employees in 2025, ahead of Poland at 15.2% and Spain at 14.9%. Spain held the top position for years before a 2021 reform restricted the use of fixed-term contracts.
- Which EU country uses them least?
- Lithuania at 1.7%, Romania at 1.8% and Bulgaria at 2.5%. Seven Member States are below 5%, all of them in central and eastern Europe.
- Does a low temporary rate mean jobs are more secure?
- Not necessarily. Where permanent contracts can be ended comparatively easily, employers have less reason to use fixed terms, so the temporary share is low without employment being more stable. The indicator measures contract form, not the protection it provides.
Methodological note
Eurostat publishes temporary employment from the EU labour force survey as a share of total employees. This study uses employees aged 20 to 64, both sexes, with the temporary share measured against all employees rather than against total employment.
Values are for 2025 and cover all 27 Member States.
The counts of Member States above the EU rate and below 5%, and the ratio between the highest and lowest, are derived by Silver Data Lab from the published rates. The archived extraction carries the whole series the source publishes, which is where Spain's and Poland's earlier positions and the size of the Spanish fall can be checked; the length of Spain's run at the top, its margins over second place, and the fall and its comparison with the next largest are derived the same way.
Source data
The underlying series can be inspected and re-downloaded from the Eurostat data browser. The filters below are the ones applied.
Part-time employment and temporary contracts
lfsi_pt_a
- Filters applied:
- freq=A · wstatus=EMP_TEMP · sex=T · age=Y20-64 · unit=PC_SAL
- Extracted:
- 2026-10-10
- Source last updated:
- 2026-09-10
Download the data
The data the study you have just read is built on, exactly as it was downloaded and archived.
Yours as a Member.
Data downloadable by Members
How to cite
Record the vintage as well as the study: the figures on this page are the ones extracted on the dates below.
Silver Data Lab Research Desk (2026). More Than One Dutch Employee in Five Is on a Temporary Contract. Silver Data Lab, published 14 June 2026, last updated 11 October 2026. https://www.silverdatalab.com/studies/temporary-contracts-in-the-eu
- Data: Eurostat, Part-time employment and temporary contracts (lfsi_pt_a), filters freq=A, wstatus=EMP_TEMP, sex=T, age=Y20-64, unit=PC_SAL; extracted 2026-10-10; source last updated 2026-09-10. https://doi.org/10.2908/lfsi_pt_a
Silver Data Lab's analysis is licensed CC BY 4.0. The statistics remain their publisher's and keep its terms of reuse.
Ask the research desk
A question about this study — a definition, a filter, a break in the series, what the figures can and cannot support — answered by the desk that made the extraction.
Members can write to the research desk
Other studies on the same dataset
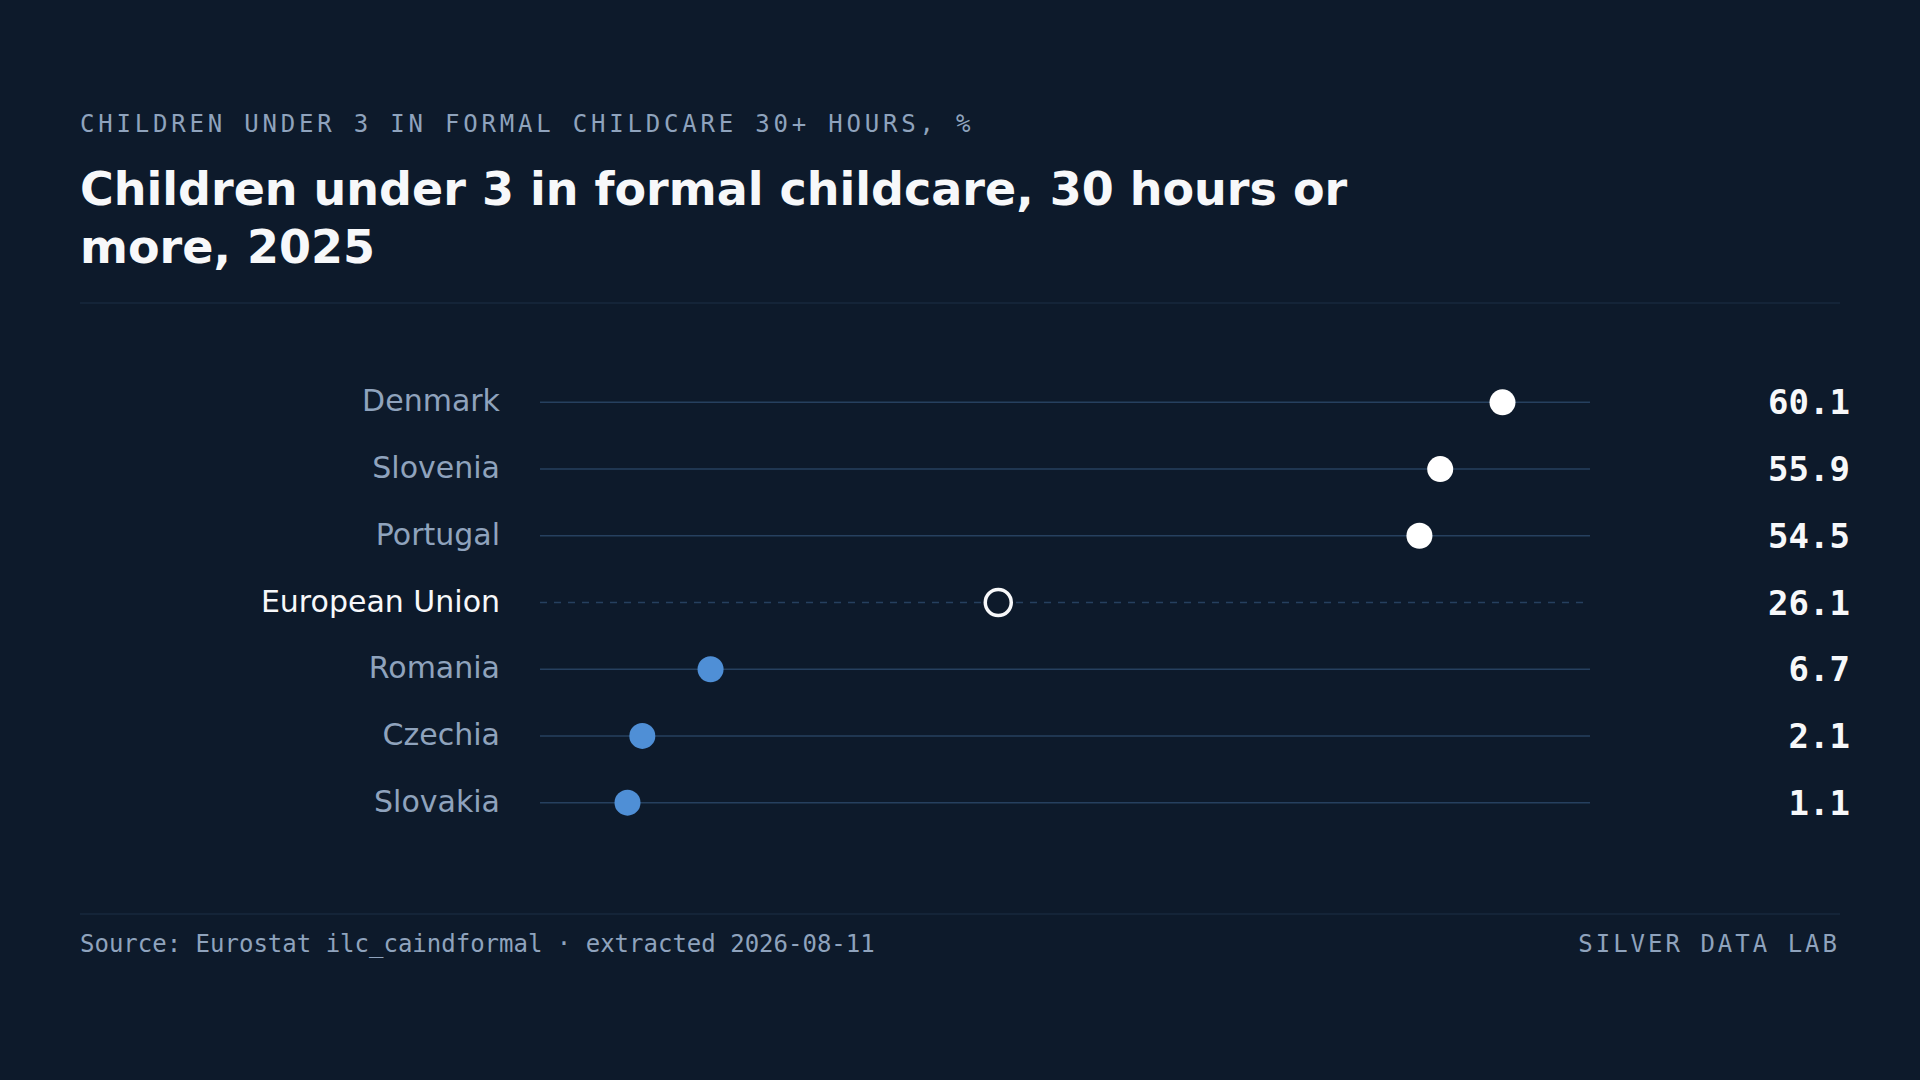
Most Danish Children Under Three Are in Full-Time Childcare
26.1% of EU children under three attended formal childcare for 30 hours a week or more in 2025.
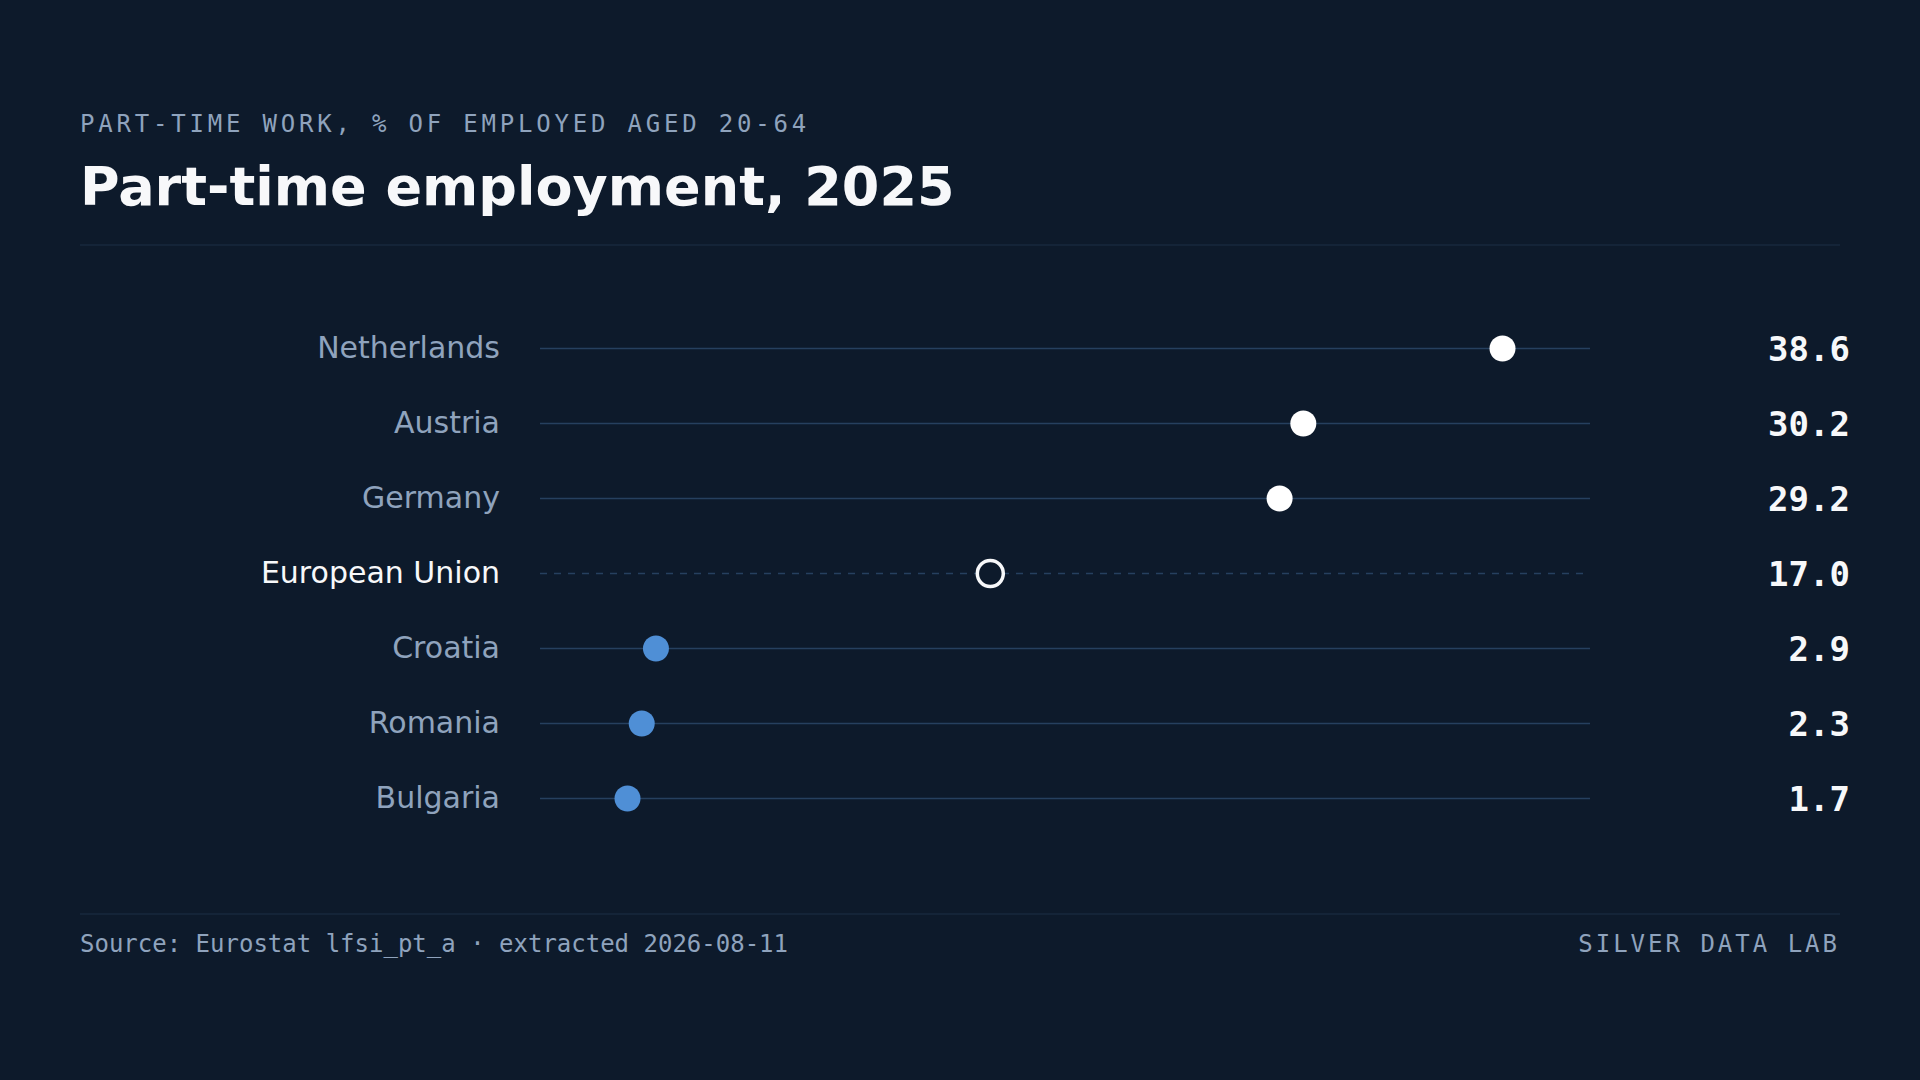
Nearly Four in Ten Dutch Workers Are Part-Time
17.0% of employed people aged 20 to 64 in the EU worked part-time in 2025.
Studies where the same country leads or trails
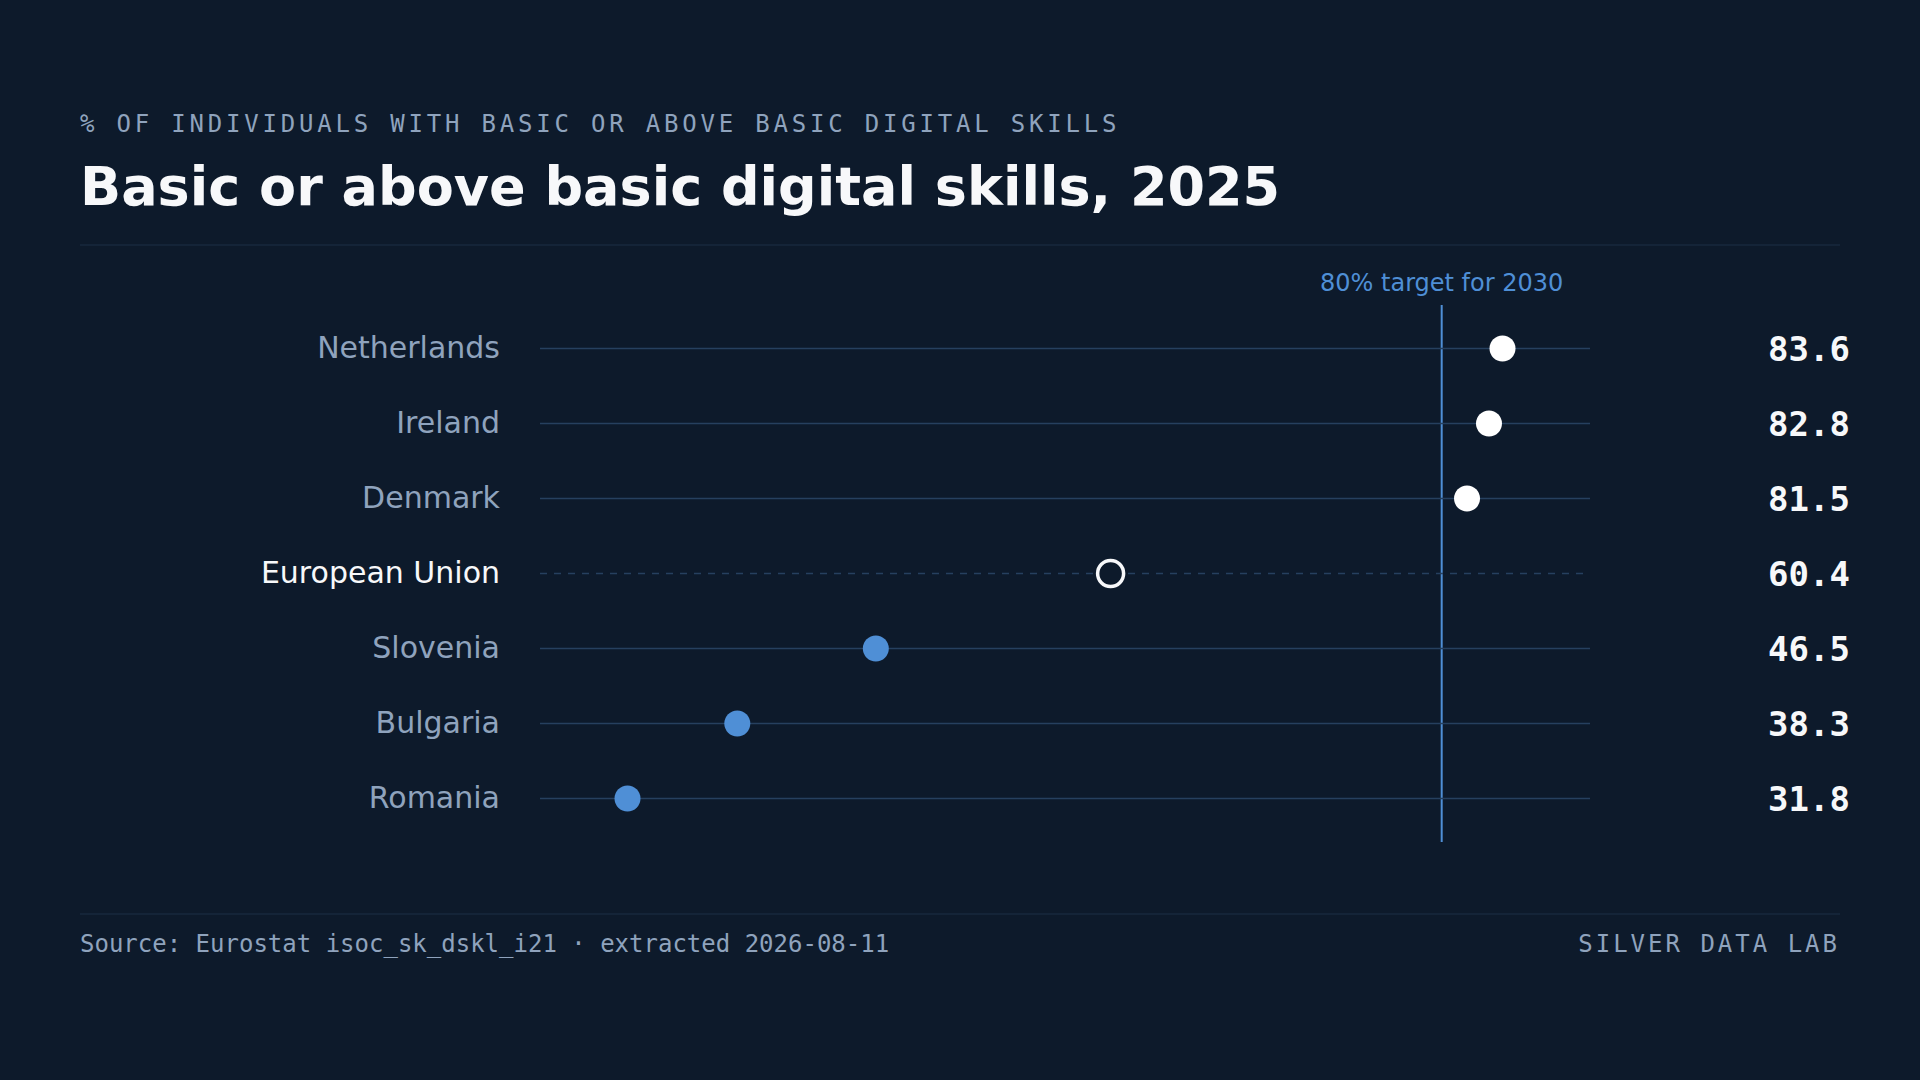
In Four EU Countries, Over 80% of People Have Basic Digital Skills
60.4% of people in the EU had at least basic overall digital skills in 2025, against the 80% the Union targets for 2030.
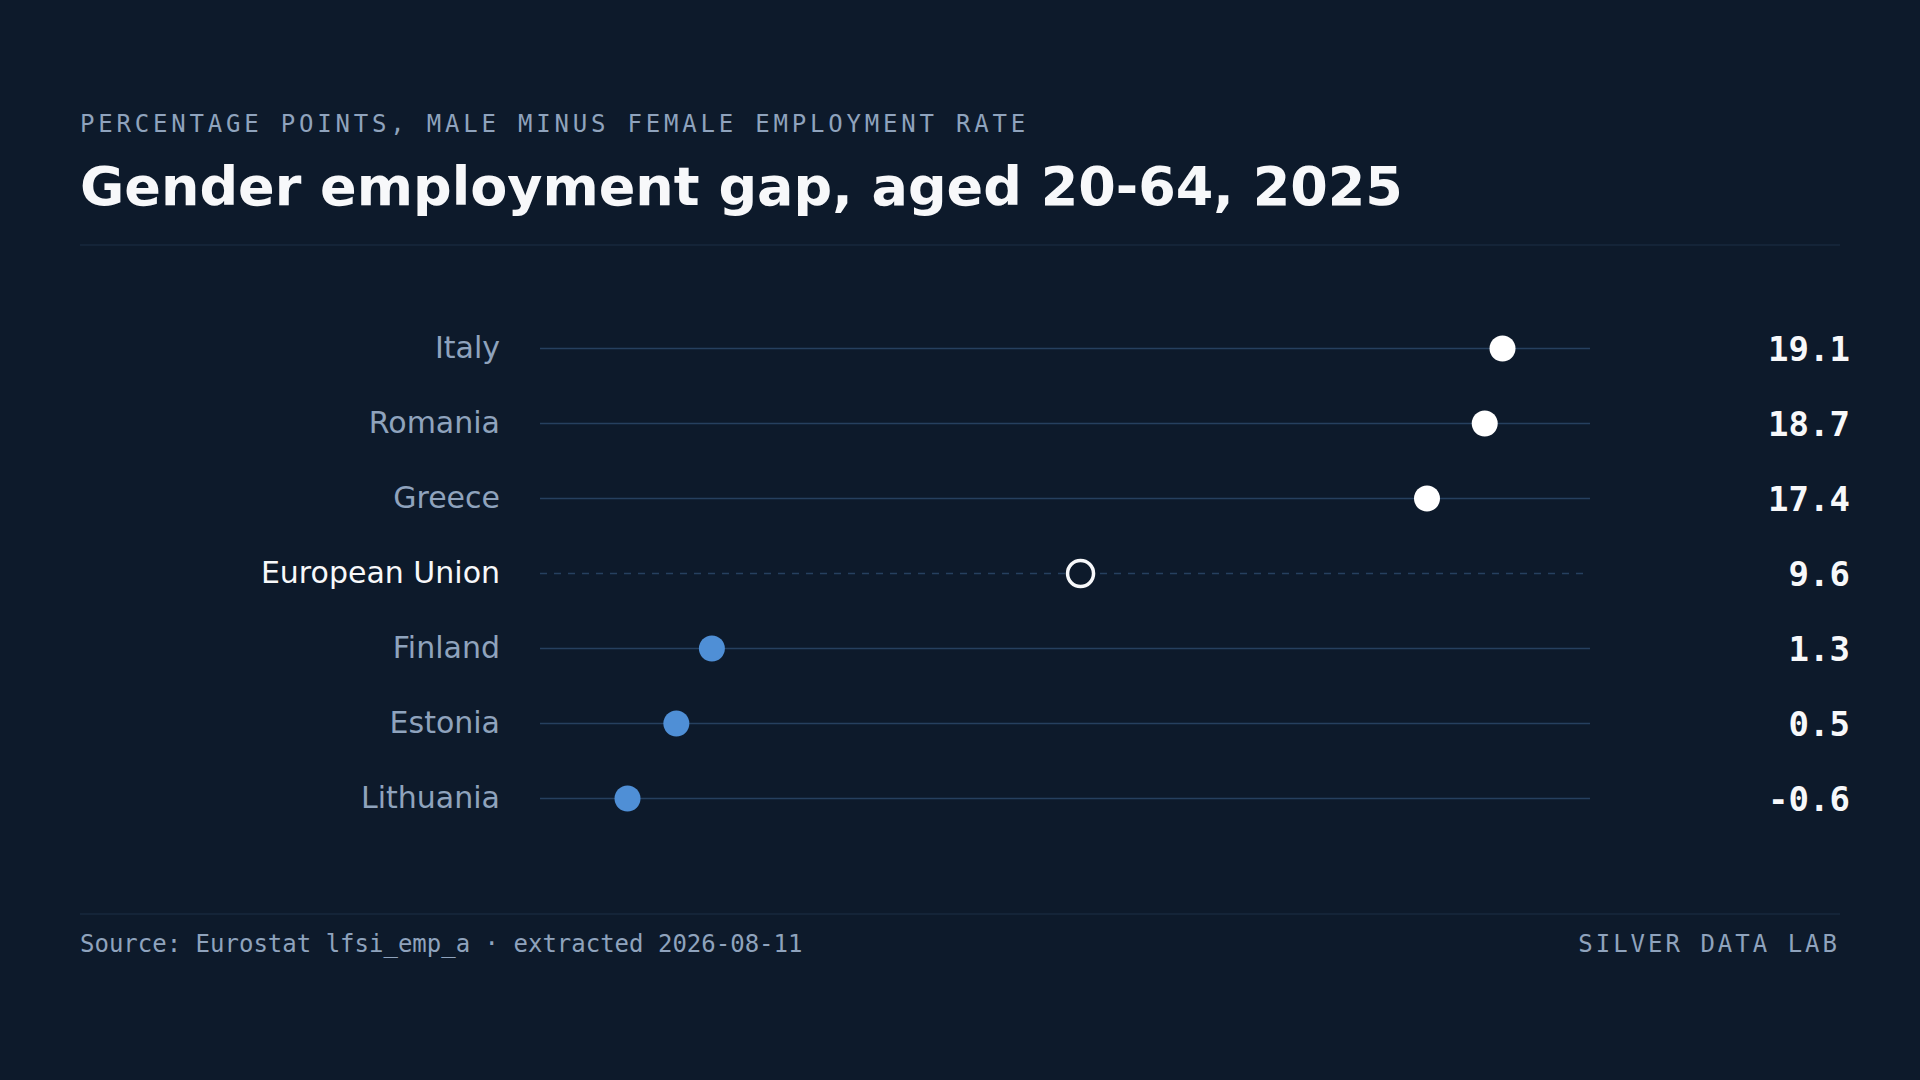
Lithuania Is the Only EU Country Where Women's Employment Exceeds Men's
Male employment exceeded female employment by 9.6 percentage points across the EU in 2025.
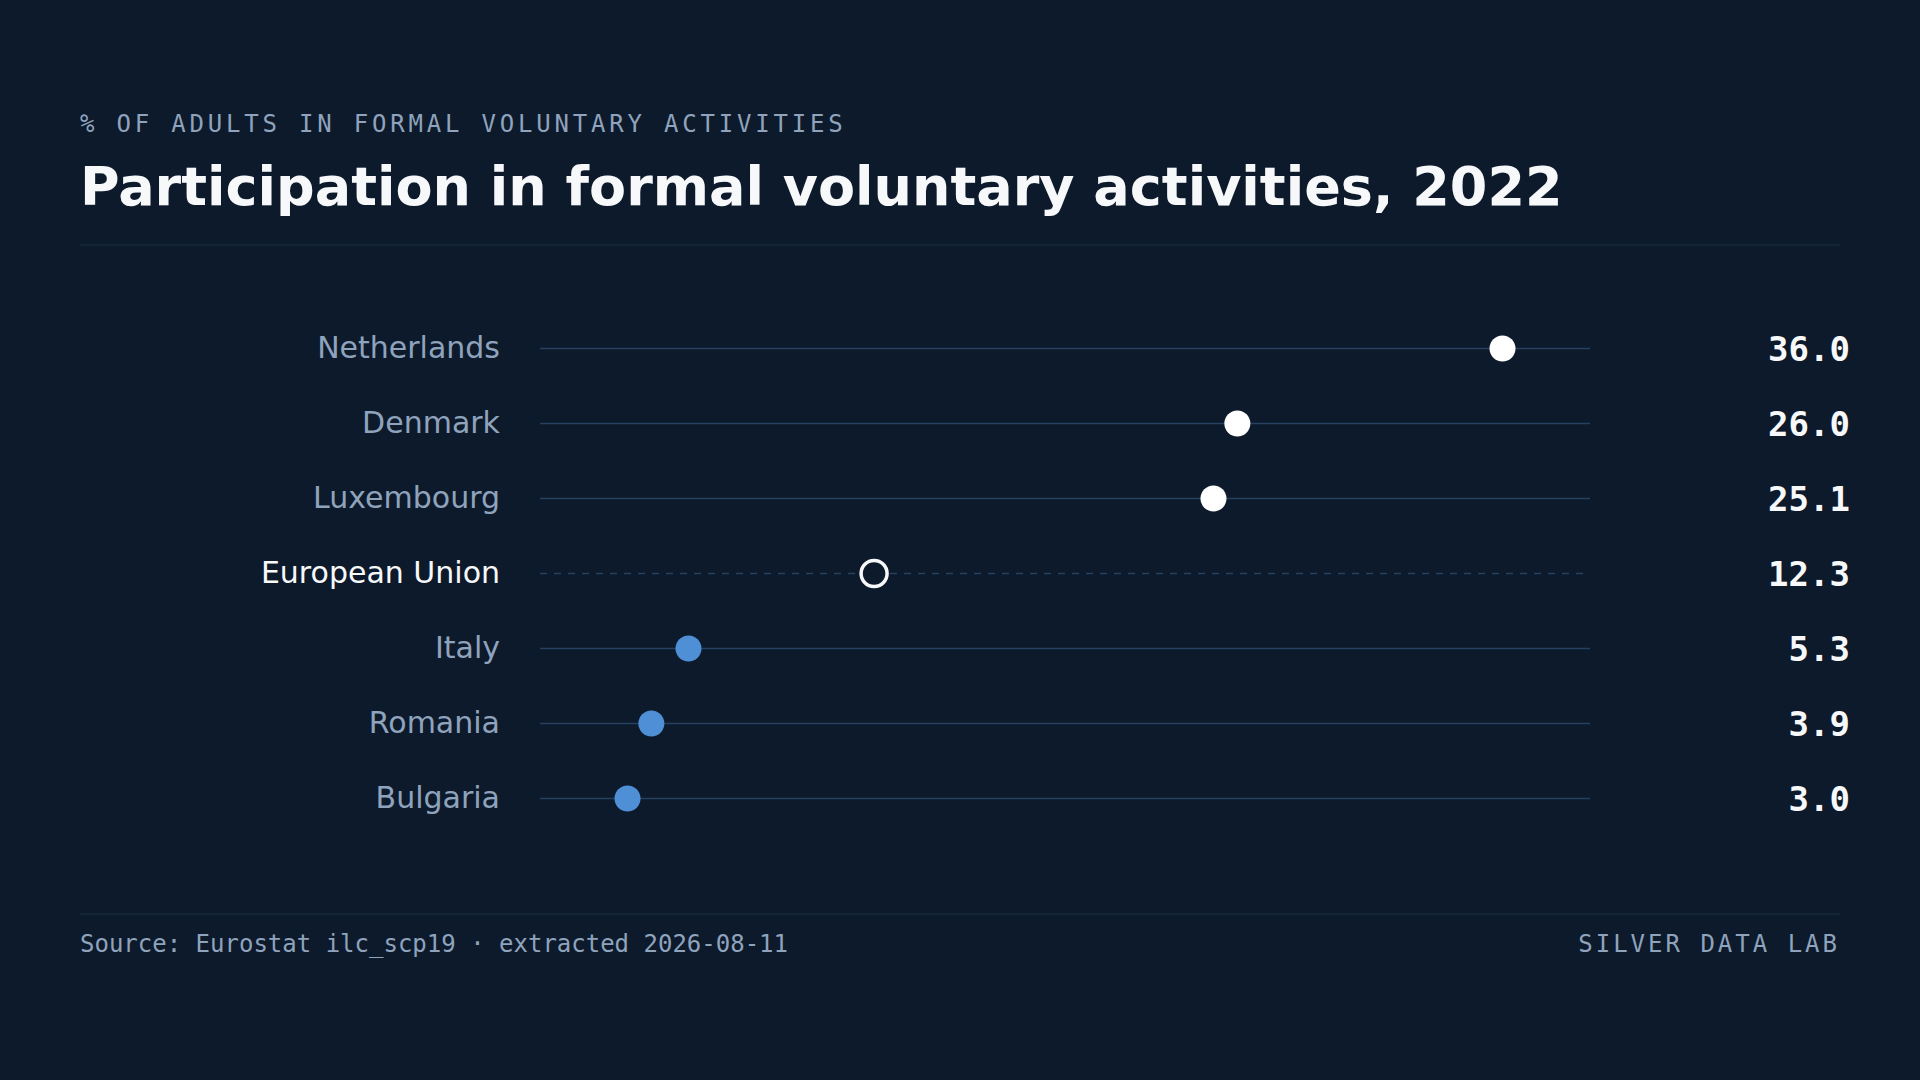
More Than a Third of Dutch Adults Do Voluntary Work
12.3% of EU adults took part in formal voluntary activities in 2022.