Italy Spends a Larger Share of GDP on Pensions Than Any Other EU Country
Silver Data Lab Research Desk · Statistical analysis · Published on 04 October 2026
- Data source
- Eurostat
- Reference period
- 2024
- Last updated
- 11 October 2026
Re-checked against the source on 08 October 2026. 6 values in its datasets moved between snapshots, 2 of them figures stated on this page. Every revision we have observed →
Key estimates
- The EU spent a provisional 12.62% of its GDP on pensions in 2024, up from an estimated 12.31% in 2023 but still below the estimated 13.15% of 2013.
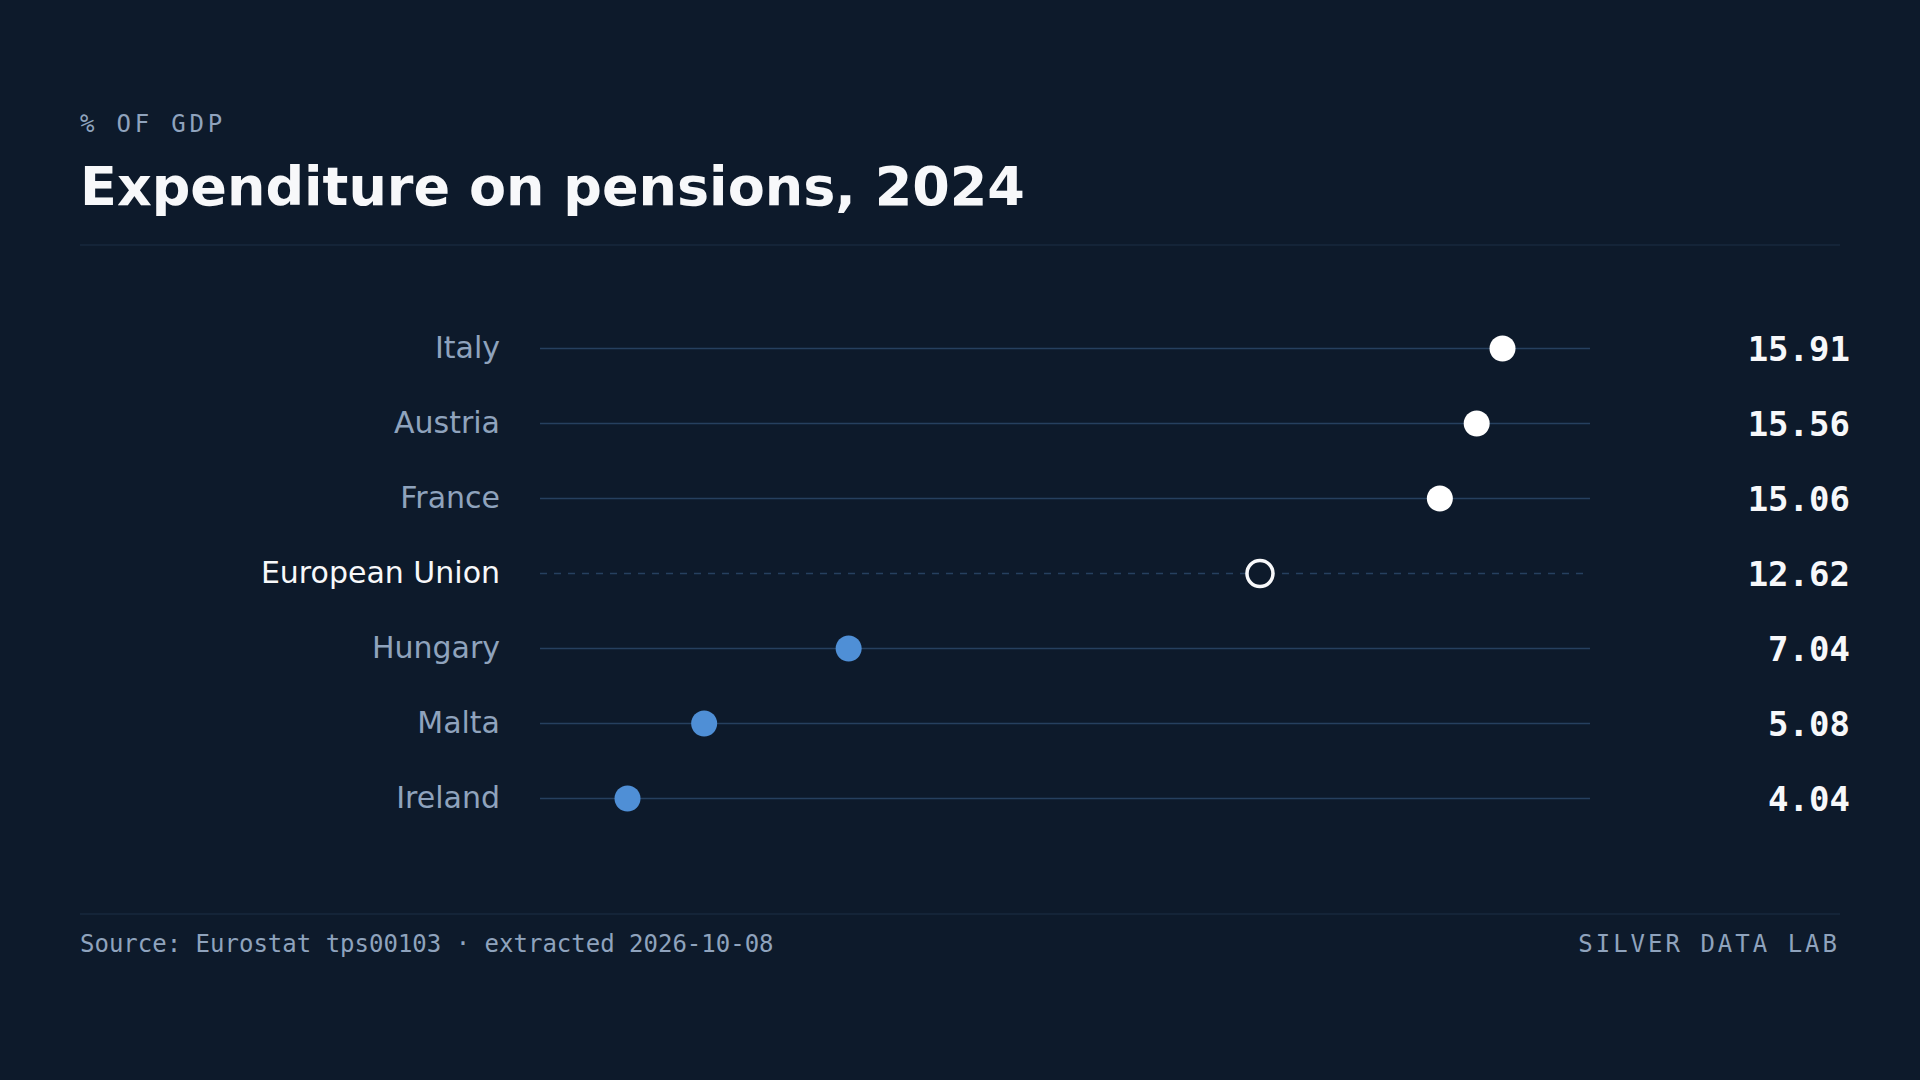
- Italy spent 15.91% of GDP, more than any other Member State; Austria followed at 15.56% and France at 15.06%. Ireland spent 4.04% and Malta 5.08%.
- The share rose in 21 of the 27 Member States between 2023 and 2024. Austria's rise of 1.12 points was the largest and took it past France into second place; the count and the change are computed here.
- Across the whole table, 2013 to 2024, the share fell in 15 Member States and rose in 12. Greece, first in every year from 2013 to 2018, went from a peak of 17.84% in 2015 to 14.09% in 2024, fifth in the Union.
- Thirteen Member States spent less than 10% of GDP on pensions in 2024: Ireland, and twelve of the thirteen countries that joined the EU from 2004 onwards.
What the table adds up
Each value here is one country's spending on pensions in a year, divided by its gross domestic product (GDP), the value of everything its economy produced in that year. The word pension is taken broadly. The total covers old-age pensions, including those drawn early or only in part, and also disability pensions, survivors' pensions, which are paid because of a relationship to someone who has died, and early-retirement benefits granted for reduced capacity to work or for labour-market reasons.
Every Member State reports these benefits to Eurostat on shared definitions, the framework known as ESSPROS (the European System of integrated Social Protection Statistics), so that a pension paid in Lisbon and one paid in Tallinn fall into the same categories. Pensions are counted gross, before any income tax or contribution the pensioner pays on them, and whether or not they depend on a test of the recipient's means.
Who spends most and who spends least
For the Union as a whole the bill came to 12.62% of GDP in 2024, a value Eurostat flags as provisional, which means it may still be revised. That is the latest year in the table and the one the main ranking uses. Italy spent the largest share, 15.91%, followed by Austria at 15.56% and France at 15.06%, the only three Member States at 15% or more. Finland at 14.46% and Greece at 14.09% are also above 14%, and Belgium at 13.46%, Spain at 13.23% and Portugal at 13.00% complete the eight above the EU figure.
At the bottom, Ireland spent 4.04%, Malta 5.08%, Hungary 7.04%, Lithuania 7.38% and Cyprus 7.56%: five Member States below 8%. Italy's share is a little over three times Malta's and 11.87 percentage points of GDP larger than Ireland's, a ratio and a difference worked out here rather than published, as are the counts of countries throughout this page.
Why most countries sit below the EU figure
Eight Member States spend more than the EU figure and nineteen spend less. The five closest below it are Germany at 11.83%, itself a provisional value, Poland at 11.61%, Denmark at 11.38%, the Netherlands at 11.18% and Sweden at 10.81%.
The EU value is not a simple average of the 27 national shares. Counting every country once, that average comes to 10.64%, about two points below the EU figure; it is calculated here and appears nowhere in the table. The gap is consistent with a figure for the Union taken as one economy, in which a large country counts for more than a small one. Germany, France, Italy and Spain, the largest economies in the Union, all sit above that unweighted average: Italy first in the ranking, France third, Spain seventh and Germany ninth.
Thirteen countries under ten per cent
Thirteen Member States spent less than 10% of GDP on pensions in 2024. Twelve of them are among the thirteen countries that joined the Union from 2004 onwards: Slovenia at 9.99%, Bulgaria at 9.64%, Slovakia at 9.45%, Croatia at 9.36%, Romania at 9.09%, Czechia and Latvia at 9.03% each, Estonia at 8.67%, and Cyprus, Lithuania, Hungary and Malta. Poland is the one country from those enlargements above the line. Ireland, a member since long before them, is the thirteenth.
A low share can mean smaller pensions, fewer people drawing them, or simply a large output to divide them by. This ratio does not distinguish between them, and the table offers no way to tell which applies where.
From 2013 to 2024: more falls than rises
Every change quoted from here on is one published share minus another, computed here, and the counts of countries rising or falling are made from those differences. Across the whole table, from 2013 to 2024, the share fell in 15 Member States and rose in 12. One of the falls, Hungary's, spans a break in its series in 2015, Eurostat's flag for a change in sources or method that leaves the values before and after not fully comparable. The EU figure went from an estimated 13.15% to 12.62%, 0.53 points lower, and declined in every year from 2013 to 2019.
Ireland fell the most, by 3.89 points, followed by Malta at 3.20, Greece at 2.83 and Portugal at 2.64. Greece is the story at the top of the table. It spent the largest share in the Union in every year from 2013 to 2018, reaching 17.84% in 2015, the highest value any Member State records in the table, and in 2024 it was fifth, behind Italy, Austria, France and Finland. Italy moved into first place in 2019 by three hundredths of a point, 15.83% against 15.80%, and has held it in every year since.
Malta's share fell in nine of the eleven yearly steps the table covers, from 8.28% in 2013 to 5.08% in 2024.
Twelve Member States went the other way. Finland rose the most, by 1.46 points to 14.46%, ahead of Luxembourg at 1.24, Belgium at 1.22 and Estonia at 1.21. Slovakia and Bulgaria also rose by more than a point, and the remaining six by less.
Where the comparison ends matters. Measured from 2013 to 2023, nineteen Member States had fallen and eight had risen; one more year of data moved Austria, Germany, Lithuania and Romania from the first group into the second.
What 2020 shows about a ratio
In 2020 the share rose in 26 of the 27 Member States, Ireland the exception, and the EU figure jumped from an estimated 12.59% to a provisional 13.53%, the highest value in its series. Spain rose by 1.76 points, Italy by 1.70 and Greece by 1.67. In 2021 the share fell in all 27, Italy's the most, by 1.34 points.
A movement that uniform, up everywhere and then down everywhere, is what a ratio does when its denominator, GDP, shifts across the whole Union at once, and 2020 was the year the pandemic interrupted economic activity across Europe. It is not evidence that 26 governments raised pensions in the same year. The table publishes the ratio and neither of its two terms, so it cannot show how much of any year's change came from pensions and how much from GDP.
Rising again since 2022
The EU figure fell to its lowest value in the table, 12.22%, in 2022, then rose in each of the next two years: by 0.09 points in 2023, when the share went up in 17 Member States, and by 0.31 points in 2024, when it went up in 21 of the 27. The 12.62% of 2024 is the highest EU value since the 12.78% of 2021.
Austria rose the most in 2024, by 1.12 points to 15.56%, the highest value in its own series and the largest one-year rise any Member State records outside the step from 2019 to 2020. It moved from third place to second, ahead of France. Poland and Slovakia both rose by 0.80 points, Romania by 0.79 and Finland by 0.73, enough to take Finland past Greece into fourth place. Six Member States fell, none by more than Ireland's 0.20 points; the other five are Czechia, Denmark, Malta, Hungary and Cyprus.
Why Ireland's figure is so low
Ireland has had the lowest share in the Union in every year from 2015 to 2024. Between 2014 and 2015 its value dropped from 7.38% to 5.57%, a fall of 1.81 points and the largest one-year fall of any Member State in the table. Which side of the fraction moved is beyond what this table can show, but the likeliest explanation lies below the line. Ireland's output is swollen by the accounts of multinational groups that hold patents and book profits there, earnings that bear little relation to the incomes of people living in the country, and dividing anything by that output makes it look small. The 4.04% is the published value and stays in the ranking, but it is a share of an output that overstates the domestic economy, not a measure of what Irish pensions are worth.
Expenditure on pensions, 2024
| Country | % of GDP | Gap to EU figurepercentage points, derived |
|---|---|---|
| Italy | 15.91 | +3.3 |
| Austria | 15.56 | +2.9 |
| France | 15.06 | +2.4 |
| European Unionaggregate | 12.62p | — |
| Hungary | 7.04 | −5.6 |
| Malta | 5.08 | −7.5 |
| Ireland | 4.04 | −8.6 |
Flags carried by the source on these values: p provisional
This table as data: CSV · JSON
Every Member State for this indicator+
Members see every Member State for this indicator here, not only the rows the ranking prints. Become a Member
Embed this chart
Paste this code into a page. The frame carries the source and the extraction date, and links back to the study.
Change in expenditure on pensions, 2013 to 2024
| Country | percentage points of GDP, 2024 minus 2013 | Gap to EU figurepercentage points, derived |
|---|---|---|
| Finland | 1.46 | +2.0 |
| Luxembourg | 1.24 | +1.8 |
| Belgium | 1.22 | +1.8 |
| Estonia | 1.21 | +1.7 |
| European Unionaggregate | -0.53 | — |
| Portugal | -2.64 | −2.1 |
| Greece | -2.83 | −2.3 |
| Malta | -3.20 | −2.7 |
| Ireland | -3.89 | −3.4 |
This table as data: CSV · JSON
Every Member State for this indicator+
Members see every Member State for this indicator here, not only the rows the ranking prints. Become a Member
Embed this chart
Paste this code into a page. The frame carries the source and the extraction date, and links back to the study.
What these figures cannot tell you
- Gross spending, before tax
- ESSPROS records pensions before the income tax and social contributions that pensioners pay on them. Where pensions are taxed more heavily the gross share overstates what pensioners keep, so two countries with the same gross share can leave their pensioners with different amounts. Eurostat compiles net benefits in a separate module that this table does not use.
- Output is the denominator
- A share of GDP rises when output falls and drops when output grows, with no change in a single pension. The table publishes the ratio alone, so the synchronised rise of 2020 and fall of 2021 cannot be split between the two terms, and Ireland's GDP, enlarged by multinational accounting, makes its share look smaller than its pension bill would suggest against the domestic economy.
- A broad definition of pension
- The total combines old-age pensions with disability and survivors' pensions and early-retirement benefits. Countries that support people with disabilities, or people leaving work early, through pensions rather than other benefits will show higher totals for that reason alone. Schemes run by public and by private bodies are both covered, but arrangements a person makes on their own account, such as an individual pension policy, are outside the scope of ESSPROS.
- Estimates, provisional values and a break in series
- The EU aggregate is flagged as estimated for 2013 to 2019 and for 2022 and 2023, and as provisional for 2020, 2021 and 2024, so the reference figure beside the main ranking may still be revised. Germany's 2024 value is provisional, and Latvia's values are estimated in every year. Croatia's are estimated from 2013 to 2017, Romania's from 2013 to 2015 and Lithuania's from 2013 to 2019, so for all three the starting point of the 2013-2024 comparison is an estimate; Lithuania's and Slovenia's are provisional for 2020 and 2021. Hungary's series carries a break in 2015, inside the span that comparison covers.
Frequently asked questions
- How much does the EU spend on pensions?
- A provisional 12.62% of GDP in 2024, counting old-age, disability and survivors' pensions and early-retirement benefits, before tax. The figure was an estimated 13.15% in 2013, peaked at a provisional 13.53% in 2020 and was lowest in 2022, at an estimated 12.22%.
- Which EU country spends the most on pensions?
- Italy, at 15.91% of GDP in 2024, ahead of Austria at 15.56% and France at 15.06%. Italy has been first in every year since 2019; Greece was first from 2013 to 2018.
- Which EU country spends the least on pensions?
- Ireland, at 4.04% of GDP in 2024, followed by Malta at 5.08% and Hungary at 7.04%. Ireland's GDP includes large profits booked there by multinational groups, so a ratio taken over it says less about Irish pensions than the ranking suggests.
- Is pension spending rising as a share of GDP in the EU?
- For the last two years, yes: the EU figure went from an estimated 12.22% in 2022 to an estimated 12.31% in 2023 and a provisional 12.62% in 2024, and in 2024 the share rose in 21 of the 27 Member States. It is still below where the table starts, an estimated 13.15% in 2013, and 15 Member States spent a smaller share in 2024 than in 2013.
Methodological note
The table measures expenditure on pensions as a percentage of GDP for each Member State and for the EU in every year from 2013 to 2024. Pensions are the sum of disability pensions, early-retirement benefits for reduced capacity to work, old-age pensions, anticipated old-age pensions, partial pensions, survivors' pensions and early-retirement benefits for labour-market reasons, across all social protection schemes, means-tested or not, as compiled under ESSPROS.
The headline ranking and the text use 2024, the latest year. Eurostat's update of 7 October completed it for every Member State and the EU aggregate, adding the values for Ireland, Romania and the EU. Wherever the page quotes an EU share, the value is Eurostat's aggregate, unchanged.
Silver Data Lab computed only the following from the published shares: the change in a share between two years, in percentage points, for a Member State or for the EU aggregate, which includes the whole 2013-2024 ranking, the changes from 2023 to 2024, the EU's yearly changes and the largest one-year movements quoted in the text; the difference between two countries' shares in the same year, Italy and Ireland in 2024 and Italy and Greece in 2019; Italy's 2024 share as a multiple of Malta's; how many Member States lie above or below a threshold or the EU figure, how many rose or fell between two years, including the count from 2013 to 2023 set beside the one from 2013 to 2024, and in how many yearly steps Malta's share fell; the rank positions, first and last places, and highest and lowest values described in the text, including the comparison of the EU's 2024 value with its earlier years; and the unweighted average of the 27 national shares for 2024, 10.64%, and its distance from the EU figure. Every other figure on the page is Eurostat's.
Source data
The underlying series can be inspected and re-downloaded from the Eurostat data browser. The filters below are the ones applied.
Expenditure on pensions as percentage of GDP
tps00103
- Filters applied:
- freq=A · unit=PC_GDP · spdepm=TOTAL · spdepb=TOTAL
- Extracted:
- 2026-10-08
- Source last updated:
- 2026-10-07
Download the data
The data the study you have just read is built on, exactly as it was downloaded and archived.
Yours as a Member.
Data downloadable by Members
How to cite
Record the vintage as well as the study: the figures on this page are the ones extracted on the dates below.
Silver Data Lab Research Desk (2026). Italy Spends a Larger Share of GDP on Pensions Than Any Other EU Country. Silver Data Lab, published 04 October 2026, last updated 11 October 2026. https://www.silverdatalab.com/studies/pension-spending-in-the-eu
- Data: Eurostat, Expenditure on pensions as percentage of GDP (tps00103), filters freq=A, unit=PC_GDP, spdepm=TOTAL, spdepb=TOTAL; extracted 2026-10-08; source last updated 2026-10-07. https://doi.org/10.2908/tps00103
Silver Data Lab's analysis is licensed CC BY 4.0. The statistics remain their publisher's and keep its terms of reuse.
Ask the research desk
A question about this study — a definition, a filter, a break in the series, what the figures can and cannot support — answered by the desk that made the extraction.
Members can write to the research desk
Studies where the same country leads or trails
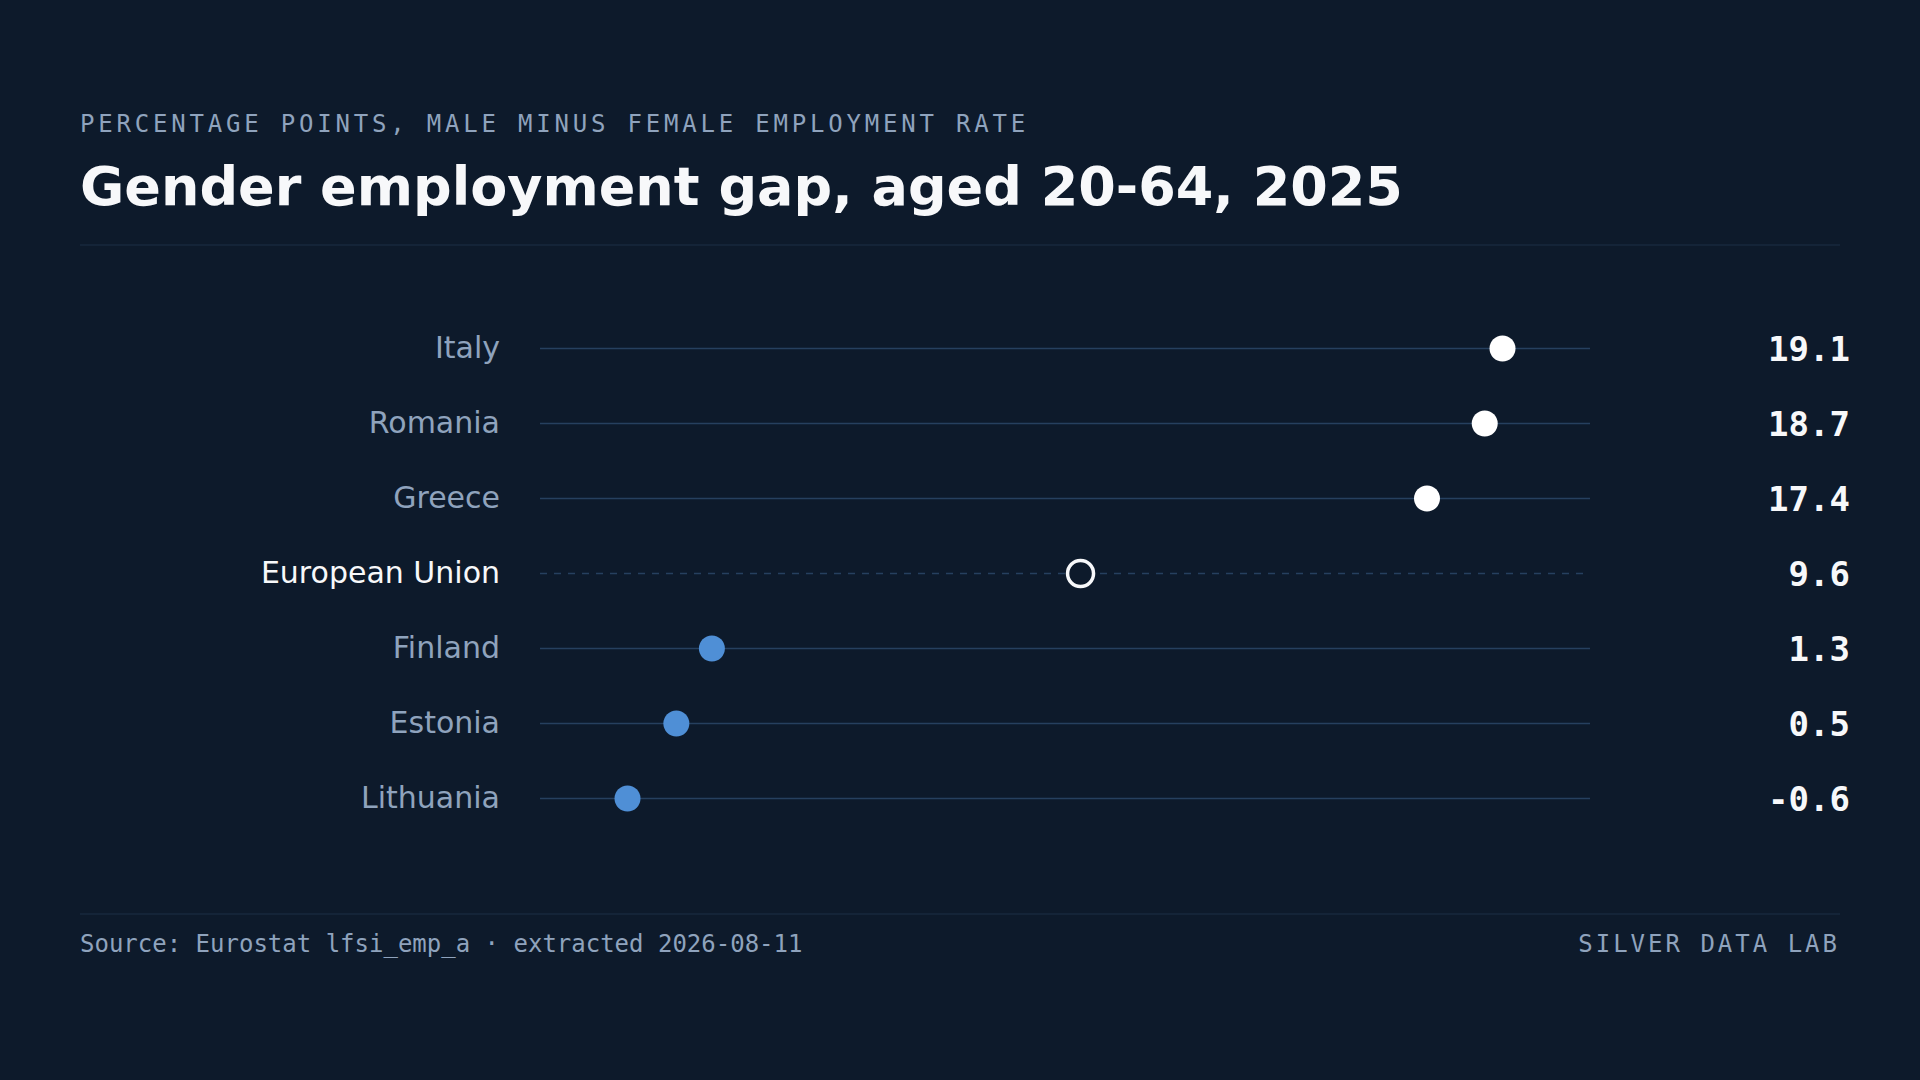
Lithuania Is the Only EU Country Where Women's Employment Exceeds Men's
Male employment exceeded female employment by 9.6 percentage points across the EU in 2025.
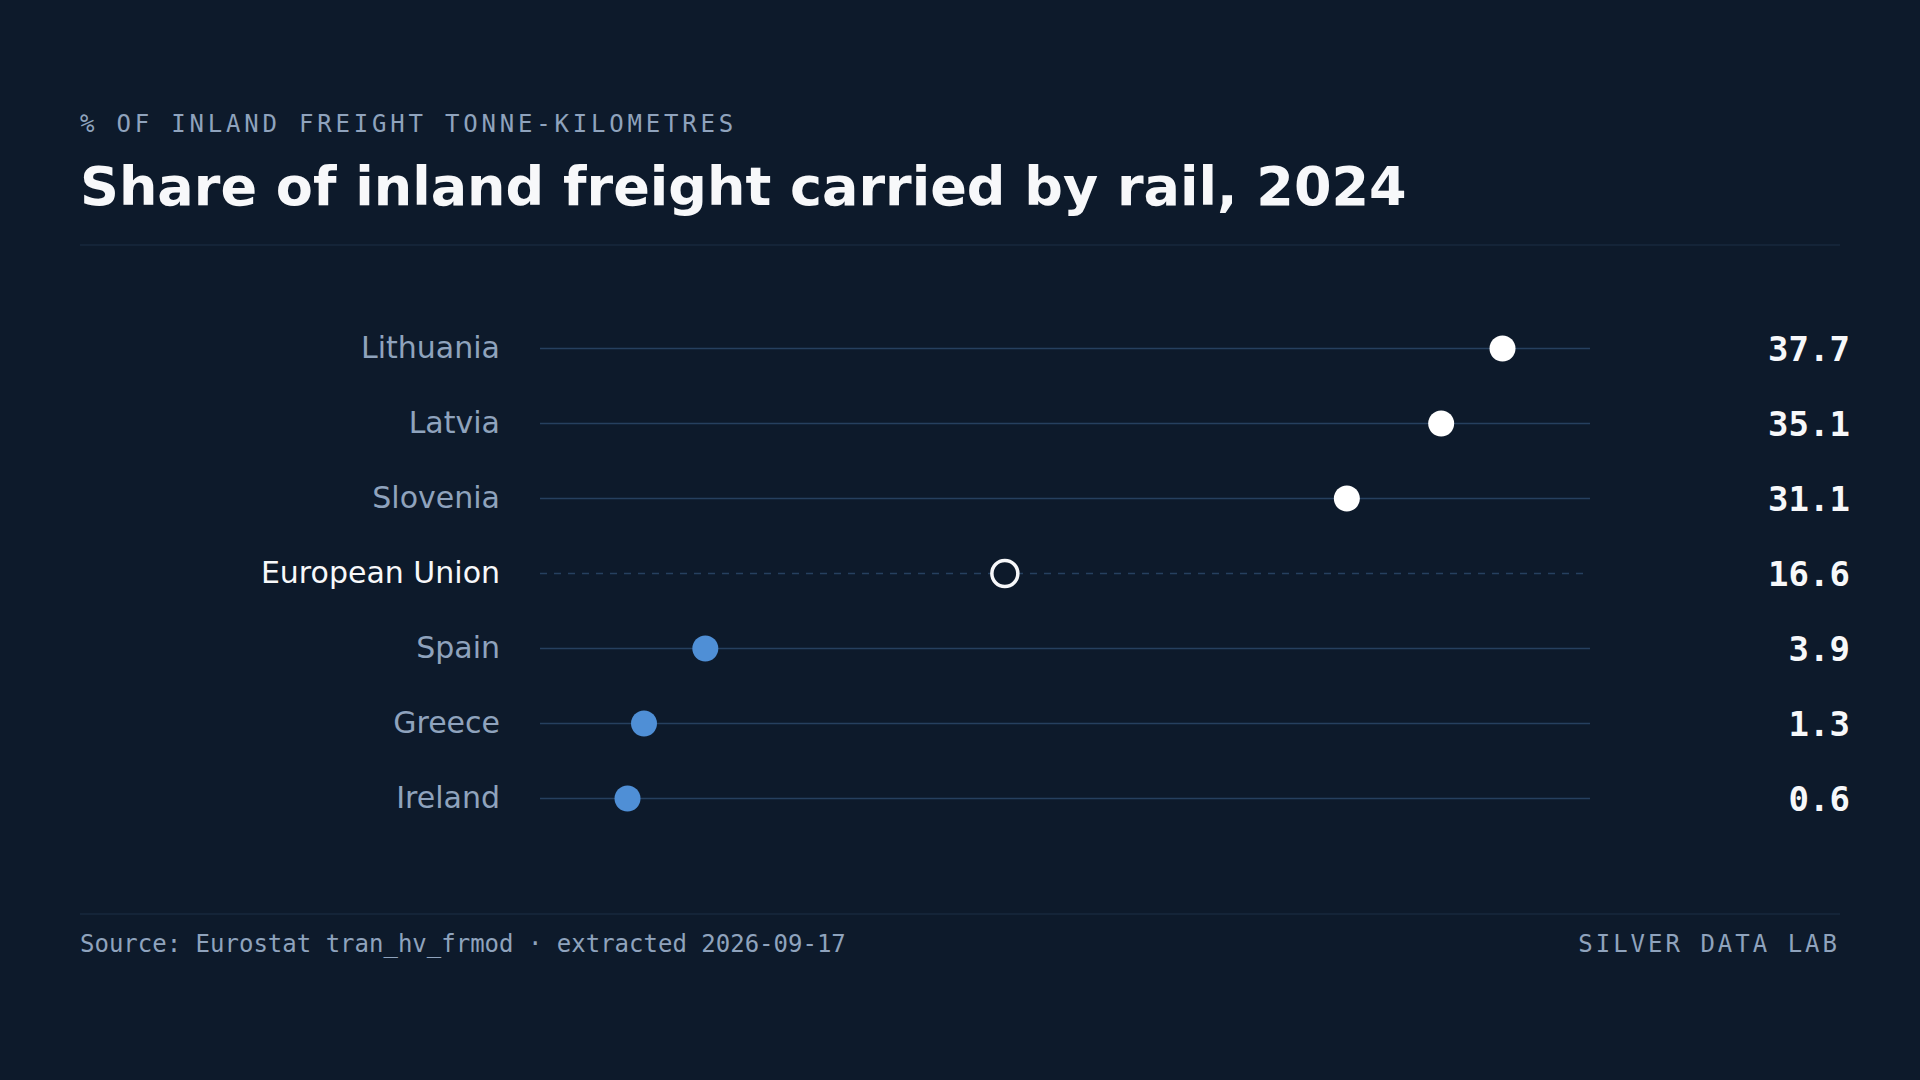
Lithuania Moves More of Its Freight by Rail Than Any Other EU Country
Rail carried 16.6% of inland freight across the EU in 2024, measured in tonne-kilometres; road carried 78.2% and inland waterways 5.2%.
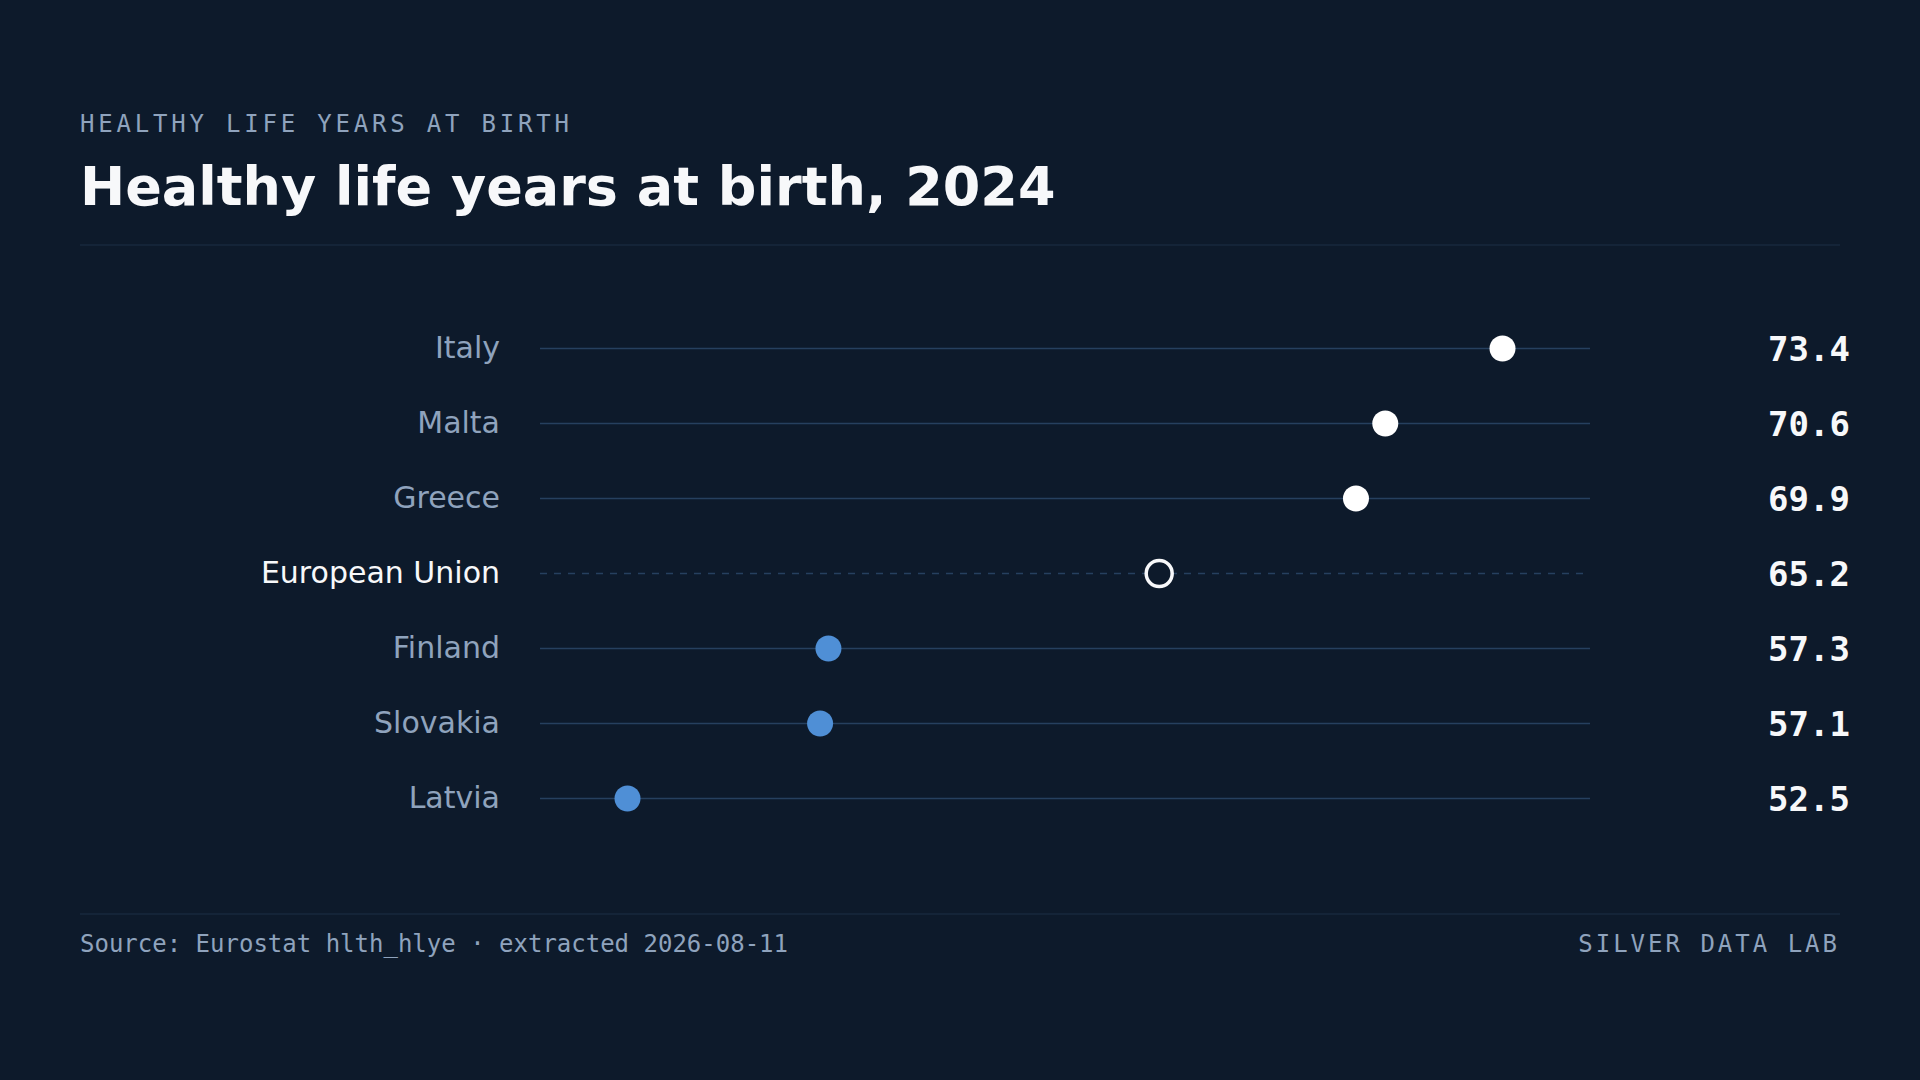
Italians Can Expect Nearly 21 More Healthy Years Than Latvians
A person born in the EU in 2024 could expect 65.2 years free of activity limitation.