Portugal's Homes Are Harder to Afford Than Usual by the EU's Widest Margin
Silver Data Lab Research Desk · Statistical analysis · Published on 19 April 2026
- Data source
- Eurostat
- Reference period
- 2024
- Last updated
- 11 October 2026
Re-checked against the source on 09 October 2026. No value in its datasets has moved between the snapshots we hold. Every revision we have observed →
Key estimates
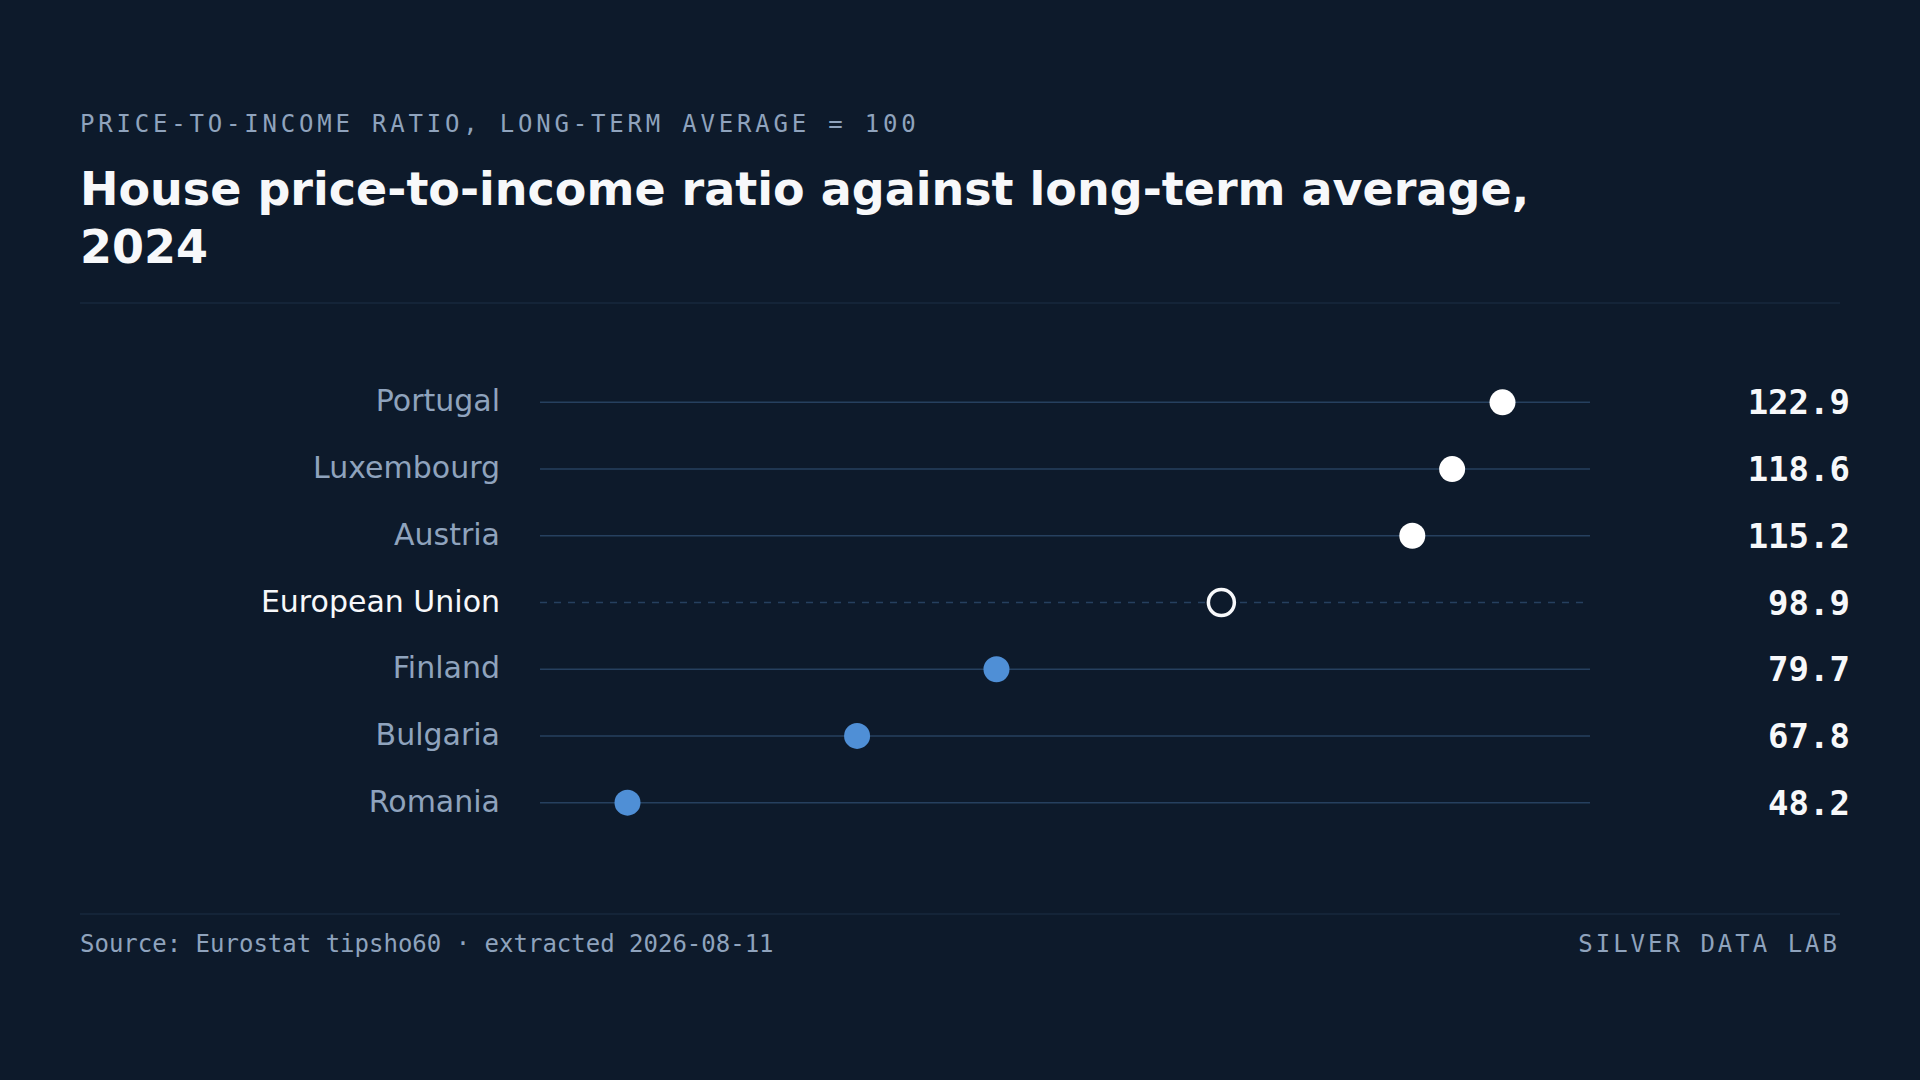
- The EU price-to-income ratio stood at 98.9 in 2024 against its own long-term average of 100 — housing across the Union is close to its historical norm.
- Portugal records 122.9, Luxembourg 118.6, Austria 115.2 and Czechia 112.1.
- Romania records 48.2, less than half its own long-term average, and Bulgaria 67.8.
- Italy at 85.8 and Finland at 79.7 are the western Member States furthest below their norms.
- The EU aggregate near 100 conceals a range of 75 index points.
A measure with a moving benchmark
Most housing comparisons ask whether prices are high. This one asks a harder question: whether prices are high relative to what that country's own residents have historically paid.
The ratio divides house prices by income, then indexes each country against its own long-term average. A value of 100 means housing takes the same share of income as it typically has there. A value of 120 means it takes a fifth more.
Two details of that construction decide how it should be read, and both come from the source's own definition. The long-term average runs from 2000 to the latest year a country's own series reaches, so the benchmark is up to a quarter-century of that country's own history rather than its recent past — shorter where the series starts later, as it does for the EU aggregate itself. And income here is not wages: it is adjusted gross disposable income per head of population — income after tax and cash benefits, with services the state provides in kind counted in as well.
That construction removes the problem that makes raw price comparisons useless. Housing in Luxembourg costs many times what it costs in Bulgaria, and saying so tells you nothing about whether either market is stretched.
The EU figure is 98.9, essentially at its own norm.
The stretched markets
Portugal records 122.9, the highest in the Union. Luxembourg records 118.6, Austria 115.2 and Czechia 112.1.
Portugal's position is the one with the clearest external cause. Portuguese house prices have risen sharply over the past decade, driven substantially by foreign purchasers and short-term letting in Lisbon and Porto, while Portuguese incomes have grown far more slowly. The ratio measures exactly that divergence.
Portugal also records among the lowest wages in western Europe and an in-work poverty rate above the EU figure, which is the combination that makes the housing figure politically volatile: prices set partly by external demand, incomes set domestically.
Below the norm
Romania records 48.2 — housing costs less than half the share of income it has historically. Bulgaria records 67.8.
This is not a sign of cheap housing in absolute terms so much as of incomes that have risen faster than house prices. Romanian wages have grown very rapidly, which is visible in the unit labour cost study in this category where Romania records 145.0 against a 2020 base.
When incomes rise faster than prices, affordability improves even if prices are also rising, and Romania is the clearest case of it in the Union.
Italy and Finland
Italy at 85.8 and Finland at 79.7 are the western Member States furthest below their long-run norms.
Both have had weak house price growth over an extended period. Finland recorded outright falls in the most recent year, which the companion study on house price changes reports.
For a homeowner these are losses. For a first-time buyer they are the opposite, and a single indicator cannot represent both. The ratio describes the position of someone entering the market rather than someone already in it.
What a national average hides
Every figure here is a national aggregate, and housing markets are the least national of markets. A country can be below its long-term norm overall while its capital is far above it.
That limitation is severe enough to state plainly: this indicator identifies which countries have a housing affordability problem at national scale, and it will systematically understate problems concentrated in one city.
House price-to-income ratio against long-term average, 2024
| Country | index, own long-term average = 100 | Gap to EU averagederived |
|---|---|---|
| Portugal | 122.9 | +24.0 |
| Luxembourg | 118.6 | +19.7 |
| Austria | 115.2 | +16.3 |
| European Unionaggregate | 98.9 | — |
| Finland | 79.7 | −19.2 |
| Bulgaria | 67.8dp | −31.1 |
| Romania | 48.2 | −50.7 |
Flags carried by the source on these values: dp definition differs, provisional
This table as data: CSV · JSON
Every Member State for this indicator+
Members see every Member State for this indicator here, not only the rows the ranking prints. Become a Member
Embed this chart
Paste this code into a page. The frame carries the source and the extraction date, and links back to the study.
What these figures cannot tell you
- A national average over a local market
- Housing conditions vary more within countries than between them. A national ratio near its norm is compatible with a capital city far above it, and this indicator cannot detect that.
- The benchmark is each country's own history
- Countries are compared against themselves, not against each other. A country whose housing was historically expensive relative to income scores 100 while remaining expensive, and the index says nothing about absolute affordability.
- The long-term average depends on the period
- The benchmark is the average of the same ratio from 2000 onwards, and it is not the same length everywhere: the series of the EU aggregate, Estonia and Poland begin in 2005 and those of Romania and Slovakia in 2002, so each of those is measured against a shorter history than the rest. Where the period contains an unusual boom or slump, the norm it produces is shifted accordingly — and for a Member State whose economy has changed beyond recognition since 2000, it averages two different eras, so part of the distance from 100 is a statement about the base period rather than about housing today. Bulgaria's two most recent values, the one shown here included, are flagged by Eurostat as reported on a definition that differs from the series they are indexed against.
- Income is broader than wages
- The ratio uses adjusted household gross disposable income per head of population: income after tax and cash benefits, with services provided in kind by the state counted in. It moves with employment, with transfers and with population as well as with pay, so a change in the ratio can come from either side of it.
Frequently asked questions
- Which EU country has the least affordable housing?
- Measured against each country's own long-term norm, Portugal, at 122.9 where 100 is its historical average. Luxembourg at 118.6 and Austria at 115.2 follow. This is a measure of how stretched a market is relative to its own history, not of absolute price.
- Where has housing become more affordable?
- Romania, at 48.2 against its own long-term average — housing takes less than half the share of income it historically has. Bulgaria at 67.8 follows. In both, incomes have risen faster than house prices.
- Why compare each country to itself rather than to others?
- Because absolute prices differ so much between Member States that a direct comparison says nothing about affordability. Housing in Luxembourg costs many times what it costs in Bulgaria, and that fact alone does not indicate whether either market is stretched.
- Does this account for capital cities?
- No, and that is its main weakness. Every figure is a national aggregate, so a country can sit near its long-term norm overall while its capital is far above it. The indicator systematically understates problems concentrated in one city.
Methodological note
Eurostat publishes a standardised house price-to-income ratio: the current price-to-income ratio relative to the average of that same ratio over the period from 2000 to the most recent year available, where 100 means the two are equal. Income is adjusted household gross disposable income per head of population. Both definitions are the source's own and are recorded in the archived extraction alongside the values. The source also states that series lengths vary by country; the archived extraction carries every year each series holds, which is where the benchmark period behind any one value can be checked.
Values are for 2024, the most recent year with complete coverage of the 27 Member States at the extraction date.
The characterisation of the EU aggregate as concealing a 75-point range, and the comparisons with unit labour costs and house price changes, are derived by Silver Data Lab from the published values and the companion studies on this site.
Source data
The underlying series can be inspected and re-downloaded from the Eurostat data browser. The filters below are the ones applied.
Standardised house price-to-income ratio
tipsho60
- Filters applied:
- freq=A · unit=PTIR_LT_AVG
- Extracted:
- 2026-10-09
- Source last updated:
- 2026-04-16
Download the data
The data the study you have just read is built on, exactly as it was downloaded and archived.
Yours as a Member.
Data downloadable by Members
How to cite
Record the vintage as well as the study: the figures on this page are the ones extracted on the dates below.
Silver Data Lab Research Desk (2026). Portugal's Homes Are Harder to Afford Than Usual by the EU's Widest Margin. Silver Data Lab, published 19 April 2026, last updated 11 October 2026. https://www.silverdatalab.com/studies/house-price-to-income-ratio-in-the-eu
- Data: Eurostat, Standardised house price-to-income ratio (tipsho60), filters freq=A, unit=PTIR_LT_AVG; extracted 2026-10-09; source last updated 2026-04-16. https://doi.org/10.2908/tipsho60
Silver Data Lab's analysis is licensed CC BY 4.0. The statistics remain their publisher's and keep its terms of reuse.
Ask the research desk
A question about this study — a definition, a filter, a break in the series, what the figures can and cannot support — answered by the desk that made the extraction.
Members can write to the research desk
Studies where the same country leads or trails
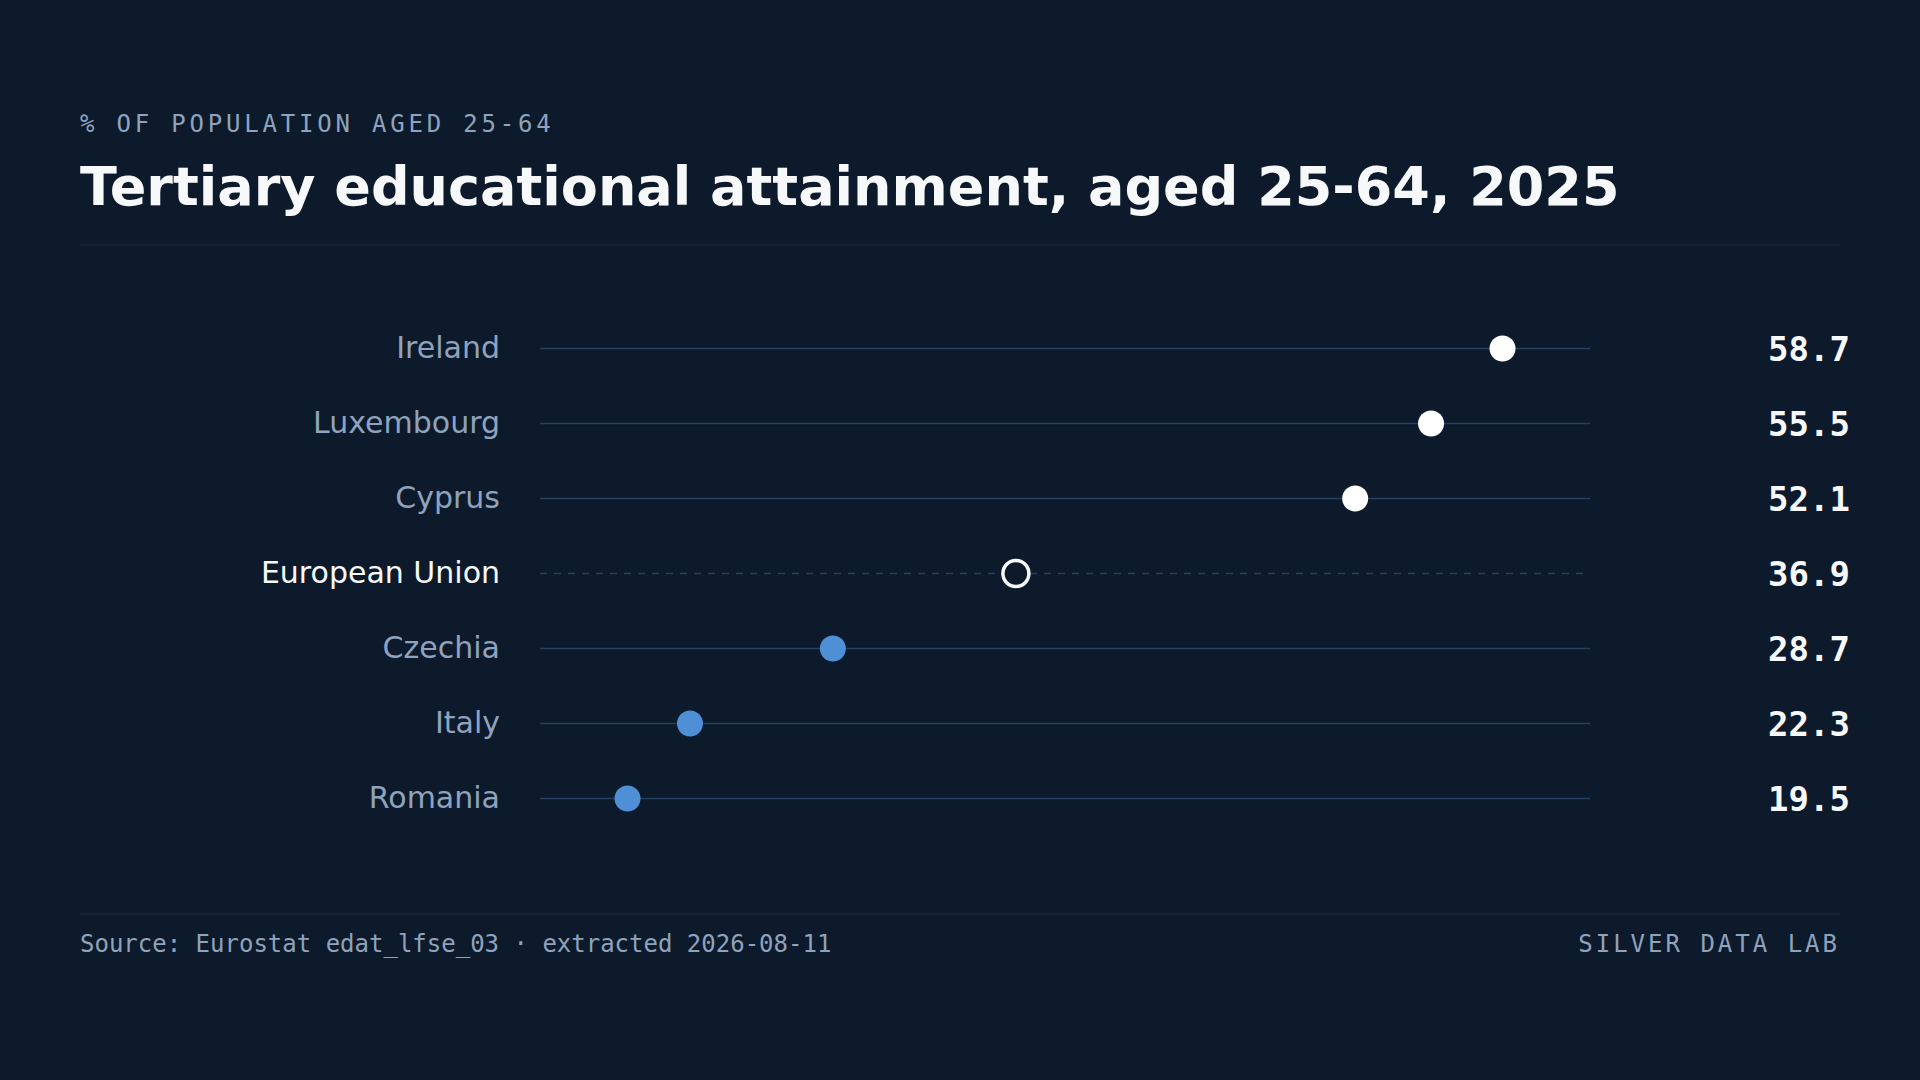
A Degree Is Three Times as Common Among Adults in Ireland as in Romania
36.9% of people aged 25 to 64 in the EU held a tertiary qualification in 2025.
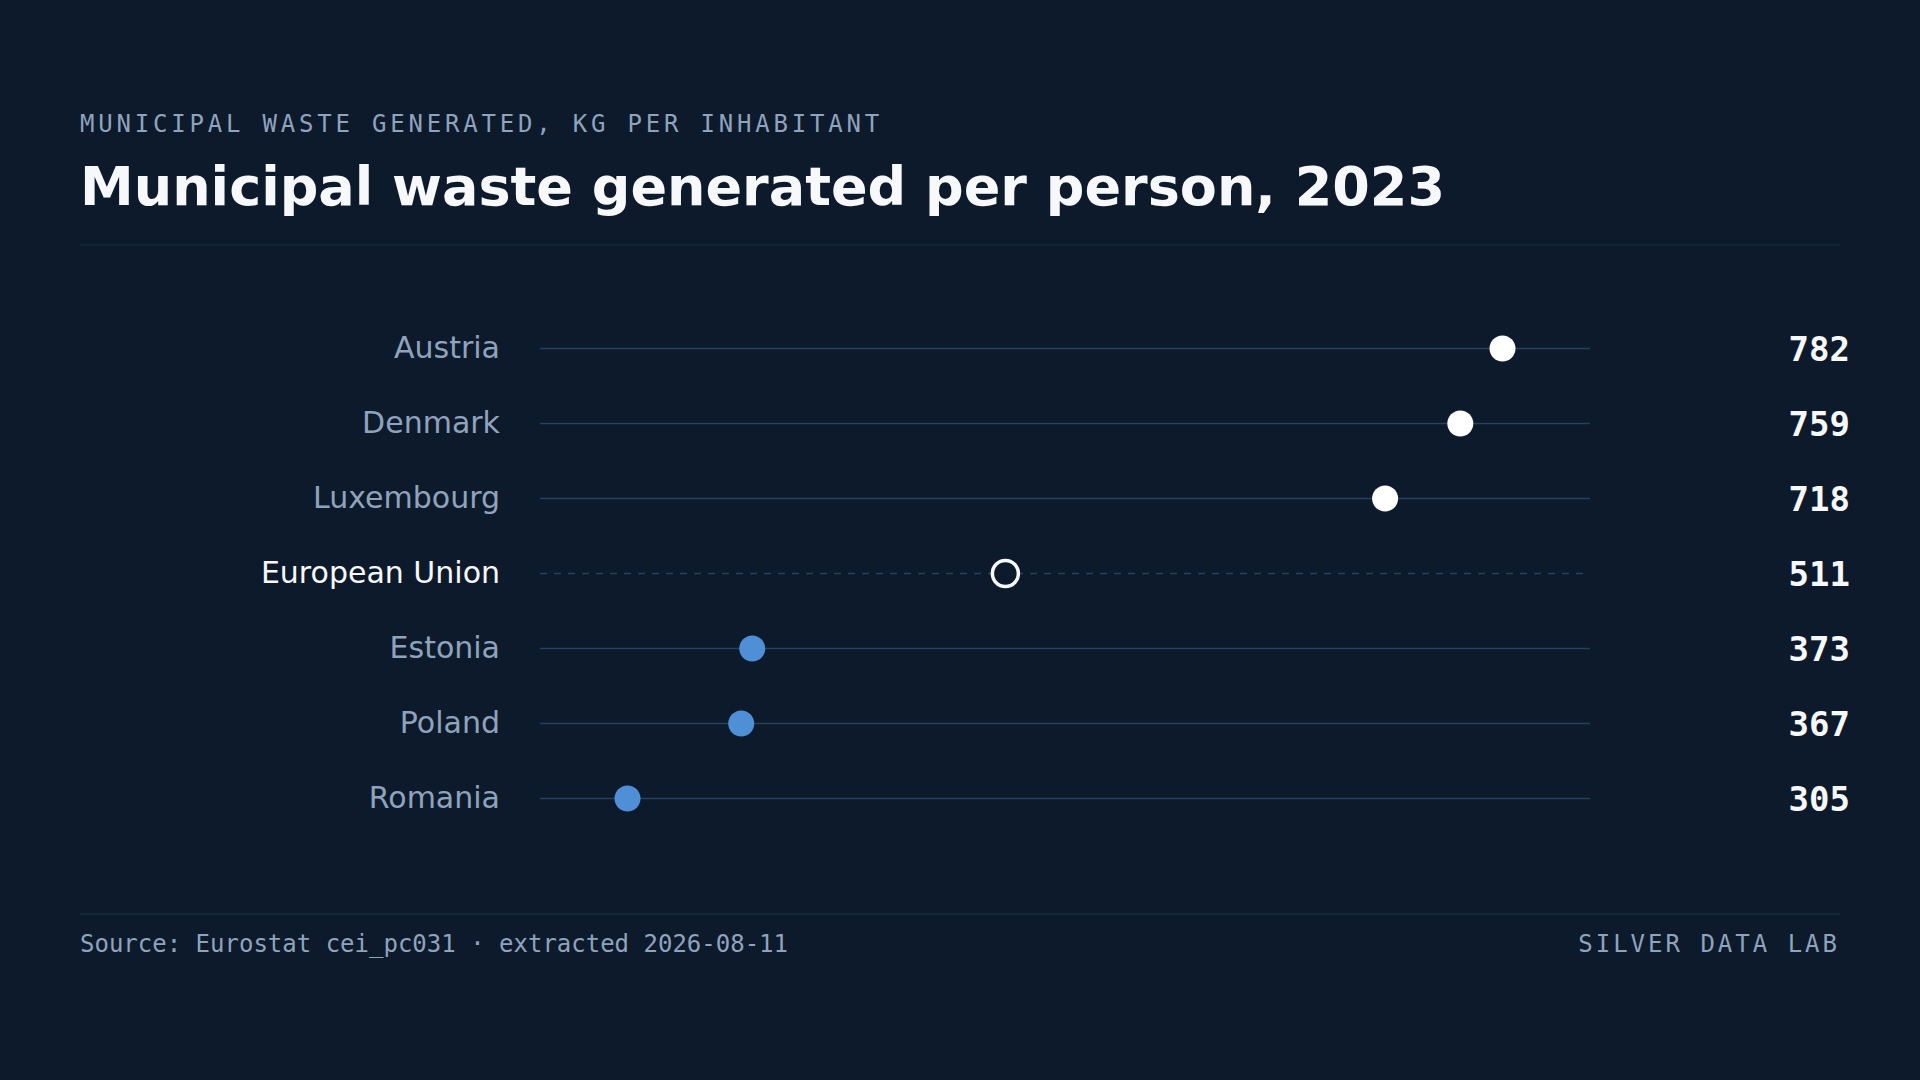
Austria Produces More Rubbish per Person Than Any Other EU Country
The EU generated 510 kg of municipal waste per inhabitant in 2023 — about 1.4 kg per person per day.
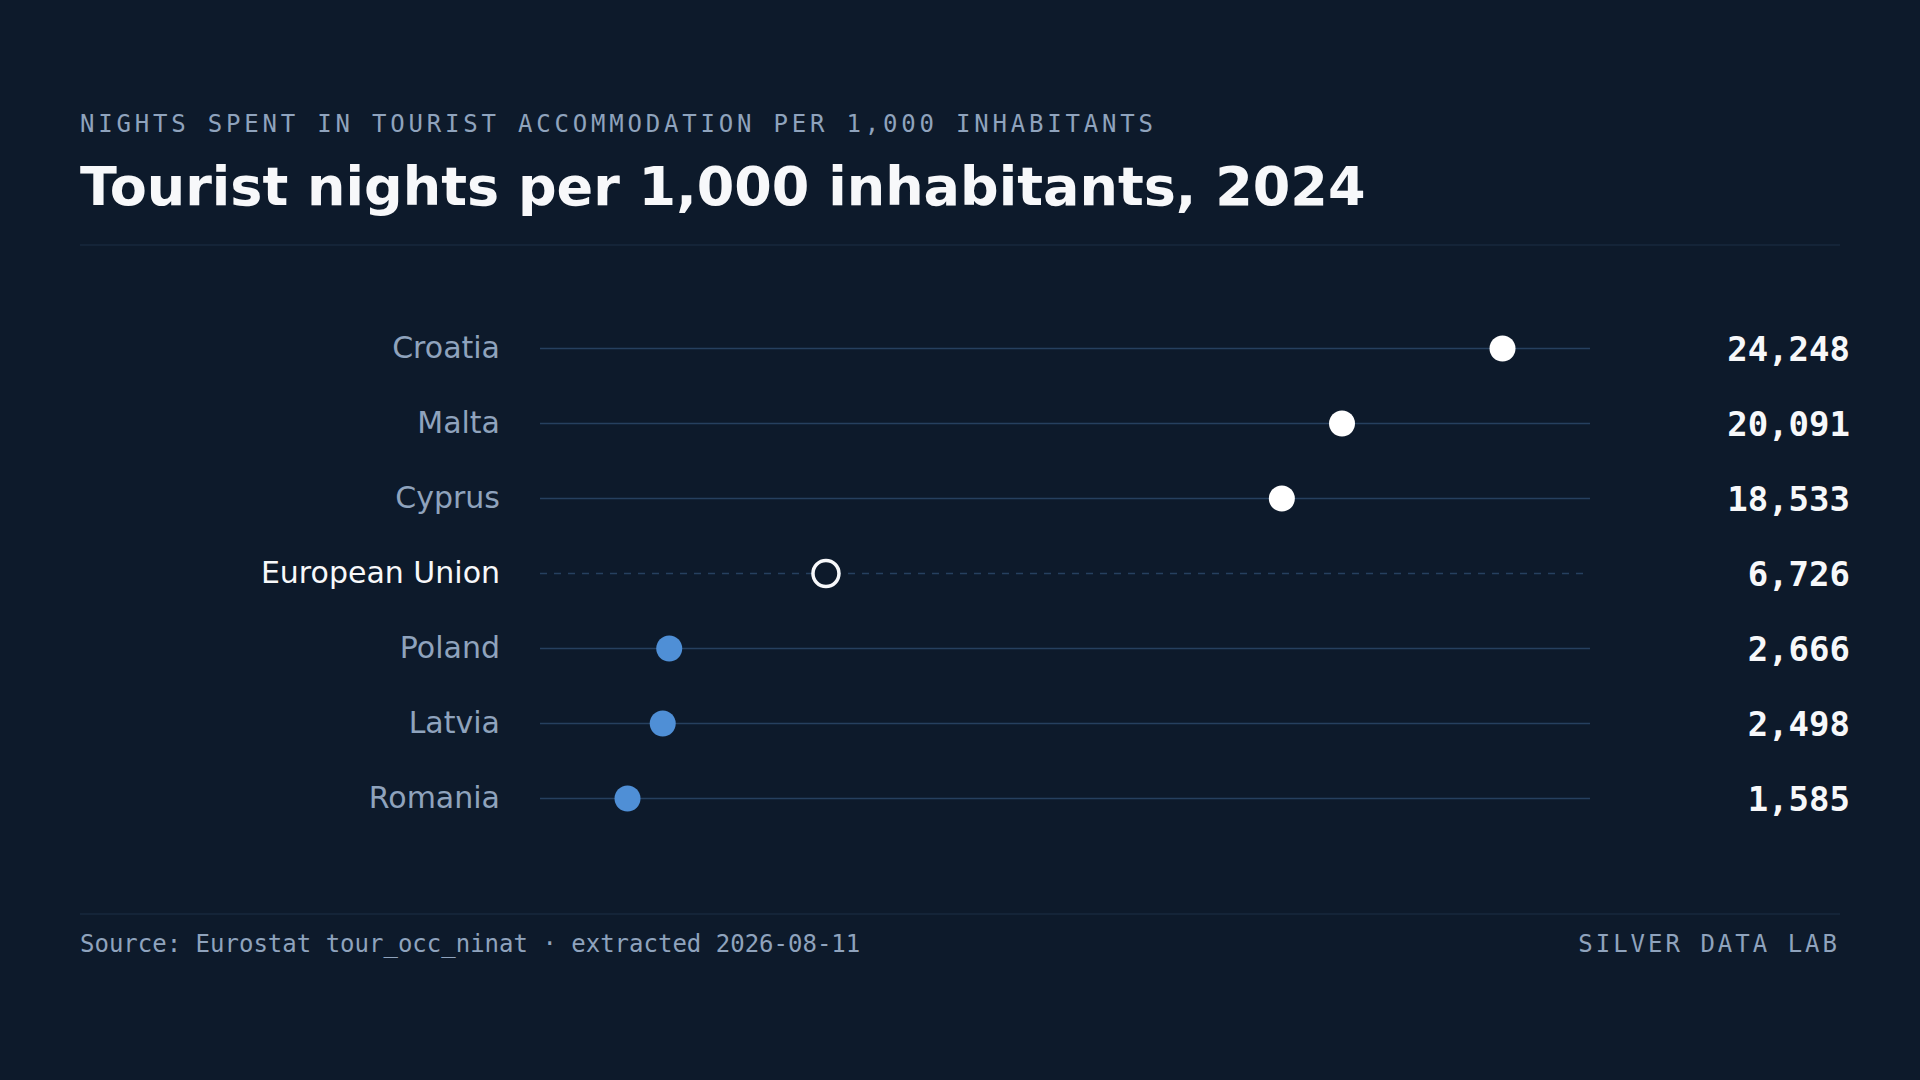
For Its Population, Croatia Has the Most Tourist Overnight Stays in the EU
The EU recorded 6,978 tourist nights per 1,000 inhabitants in 2025, about 7.0 nights per resident.