In One Year, House Prices Rose 18.3% in Hungary and Fell in Finland
Silver Data Lab Research Desk · Statistical analysis · Published on 05 July 2026
- Data source
- Eurostat
- Reference period
- 2025
- Last updated
- 11 October 2026
Re-checked against the source on 02 October 2026. 1 values in its datasets moved between snapshots; none is a figure stated on this page. Every revision we have observed →
Key estimates
- House prices across the EU rose 5.5% on annual average in 2025.
- Hungary recorded 18.3% and Portugal 17.6% — more than three times the EU rate.
- Finland recorded −2.3%, the only Member State where house prices fell — and the third consecutive year they have.
- France at 0.7% and Sweden at 1.0% were nearly flat.
- The spread between the fastest and slowest Member State was 20.6 percentage points in a single year.
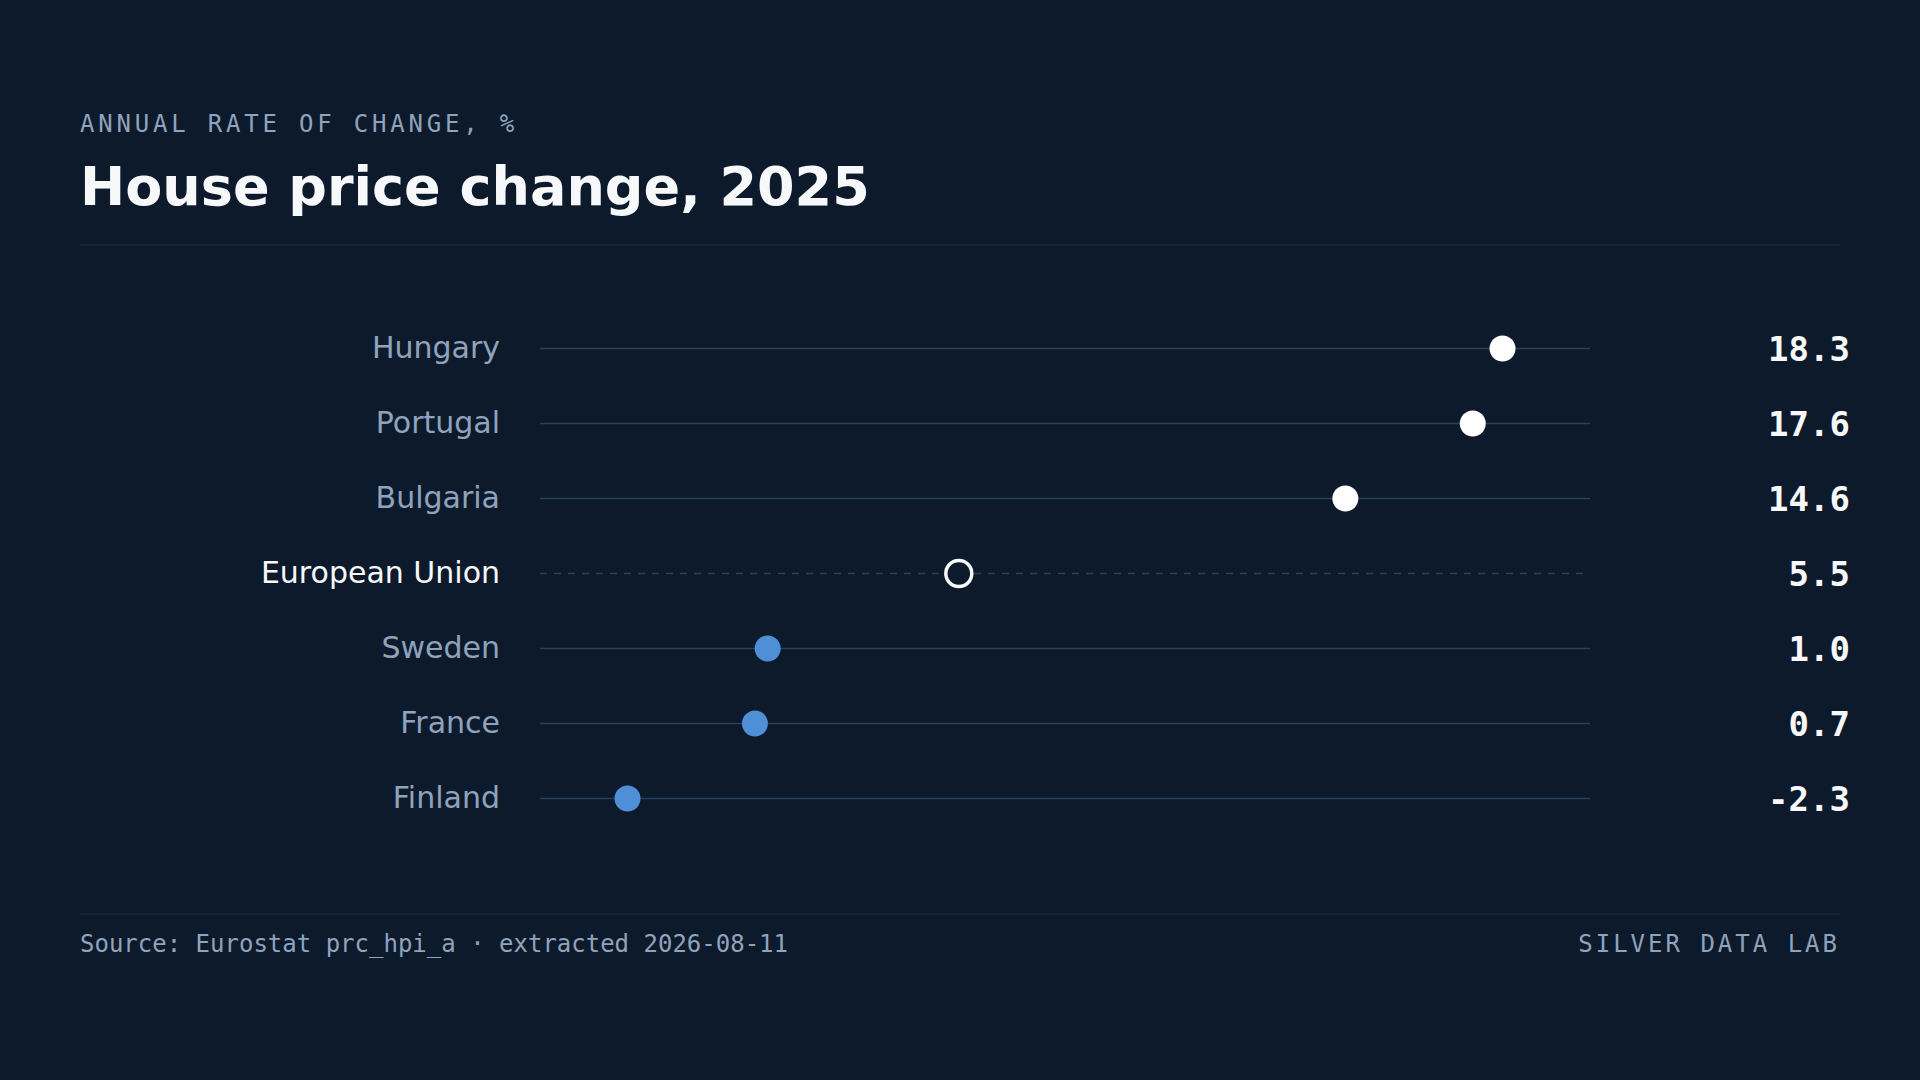
One year, twenty points of difference
House price inflation is not a European phenomenon with national variations. In 2025 it was a set of national phenomena that happen to share a currency in most cases.
Across the EU, house prices rose 5.5% on annual average. Behind that figure Hungary recorded 18.3% and Finland −2.3%, a spread of 20.6 percentage points inside a single year.
Where housing got much more expensive
Hungary leads at 18.3%, followed by Portugal at 17.6%, Bulgaria at 14.6%, Croatia at 13.9% and Spain at 12.7%. Slovakia at 12.4% and Czechia at 10.4% complete the group above 10%.
Seven Member States recorded double-digit house price growth in one year. For a household not already on the housing ladder, a 15% annual increase moves the purchase price faster than almost any plausible increase in savings.
Portugal and Spain in that group are the ones with the widest external attention, and both combine strong price growth with substantial international demand for housing. This dataset records the prices and contains nothing about who is buying, so this study does not attribute the increases.
Where prices stalled or fell
Finland recorded −2.3%, the only Member State where house prices fell over the year, and the third year running that they have. The annual series has Finland at −6.2% in 2023 and −3.1% in 2024 before this year's −2.3%: a fall that is narrowing each year without stopping.
That run is what distinguishes it. Germany, Luxembourg, Sweden and France all recorded a fall in 2023 or 2024 and have since returned to growth, so Finland is not alone in having had a bad year — it is alone in still having one.
France recorded 0.7%, Sweden 1.0% and Luxembourg 1.6%.
Falling prices are not straightforwardly good news or bad. For a prospective buyer they improve affordability; for an existing owner they erode equity, and for a banking system with mortgage exposure they are a supervisory matter. This indicator measures the direction and says nothing about which of those effects dominates.
Why the aggregate is close to useless here
The EU figure of 5.5% describes very few Member States. Thirteen are above 7% and eight at 4% or below; the countries near the aggregate are a minority of a distribution with substantial mass at both ends.
Aggregates work when a distribution is concentrated. On this indicator, in this year, it is not, and a European average of 5.5% would misdescribe both the Hungarian and the Finnish experience by a wide margin.
House price change, 2025
| Country | Annual rate of change (%) | Gap to EU averagepercentage points, derived |
|---|---|---|
| Hungary | 18.3p | +12.8 |
| Portugal | 17.6 | +12.1 |
| Bulgaria | 14.6 | +9.1 |
| European Unionaggregate | 5.5 | — |
| Sweden | 1.0 | −4.5 |
| France | 0.7 | −4.8 |
| Finland | -2.3 | −7.8 |
Flags carried by the source on these values: p provisional
This table as data: CSV · JSON
Every Member State for this indicator+
Members see every Member State for this indicator here, not only the rows the ranking prints. Become a Member
Embed this chart
Paste this code into a page. The frame carries the source and the extraction date, and links back to the study.
What these figures cannot tell you
- A rate of change, not a level
- This measures how prices moved in one year, not how expensive housing is. A country with high growth can remain cheap in absolute terms, and one with falling prices can remain unaffordable.
- Nominal, not adjusted for inflation
- The index is not deflated. In a year when consumer prices rose 2.5% across the EU, a nominal increase of 2.5% is no real increase at all, and the national comparison mixes countries with very different inflation rates.
- Quality adjustment is imperfect
- House price indices attempt to control for changes in the mix and quality of properties sold. Methods differ between Member States and no adjustment is complete, so comparisons between countries carry more uncertainty than the single decimal place suggests.
- National averages hide capitals
- House price movements in a capital city frequently diverge from the national figure. This indicator is national and cannot show that divergence.
Frequently asked questions
- How much did EU house prices rise in 2025?
- 5.5% on annual average across the European Union, in nominal terms. National rates ran from 18.3% in Hungary to −2.3% in Finland.
- Which EU country had the fastest house price growth?
- Hungary, at 18.3% in 2025, followed by Portugal at 17.6% and Bulgaria at 14.6%. Seven Member States recorded double-digit growth in a single year.
- Did house prices fall anywhere in the EU?
- In one Member State. Finland recorded −2.3% in 2025, its third consecutive annual fall after −6.2% in 2023 and −3.1% in 2024. France at 0.7% and Sweden at 1.0% were close to flat but still positive, and no other Member State is still falling.
- Are these figures adjusted for inflation?
- No. The index is nominal. With EU consumer price inflation at 2.5% in the same year, a nominal increase below that represents a real fall in house prices.
Methodological note
The house price index is published by Eurostat as the annual average rate of change in prices of all residential property purchased by households, both newly built and existing.
Values are for 2025, covering the 26 Member States present in the series at the extraction date; Greece is absent from it, so every count in this study is out of 26. The rate is nominal: it is not adjusted for consumer price inflation, which averaged 2.5% across the EU in the same year according to the companion inflation study on this site.
The same table is extracted a second time across every year it covers, and that extraction is the source of the Finnish rates for 2023 and 2024 and of the statement that no other Member State is still in a falling run.
The spread of 20.6 percentage points and the counts of Member States above 7% and at 4% or below are derived by Silver Data Lab from the published rates. The lower boundary is stated inclusively because Italy sits exactly on 4.0.
Source data
This study draws on 2 datasets from Eurostat. Each can be inspected and re-downloaded from its catalogue, and the filters below are the ones applied.
House price index — annual data
prc_hpi_a
- Filters applied:
- freq=A · purchase=TOTAL · unit=RCH_A_AVG · time=2025
- Extracted:
- 2026-10-02
- Source last updated:
- 2026-10-01
House price index — annual data
prc_hpi_a
- Filters applied:
- freq=A · purchase=TOTAL · unit=RCH_A_AVG
- Extracted:
- 2026-10-02
- Source last updated:
- 2026-10-01
Download the data
The data the study you have just read is built on, exactly as it was downloaded and archived.
Yours as a Member.
Data downloadable by Members
How to cite
Record the vintage as well as the study: the figures on this page are the ones extracted on the dates below.
Silver Data Lab Research Desk (2026). In One Year, House Prices Rose 18.3% in Hungary and Fell in Finland. Silver Data Lab, published 05 July 2026, last updated 11 October 2026. https://www.silverdatalab.com/studies/house-prices-in-the-eu
- Data: Eurostat, House price index — annual data (prc_hpi_a), filters freq=A, purchase=TOTAL, unit=RCH_A_AVG, time=2025; extracted 2026-10-02; source last updated 2026-10-01. https://doi.org/10.2908/prc_hpi_a
- Data: Eurostat, House price index — annual data (prc_hpi_a), filters freq=A, purchase=TOTAL, unit=RCH_A_AVG; extracted 2026-10-02; source last updated 2026-10-01. https://doi.org/10.2908/prc_hpi_a
Silver Data Lab's analysis is licensed CC BY 4.0. The statistics remain their publisher's and keep its terms of reuse.
Ask the research desk
A question about this study — a definition, a filter, a break in the series, what the figures can and cannot support — answered by the desk that made the extraction.
Members can write to the research desk
Studies where the same country leads or trails
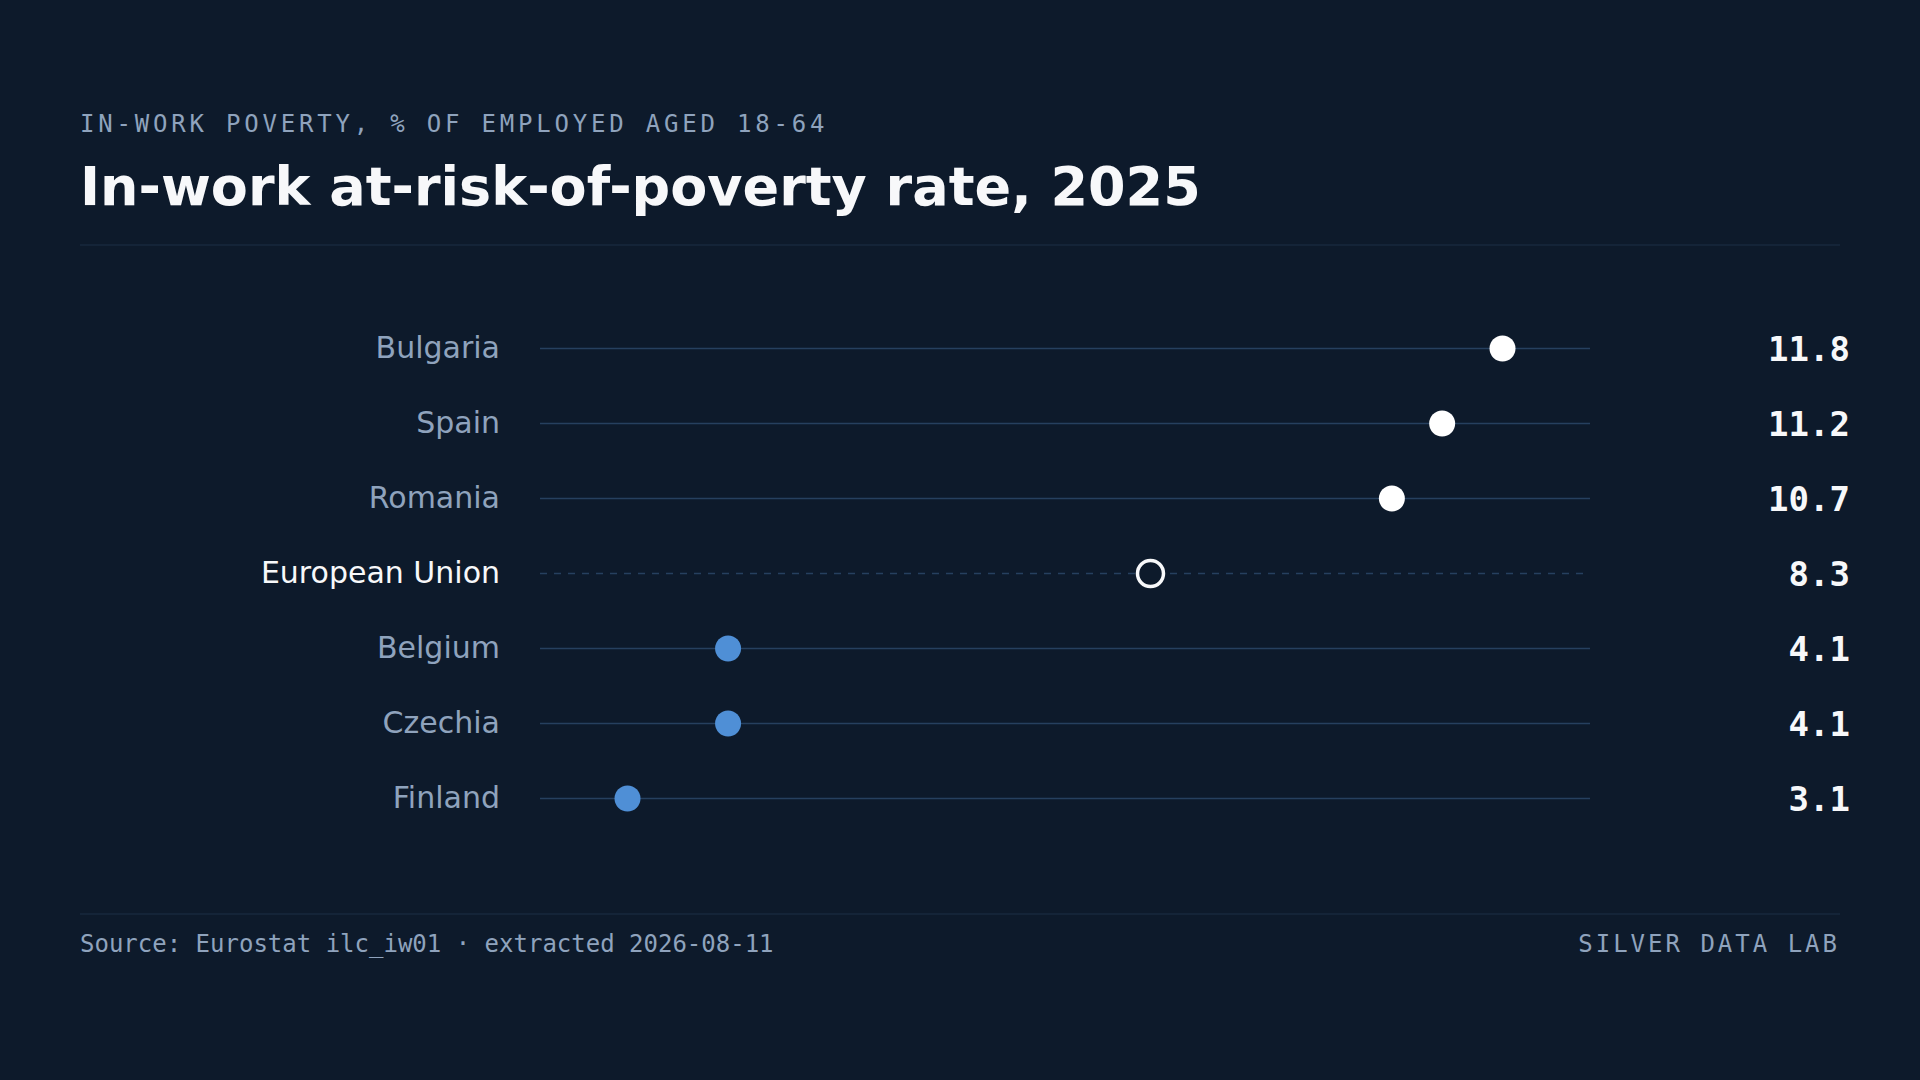
11.8% of Bulgarians With a Job Are Poor, the Highest Share in the EU
8.3% of employed people aged 18 to 64 in the EU lived below the at-risk-of-poverty line in 2025.
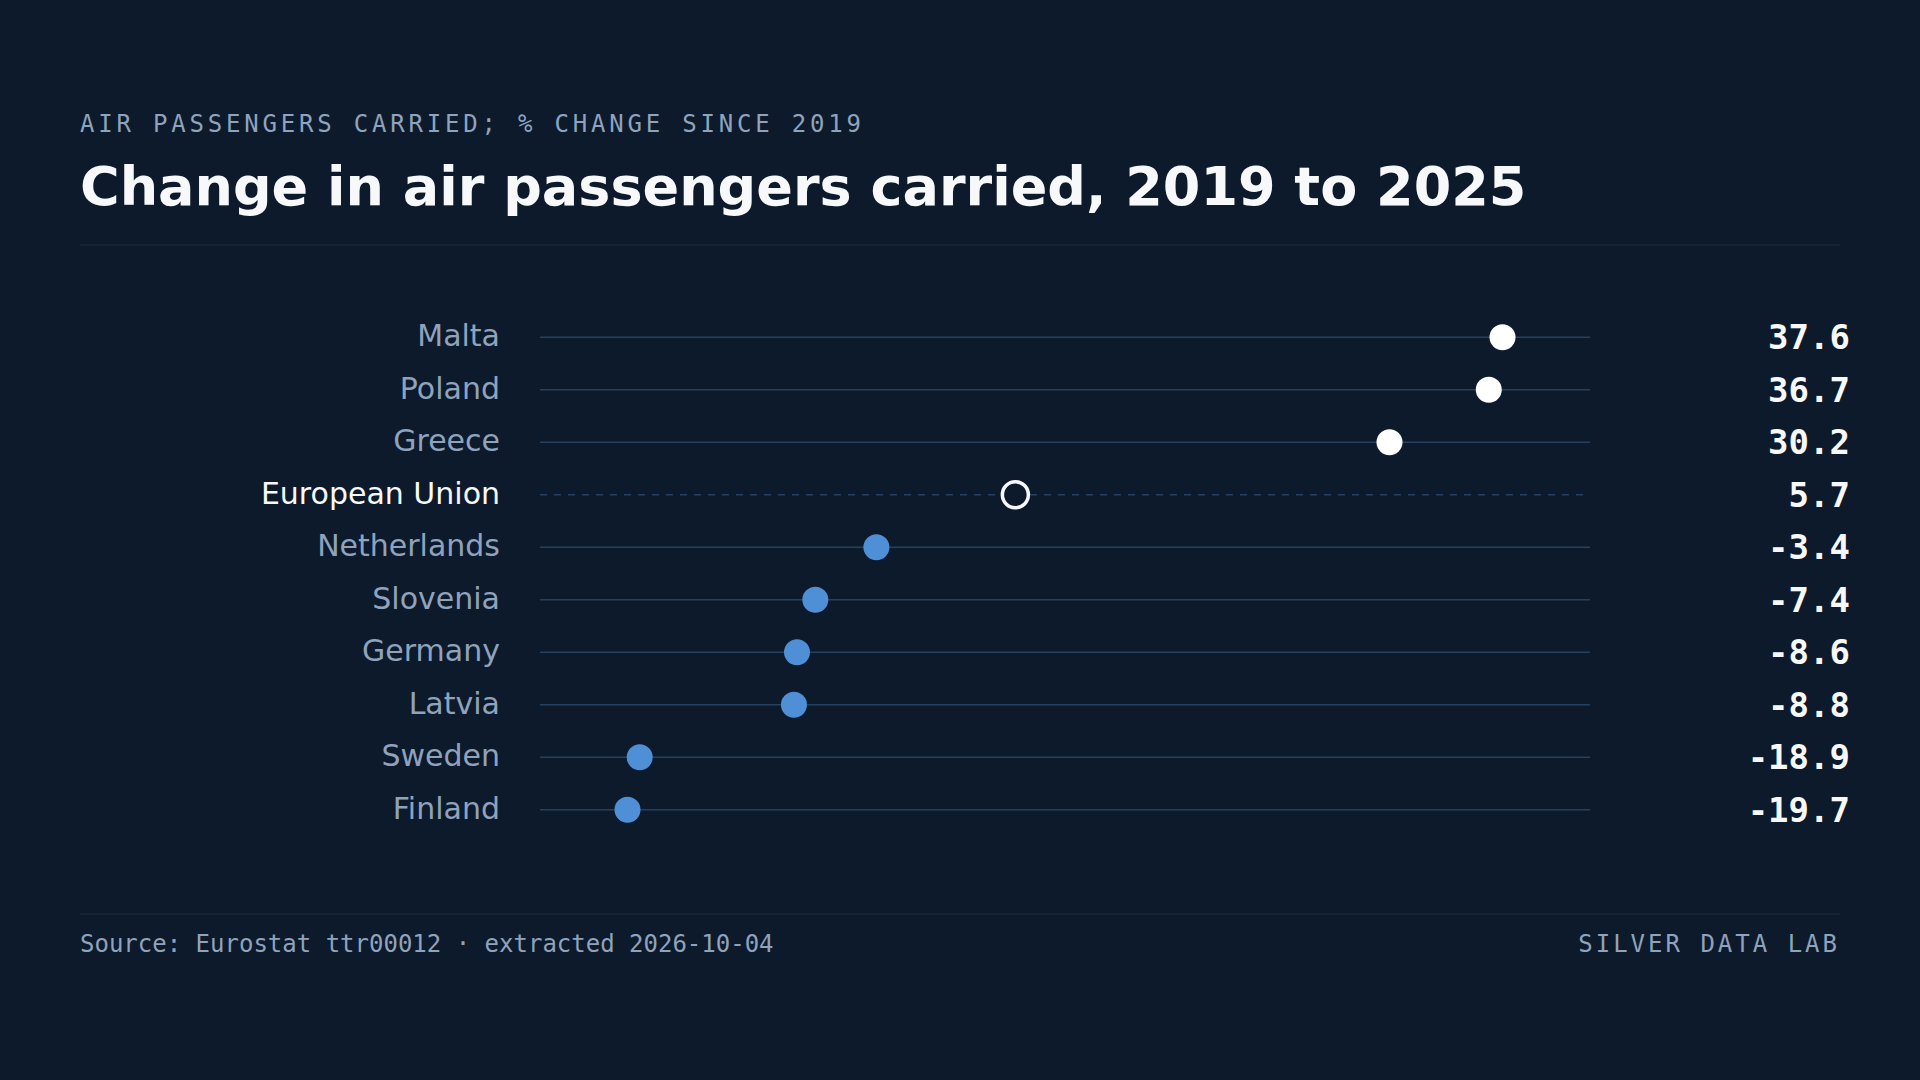
Air Travel in the EU Is Back Above Its Pre-Pandemic Level
Air passengers carried in the EU reached 1,093.6 million in 2025, 5.7% more than in 2019; the total first passed its 2019 level in 2024, by 0.7%.
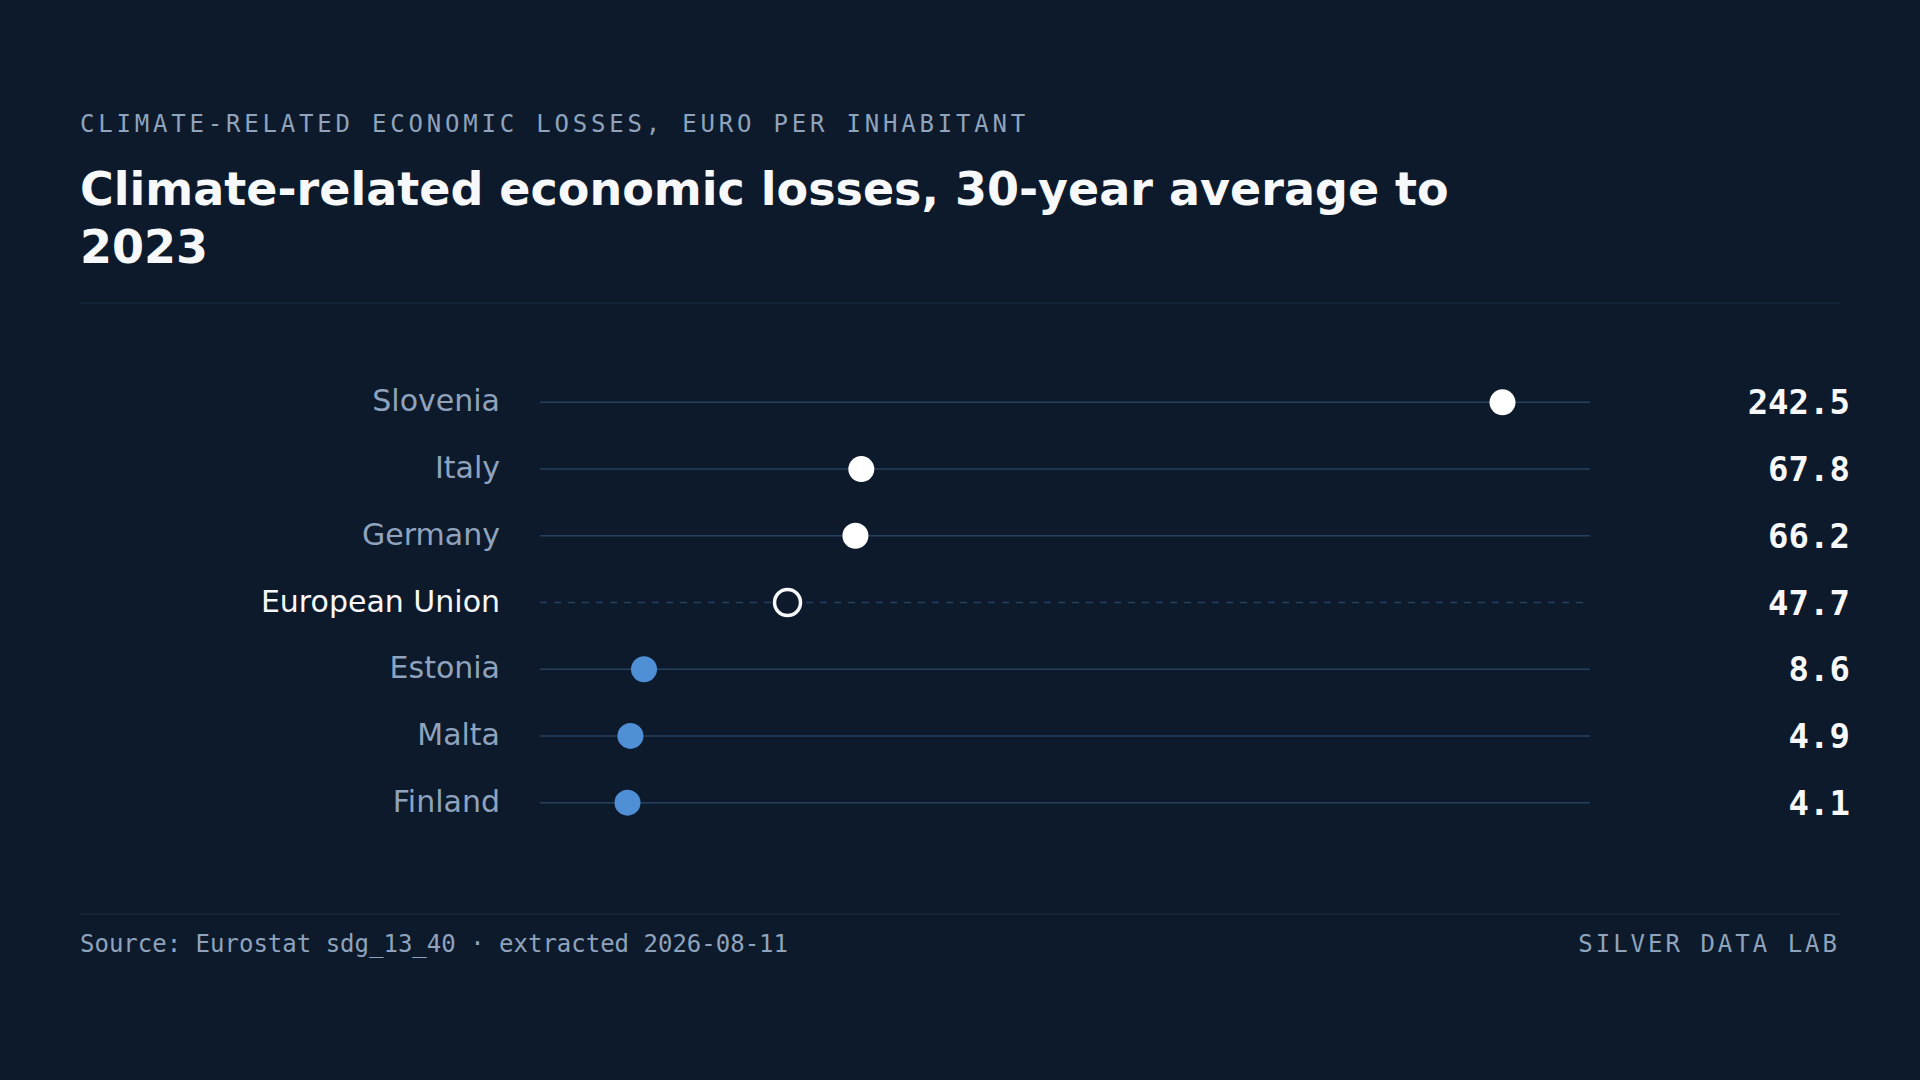
Extreme Weather Costs Slovenia Five Times the EU Average per Person
Climate-related disasters cost the EU 47.7 euro per inhabitant a year, averaged over the thirty years to 2023.