One in Twenty European Workers Is an ICT Specialist
Silver Data Lab Research Desk · Statistical analysis · Published on 20 April 2026
- Data source
- Eurostat
- Reference period
- 2025
- Last updated
- 20 April 2026
Re-checked against the source on 11 August 2026. No value in its datasets has moved between the snapshots we hold. Every revision we have observed →
Key estimates
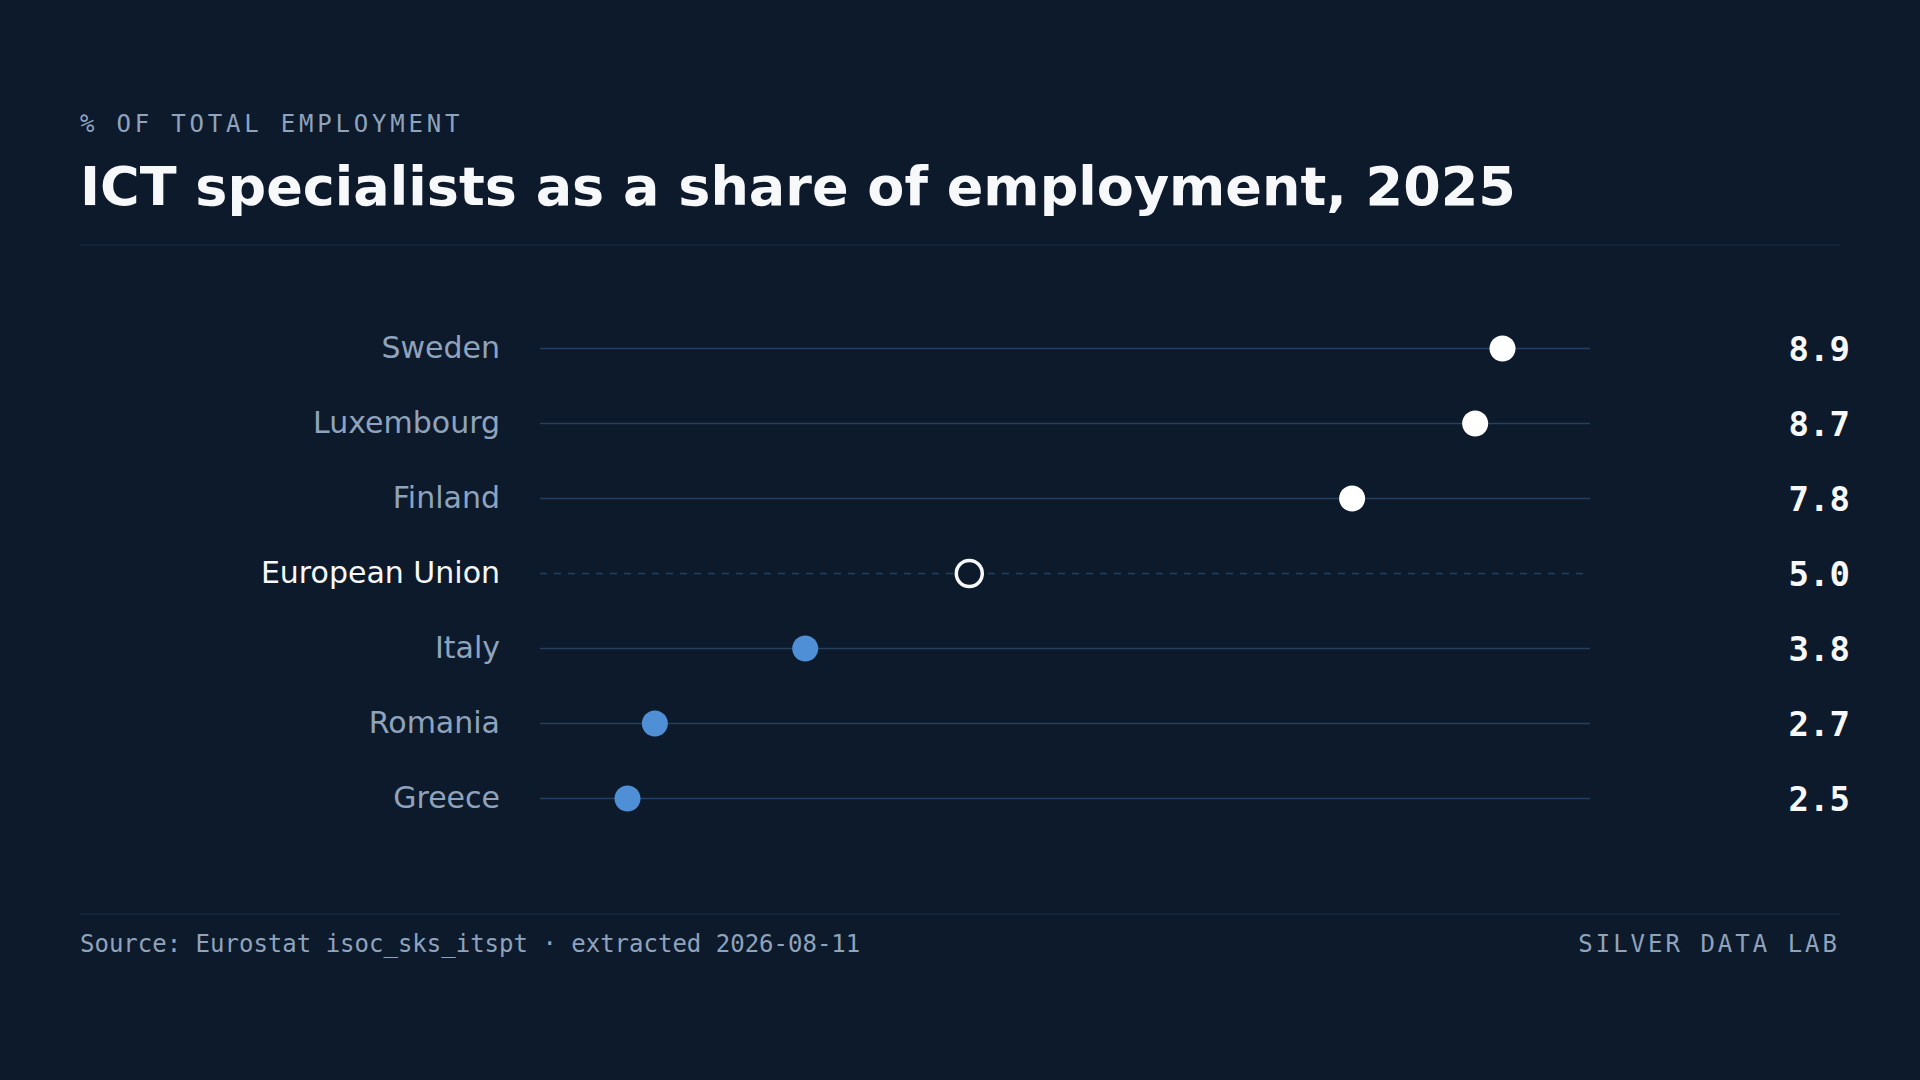
- ICT specialists made up 5.0% of employment across the EU in 2025.
- Sweden records 8.9%, Luxembourg 8.7% and Finland 7.8% — all more than half again above the EU figure.
- Greece records 2.5% and Romania 2.7%, around half the EU share.
- Bulgaria records 4.8%, close to the EU figure, while its general digital skills rate is the second lowest in the Union.
- The specialist ranking and the general skills ranking disagree, which is the finding rather than a discrepancy.
A narrow measure, and a different question
ICT specialists are workers whose job is information and communications technology: developers, systems analysts, network professionals and the occupations grouped with them. They are counted by occupation rather than by the sector employing them, so a developer inside a bank is an ICT specialist and a bank's receptionist is not.
Across the EU they were 5.0% of employment in 2025 — one worker in twenty.
This is a much narrower measure than digital skills, and it answers a different question. Digital skills describe what a population can do; specialists describe what an economy employs people to build.
Where the specialists are
Sweden records 8.9%, Luxembourg 8.7% and Finland 7.8%. The Netherlands follows at 7.2%, Estonia at 6.8% and Ireland at 6.2%.
At the other end, Greece records 2.5%, Romania 2.7% and Italy 3.8%. Slovakia at 4.4% and Latvia, Poland and Slovenia at 4.5% sit just below the Union figure.
Where the two rankings disagree
The interesting cases are the countries that appear in different places on this ranking and on digital skills.
Bulgaria records 4.8% ICT specialists, essentially the EU figure, while only 38.3% of its population has basic digital skills — the second lowest in the Union. It has a specialist workforce of roughly European size sitting on top of a general population with among the weakest digital competence.
Estonia is the reverse of the usual assumption in a different way: 6.8% specialists, fifth in the Union, on a general skills rate of 62.5% that is only two points above the EU average.
Greece is consistent across both, at 2.5% specialists and 51.0% general skills, and so is Romania at 2.7% and 31.8%.
Why the disagreement matters
A country can build an ICT industry without raising the digital competence of its population, and can raise general competence without employing many specialists. The two are produced by different things: one by an industry and an education pipeline feeding it, the other by schools, public services and everyday technology use.
Policy discussions that treat digital skills and the technology workforce as a single objective are collapsing two measures that, in several Member States, point in different directions.
ICT specialists as a share of employment, 2025
| Country | % of total employment | Gap to EU averagepercentage points, derived |
|---|---|---|
| Sweden | 8.9 | +3.9 |
| Luxembourg | 8.7 | +3.7 |
| Finland | 7.8 | +2.8 |
| European Unionaggregate | 5.0e | — |
| Italy | 3.8e | −1.2 |
| Romania | 2.7e | −2.3 |
| Greece | 2.5 | −2.5 |
Flags carried by the source on these values: e estimated
This table as data: CSV · JSON
Every Member State for this indicator+
Members see every Member State for this indicator here, not only the rows the ranking prints. Become a Member
Embed this chart
Paste this code into a page. The frame carries the source and the extraction date, and links back to the study.
What these figures cannot tell you
- Occupation-based, and occupations are self-classified
- Specialists are identified from occupational classifications in the labour force survey. The boundary between an ICT occupation and an adjacent technical one is not always applied identically across countries.
- A share of employment, not a count
- A high percentage in a small labour market is a small number of people. Sweden's 8.9% and Germany's 5.5% represent very different absolute workforces.
- Specialists are not the same as digital skills
- This measure counts people employed in ICT occupations. It says nothing about the digital competence of the wider population, which is measured separately and ranks Member States differently.
- Remote and cross-border work complicates attribution
- A specialist employed by a firm in one Member State while resident in another is recorded by residence. In small economies with substantial cross-border employment this affects the ratio.
Frequently asked questions
- What share of EU workers are ICT specialists?
- 5.0% of total employment in 2025 — one worker in twenty. National shares ranged from 8.9% in Sweden to 2.5% in Greece.
- Which EU country employs the most ICT specialists?
- Relative to its workforce, Sweden, at 8.9% in 2025, ahead of Luxembourg at 8.7% and Finland at 7.8%. These are shares, so a high figure in a small labour market represents fewer people than a lower one in a large economy.
- Is the ICT specialist ranking the same as digital skills?
- No, and the differences are informative. Bulgaria employs ICT specialists at close to the EU share while ranking second from bottom on general digital skills. A country can build a technology workforce without raising the digital competence of its population.
- Which EU country has the fewest ICT specialists?
- Greece, at 2.5% of employment in 2025, followed by Romania at 2.7% and Italy at 3.8%.
Methodological note
The indicator is Eurostat's count of employed ICT specialists as a percentage of total employment, derived from occupational classifications in the labour force survey rather than from the sector of the employing firm.
Values are for 2025, the most recent year with complete coverage of the 27 Member States at the extraction date.
The comparisons with general digital skills draw on the companion study in this category, which uses a separate extraction from a different dataset. The two are presented side by side, not combined into a single measure.
Source data
The underlying series can be inspected and re-downloaded from the Eurostat data browser. The filters below are the ones applied.
Employed ICT specialists
isoc_sks_itspt
- Filters applied:
- freq=A · unit=PC_EMP · time=2025
- Extracted:
- 2026-08-11
- Source last updated:
- 2026-04-17
Download the data
The data the study you have just read is built on, exactly as it was downloaded and archived.
Yours as a Member.
Data downloadable by Members
How to cite
Record the vintage as well as the study: the figures on this page are the ones extracted on the dates below.
Silver Data Lab Research Desk (2026). One in Twenty European Workers Is an ICT Specialist. Silver Data Lab, published 20 April 2026, last updated 20 April 2026. https://www.silverdatalab.com/studies/ict-specialists-in-the-eu
- Data: Eurostat, Employed ICT specialists (isoc_sks_itspt), filters freq=A, unit=PC_EMP, time=2025; extracted 2026-08-11; source last updated 2026-04-17. https://doi.org/10.2908/isoc_sks_itspt
Silver Data Lab's analysis is licensed CC BY 4.0. The statistics remain their publisher's and keep its terms of reuse.
Ask the research desk
A question about this study — a definition, a filter, a break in the series, what the figures can and cannot support — answered by the desk that made the extraction.
Members can write to the research desk
Studies where the same country leads or trails
In Sweden, Non-EU Citizens Are Unemployed at 3.5 Times the Rate of Swedes
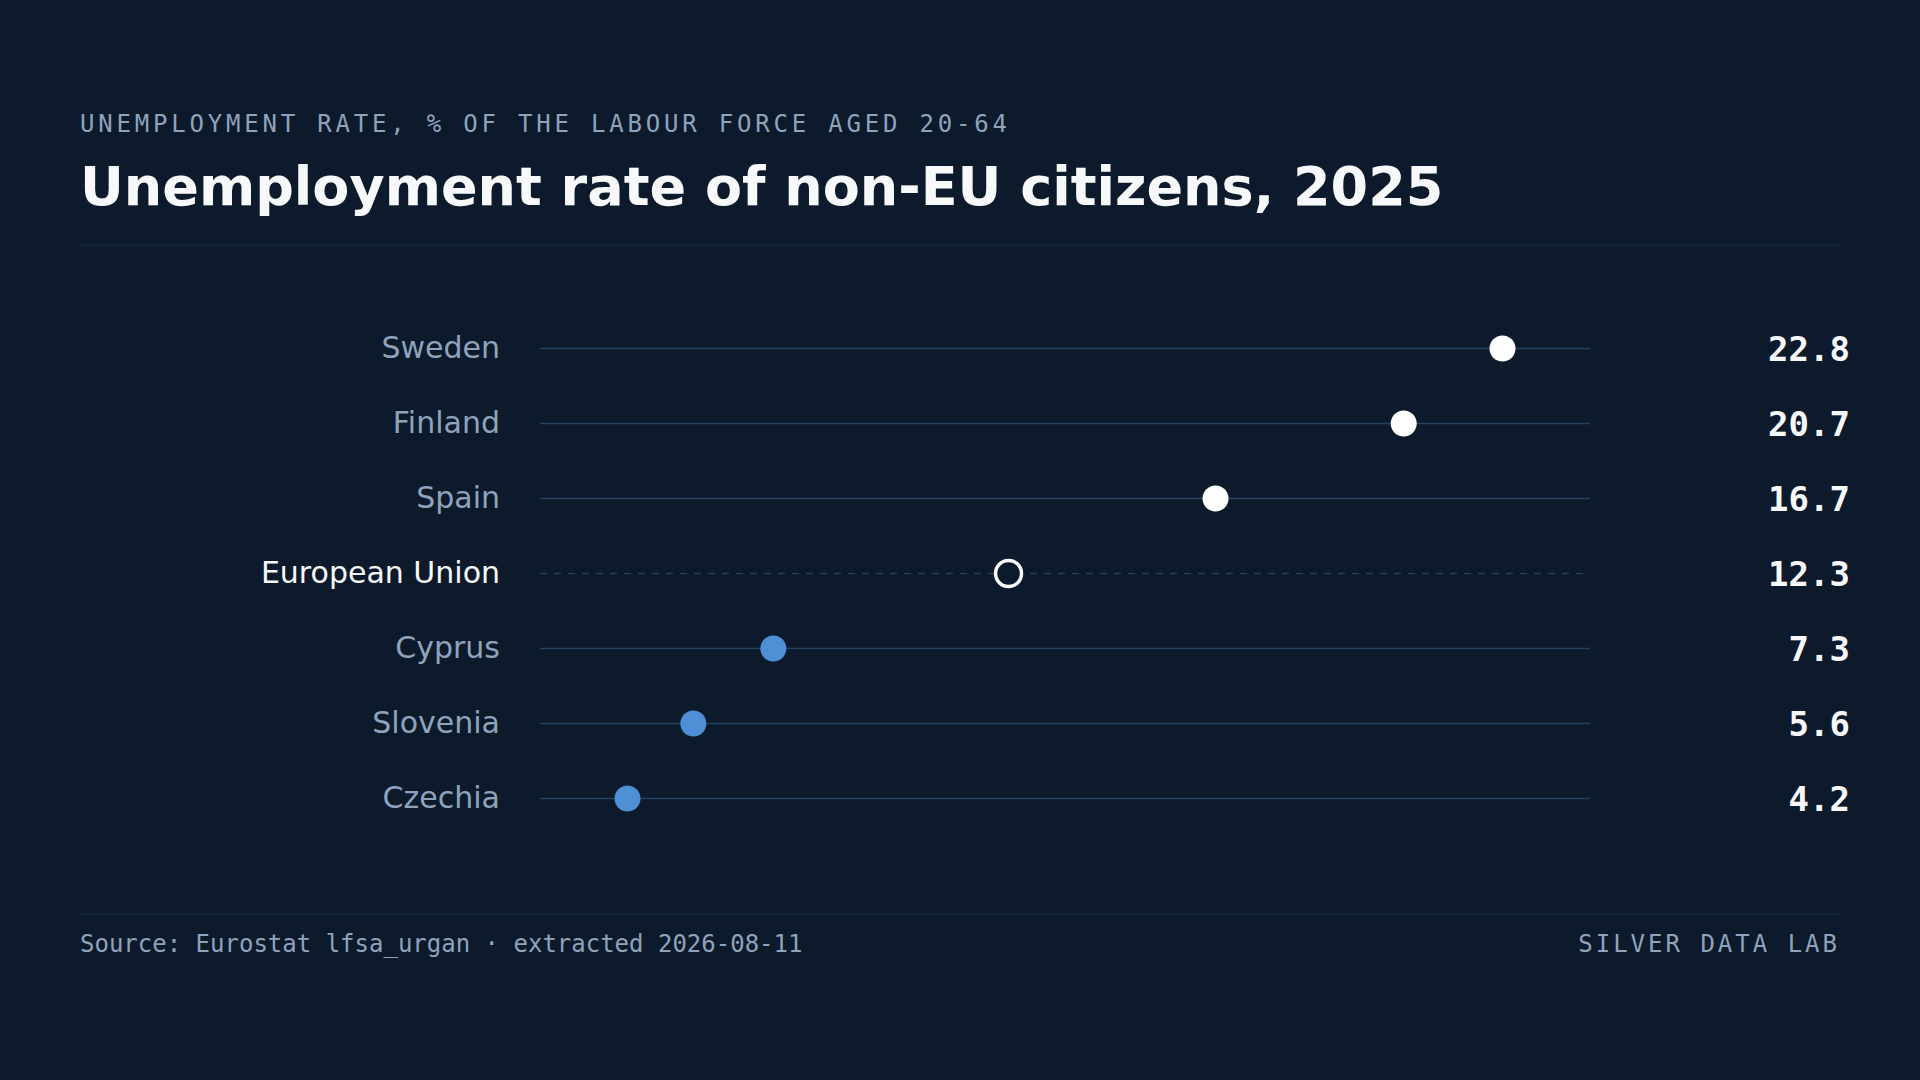
Non-EU citizens aged 20 to 64 faced 12.3% unemployment in the EU in 2025, against 5.2% for nationals.
In Two EU Countries, Households Spend More Than They Earn
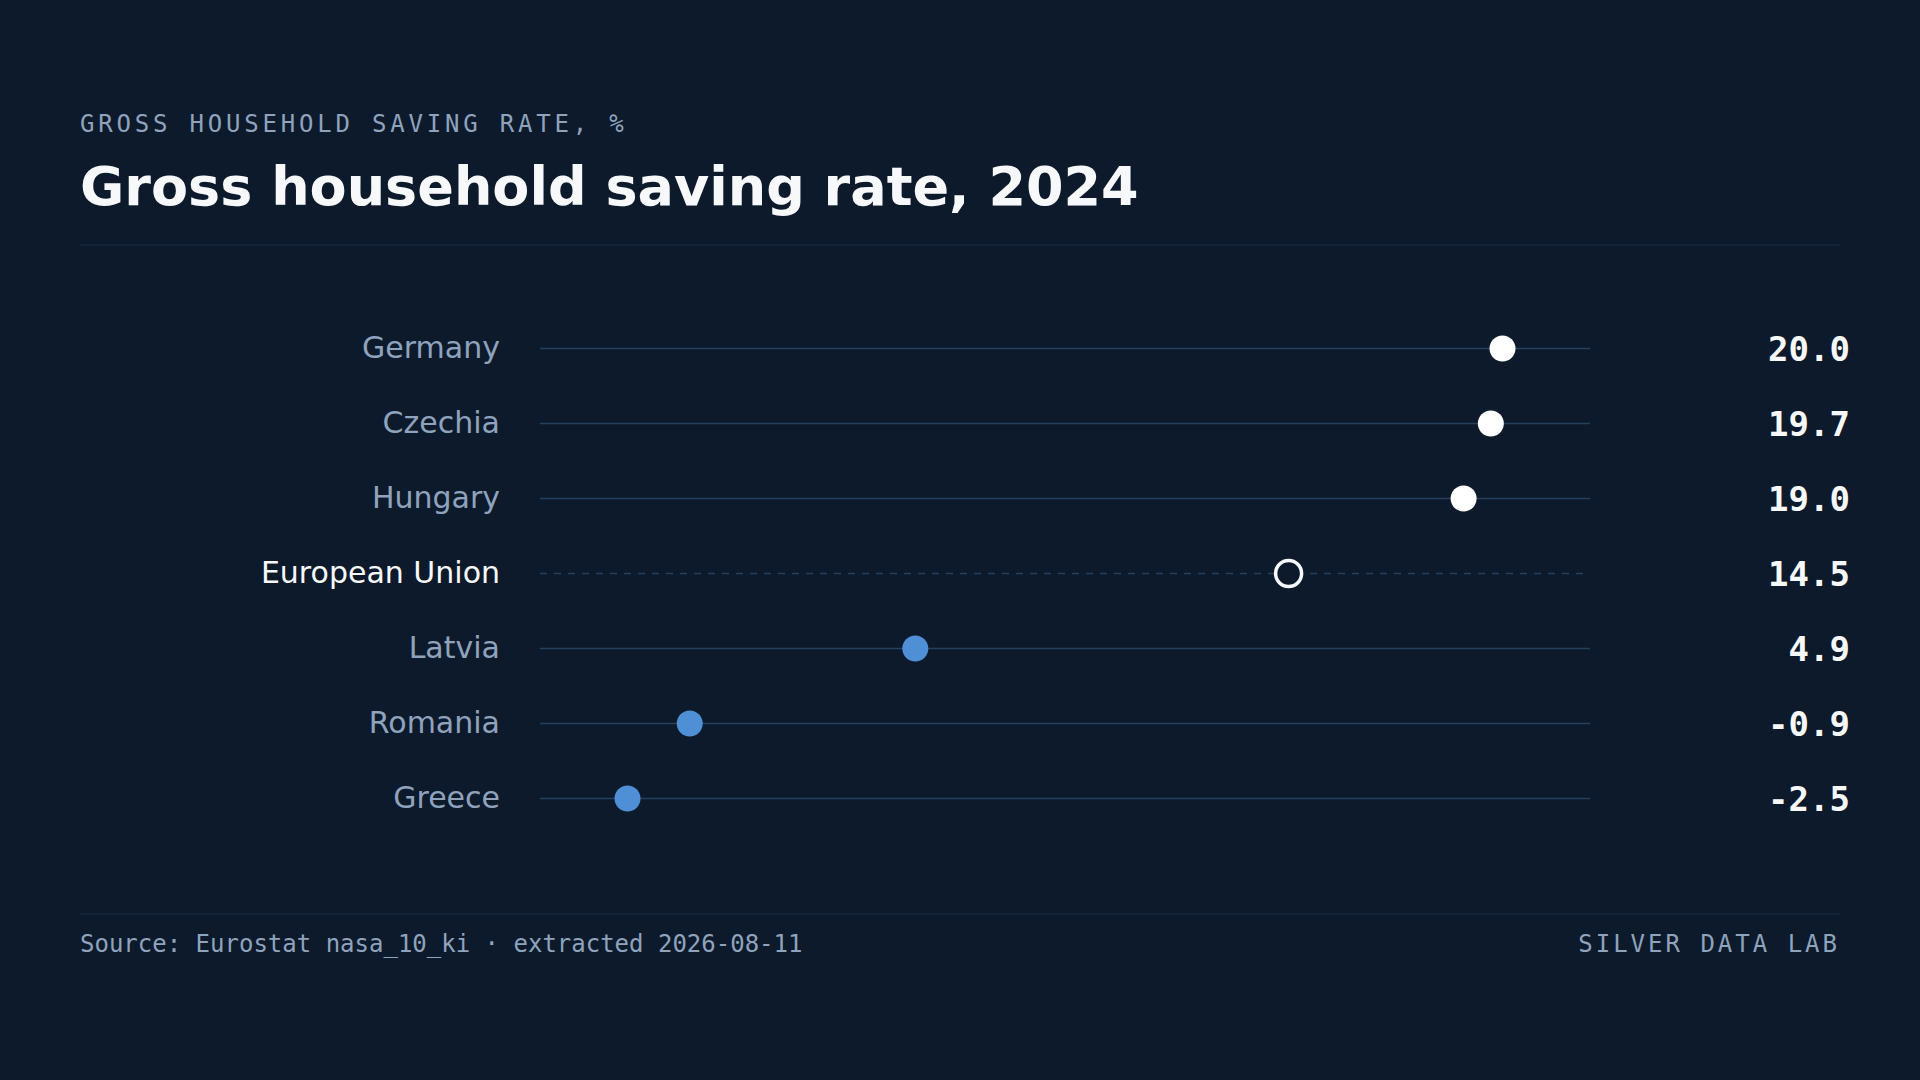
EU households saved 14.5% of their gross disposable income in 2024.
Ireland Pays Out More Income Abroad Than It Receives, a Net 28.6% of GDP
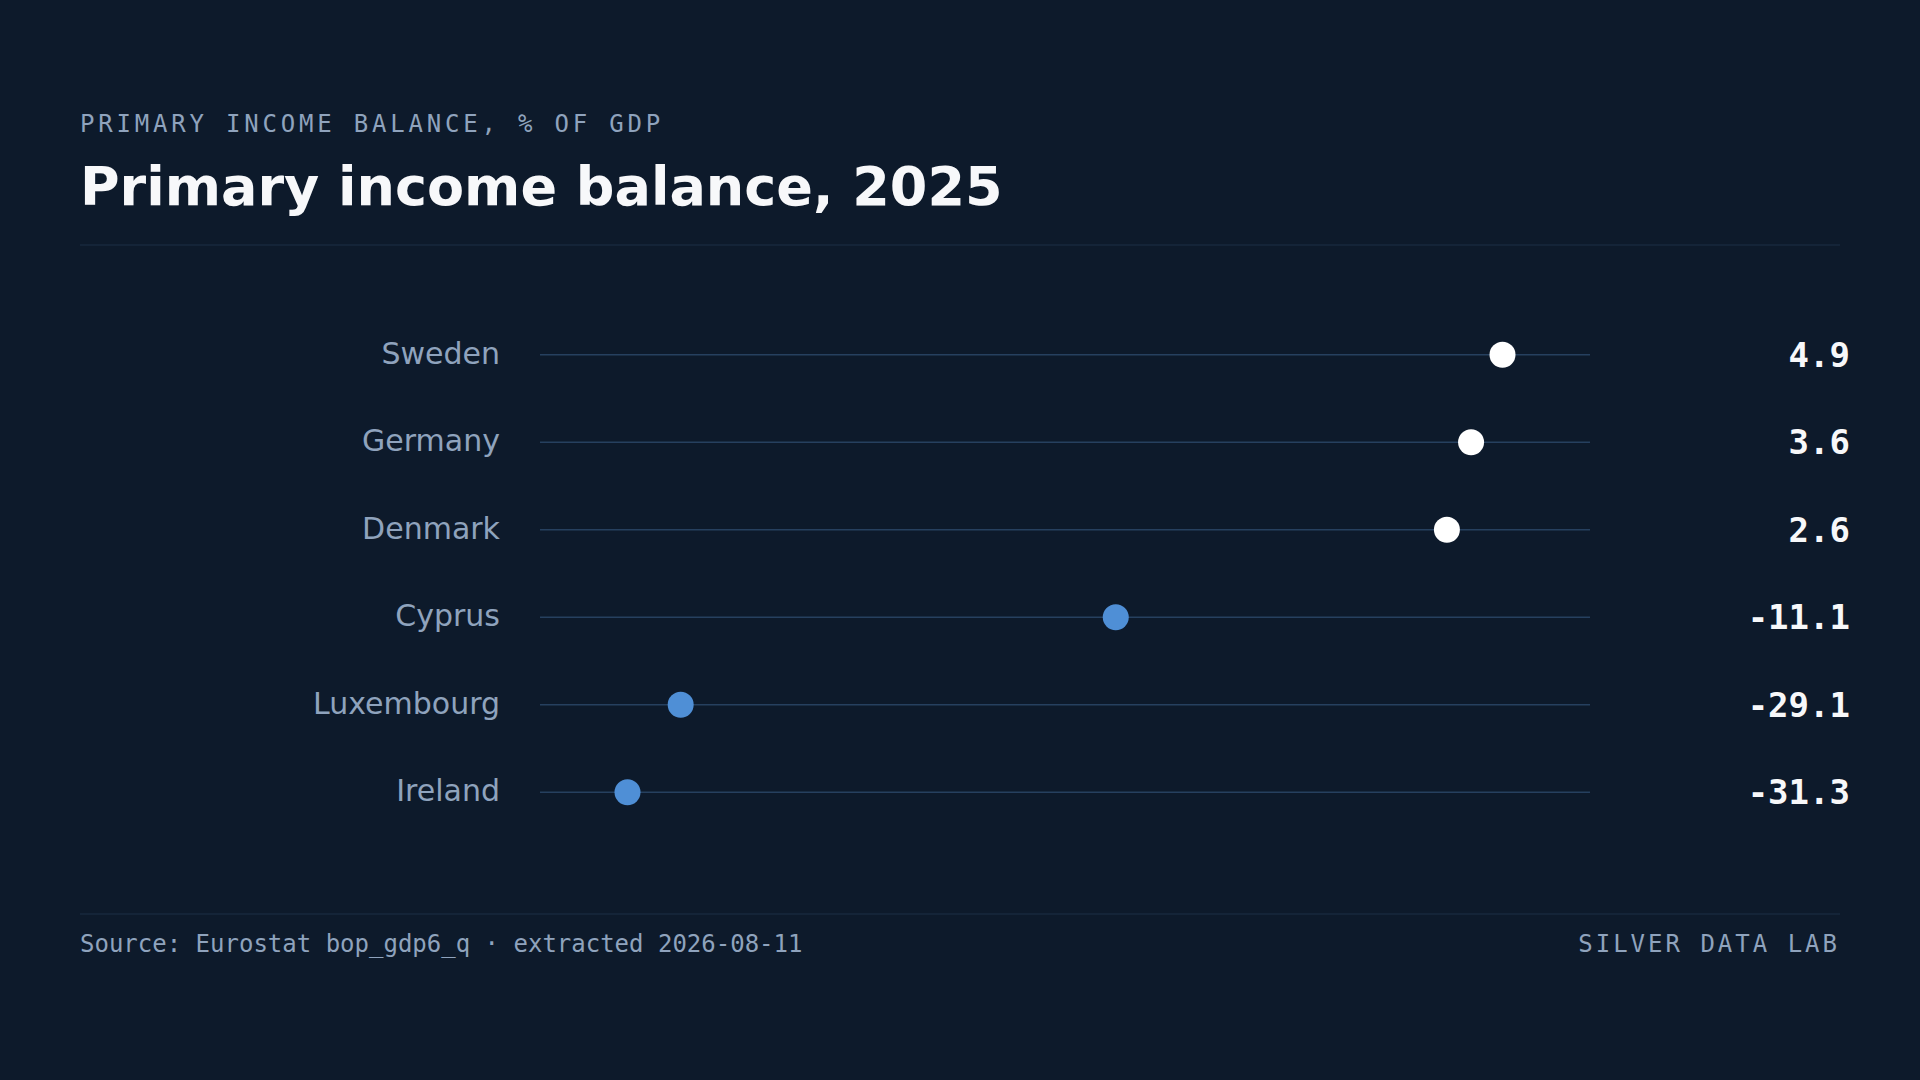
Ireland's net primary income outflow was 28.6% of GDP in 2025, second only to Luxembourg's 29.3%.