37.5% of EU Jobs Are in Sectors Where Many Workers Have a Degree
Silver Data Lab Research Desk · Statistical analysis · Published on 03 July 2026
This study is open to members only
Its sources, filters and extraction date are declared above, as they are for every study. Sign in to read the analysis in full.
- Data source
- Eurostat
- Reference period
- 2025
- Last updated
- 11 October 2026
Re-checked against the source on 11 September 2026. 1 values in its datasets moved between snapshots, 1 of them figures stated on this page. Every revision we have observed →
Key estimates
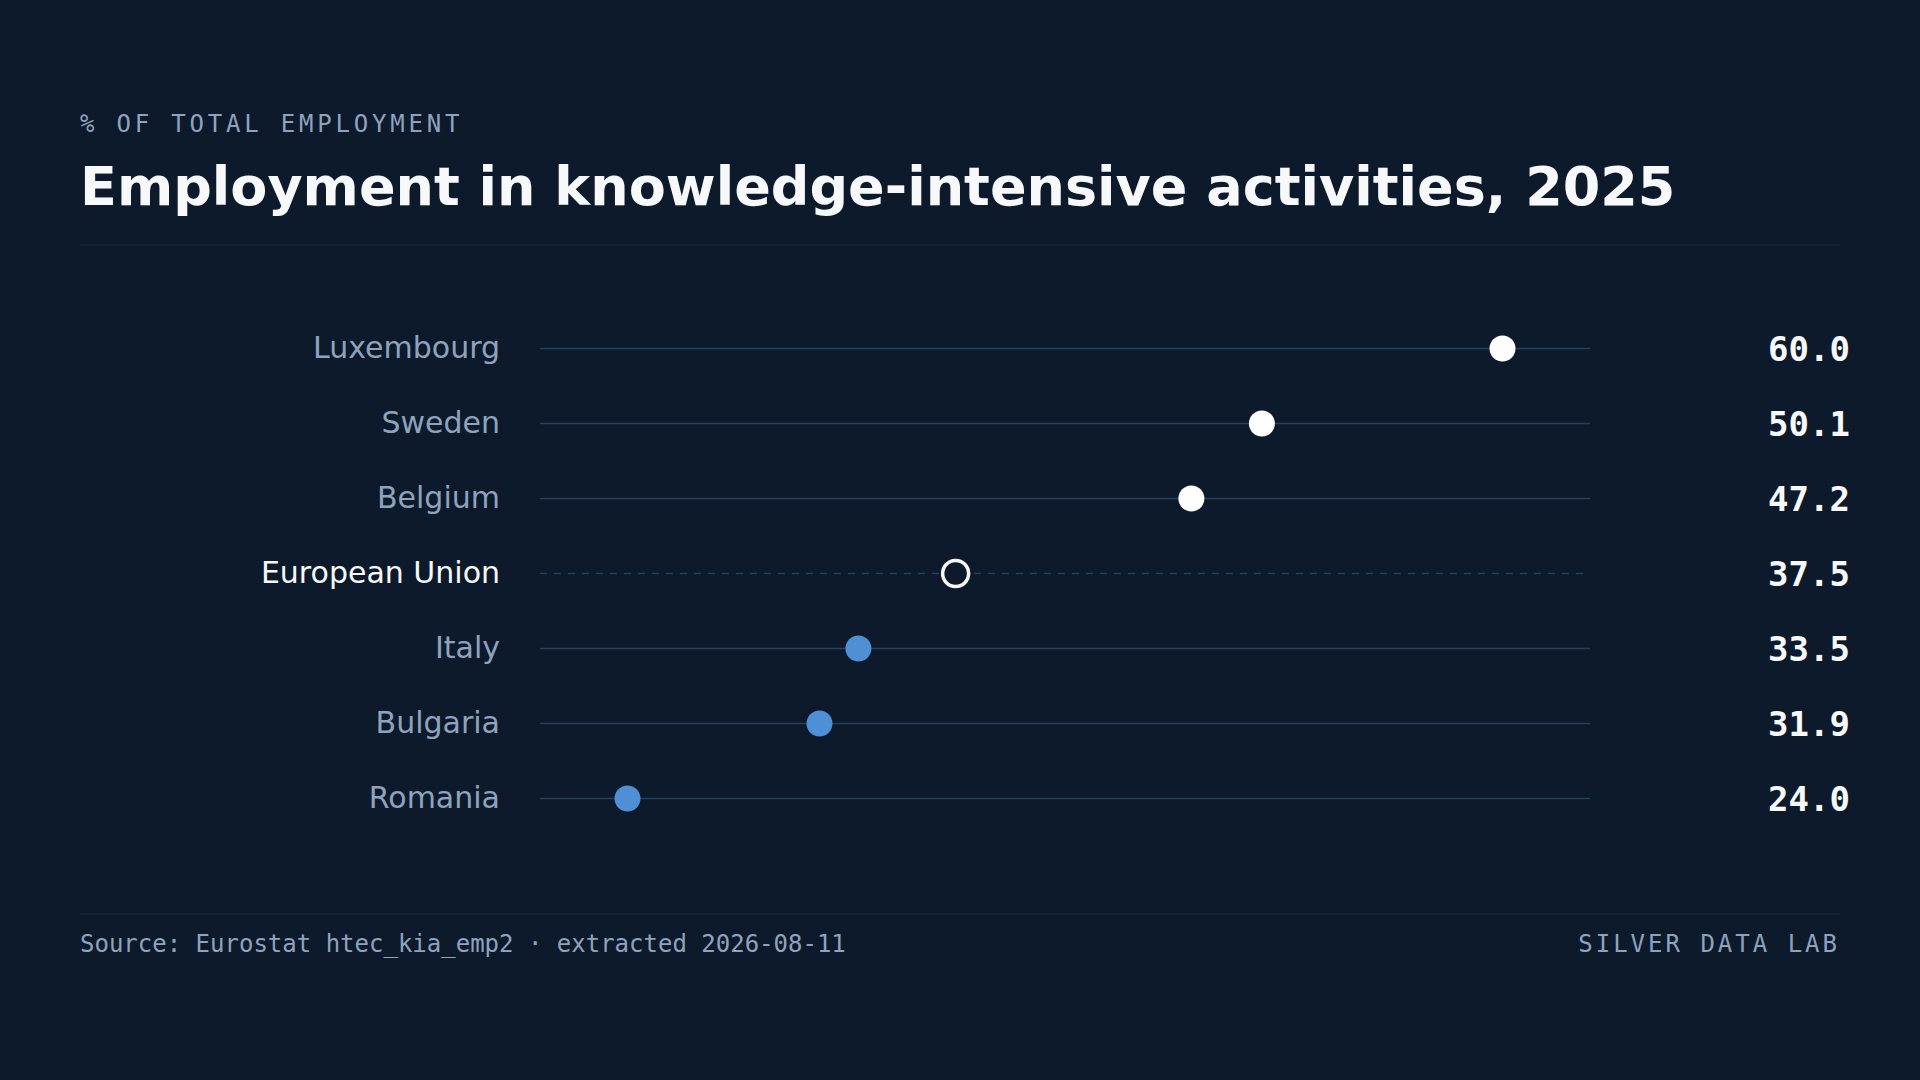
- 37.5% of people employed in the EU worked in knowledge-intensive activities in 2025.
- Luxembourg records 62.7% and Sweden 50.1%, the two Member States where such work is the majority of employment.
- Romania records 24.0%, followed by Bulgaria at 31.9% and Italy at 33.5%.
- Italy at 33.5% and Spain at 34.1% are the only large western economies in the bottom five.
- The classification is by sector, so it counts every job in a knowledge-intensive industry, including those that are not themselves knowledge work.
What the category actually contains
Knowledge-intensive activities are defined by sector rather than by occupation. Eurostat classifies industries in which the share of tertiary-educated workers exceeds a threshold, then counts everyone employed in them: education, health, finance, information and communication, professional services and most of public administration.
Across the EU, 37.5% of employment fell inside that boundary in 2025 — three jobs in eight.
Because the classification is sectoral, a receptionist in a law firm counts and a highly skilled machinist in a factory does not. The measure describes the composition of an economy rather than the skill content of individual jobs, and that distinction matters for reading the ranking.
The top
Luxembourg records 62.7%. Its financial sector alone accounts for a large share of national employment, and finance is inside the boundary.
Sweden follows at 50.1%, and those two are the only Member States where knowledge-intensive activities employ a majority of workers — Sweden by a tenth of a point. Belgium is at 47.2%, Ireland at 46.7% and the Netherlands at 44.4%. Cyprus at 41.7%, Denmark at 41.3% and Malta at 40.7% complete the group above 40%, with Austria sitting exactly on it.
The bottom, and the one that stands out
Romania records 24.0%, the lowest in the Union by a clear margin: Bulgaria, next, is at 31.9%.
Italy at 33.5% is the observation that does not fit the rest of the pattern. It is the Union's third-largest economy, and it sits below Slovakia, Poland and Latvia on this measure. Spain at 34.1% is the fifth-lowest and the only other large western economy in the group; the two below Italy are Romania and Bulgaria. Spain and Slovakia are a tenth of a point apart and Eurostat does not compute their employment on the same rule, so that part of the order should be left alone — the limitation below sets out why.
Italy's position is consistent with the picture its other indicators give: 3.8% ICT specialists against an EU figure of 5.0%, and 43.8% online purchasing against 62.4%. A single low reading would be noise; three from different surveys pointing the same way is a structural feature of the Italian economy rather than a measurement artefact.
Why the ranking is about industrial structure
A country's score on this indicator is largely a description of what its firms do. Economies concentrated in manufacturing, agriculture, construction and tourism will score low regardless of how well those sectors are run, because those sectors sit outside the classification.
That makes the measure useful for describing structure and misleading as a quality judgement. A high figure is not a statement that a country's workers are better; it is a statement about which industries employ them.
Employment in knowledge-intensive activities, 2025
| Country | % of total employment | Gap to EU averagepercentage points, derived |
|---|---|---|
| Luxembourg | 62.7 | +25.2 |
| Sweden | 50.1 | +12.6 |
| Belgium | 47.2 | +9.7 |
| European Unionaggregate | 37.5 | — |
| Italy | 33.5 | −4.0 |
| Bulgaria | 31.9 | −5.6 |
| Romania | 24.0 | −13.5 |
This table as data: CSV · JSON
Every Member State for this indicator+
Members see every Member State for this indicator here, not only the rows the ranking prints. Become a Member
What these figures cannot tell you
- The classification is sectoral, not occupational
- Every job in a knowledge-intensive industry counts, including cleaning, catering and administration within it, while skilled technical work in manufacturing does not. The indicator describes the industries an economy contains rather than the skill content of its jobs.
- Sector boundaries are fixed thresholds
- Industries are classified as knowledge-intensive when the share of tertiary-educated workers exceeds a set level. An industry just inside and one just outside are treated as categorically different, which overstates the distance between economies specialised in each.
- Public sector size affects the result
- Education, health and much of public administration fall inside the boundary, so a country with a large public sector will score higher without any difference in its private economy.
- The Spanish figure is not computed on the same employment rule
- Eurostat marks Spain and France as differing in definition on this series. The reason given in the labour force survey's comparability note is that both continue to apply the older treatment of employees on temporary lay-off, who count as employed there and would not under the Regulation that now governs the survey. Spain is one of the figures this study quotes against its neighbours, and it sits a tenth of a point above Slovakia: that ordering is not a safe one to read, because the two shares rest on different employment rules rather than on a difference in their economies.
- A share, not a count
- A high percentage in a small economy represents far fewer jobs than a lower percentage in a large one. This ranking measures composition and says nothing about the number of knowledge-intensive jobs a country contains.
Frequently asked questions
- What are knowledge-intensive activities?
- Sectors in which the share of tertiary-educated workers exceeds a threshold set by Eurostat: education, health, finance, information and communication, professional services and most public administration. The measure counts everyone employed in those sectors, not only those doing knowledge work.
- Which EU country has the most knowledge-intensive employment?
- Luxembourg, at 62.7% of total employment in 2025. It and Sweden, at 50.1%, are the only two Member States where such work is the majority; Belgium follows at 47.2%.
- Which EU country has the least?
- Romania, at 24.0% in 2025, followed by Bulgaria at 31.9% and Italy at 33.5%. Slovakia at 34.0% and Spain at 34.1% complete the bottom five.
- Does a high score mean better jobs?
- No. The classification is by industry, so the ranking describes which sectors employ a country's workers rather than how skilled or well paid those workers are. Economies concentrated in manufacturing, construction or tourism score low by construction.
Methodological note
Knowledge-intensive activities are defined by Eurostat as NACE Rev. 2 sectors in which the share of tertiary-educated workers exceeds a set threshold. The indicator counts all persons employed in those sectors as a percentage of total employment.
Values are for 2025, the most recent year with complete coverage of the 27 Member States at the extraction date.
The comparisons with Italy's ICT specialist share and online purchasing rate draw on the two companion studies in this category, and are stated as consistency between separate surveys rather than as a causal claim.
Source data
The underlying series can be inspected and re-downloaded from the Eurostat data browser. The filters below are the ones applied.
Employed persons in knowledge-intensive activities by NACE Rev. 2
htec_kia_emp2
- Filters applied:
- freq=A · sex=T · nace_r2=KIA · unit=PC_EMP · time=2025
- Extracted:
- 2026-09-11
- Source last updated:
- 2026-09-10
Download the data
The data the study you have just read is built on, exactly as it was downloaded and archived.
Yours as a Member.
Data downloadable by Members
How to cite
Record the vintage as well as the study: the figures on this page are the ones extracted on the dates below.
Silver Data Lab Research Desk (2026). 37.5% of EU Jobs Are in Sectors Where Many Workers Have a Degree. Silver Data Lab, published 03 July 2026, last updated 11 October 2026. https://www.silverdatalab.com/studies/knowledge-intensive-employment-in-the-eu
- Data: Eurostat, Employed persons in knowledge-intensive activities by NACE Rev. 2 (htec_kia_emp2), filters freq=A, sex=T, nace_r2=KIA, unit=PC_EMP, time=2025; extracted 2026-09-11; source last updated 2026-09-10. https://doi.org/10.2908/htec_kia_emp2
Silver Data Lab's analysis is licensed CC BY 4.0. The statistics remain their publisher's and keep its terms of reuse.
Ask the research desk
A question about this study — a definition, a filter, a break in the series, what the figures can and cannot support — answered by the desk that made the extraction.
Members can write to the research desk
Studies where the same country leads or trails
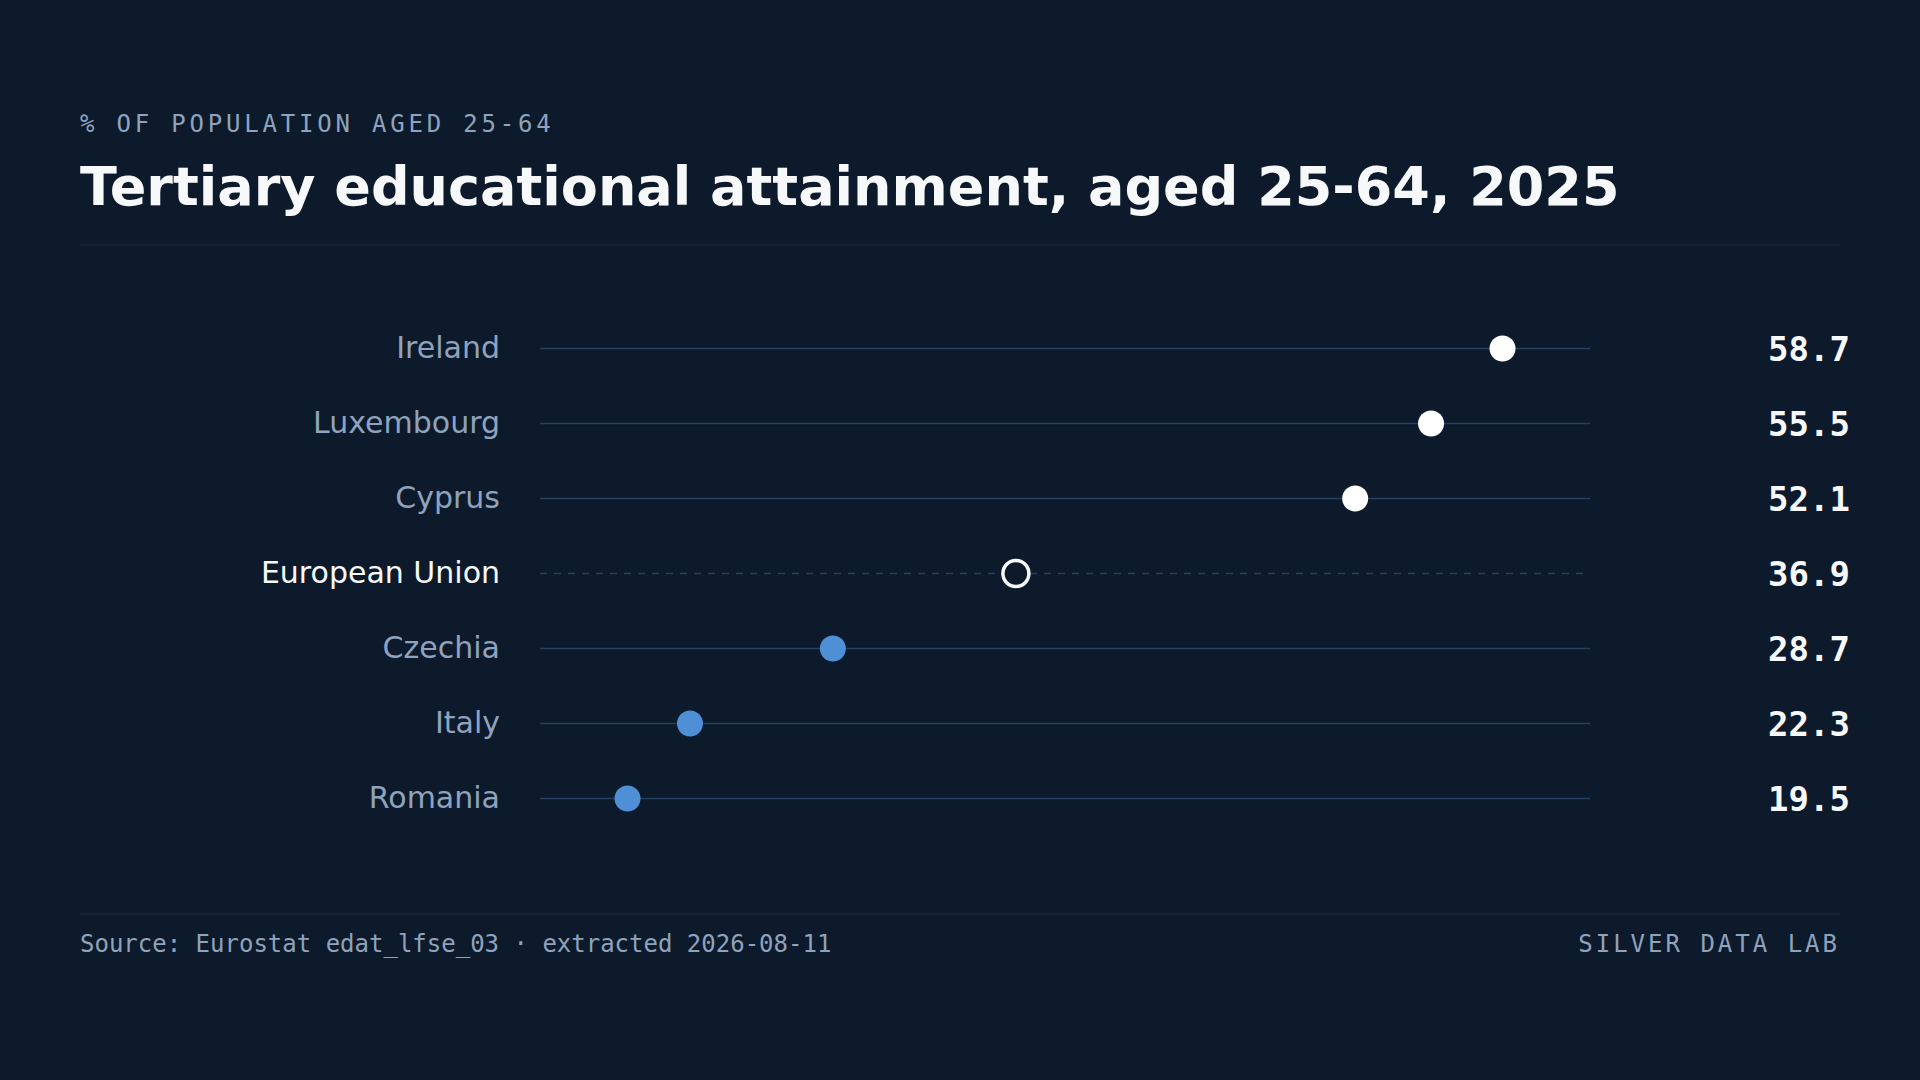
A Degree Is Three Times as Common Among Adults in Ireland as in Romania
36.9% of people aged 25 to 64 in the EU held a tertiary qualification in 2025.
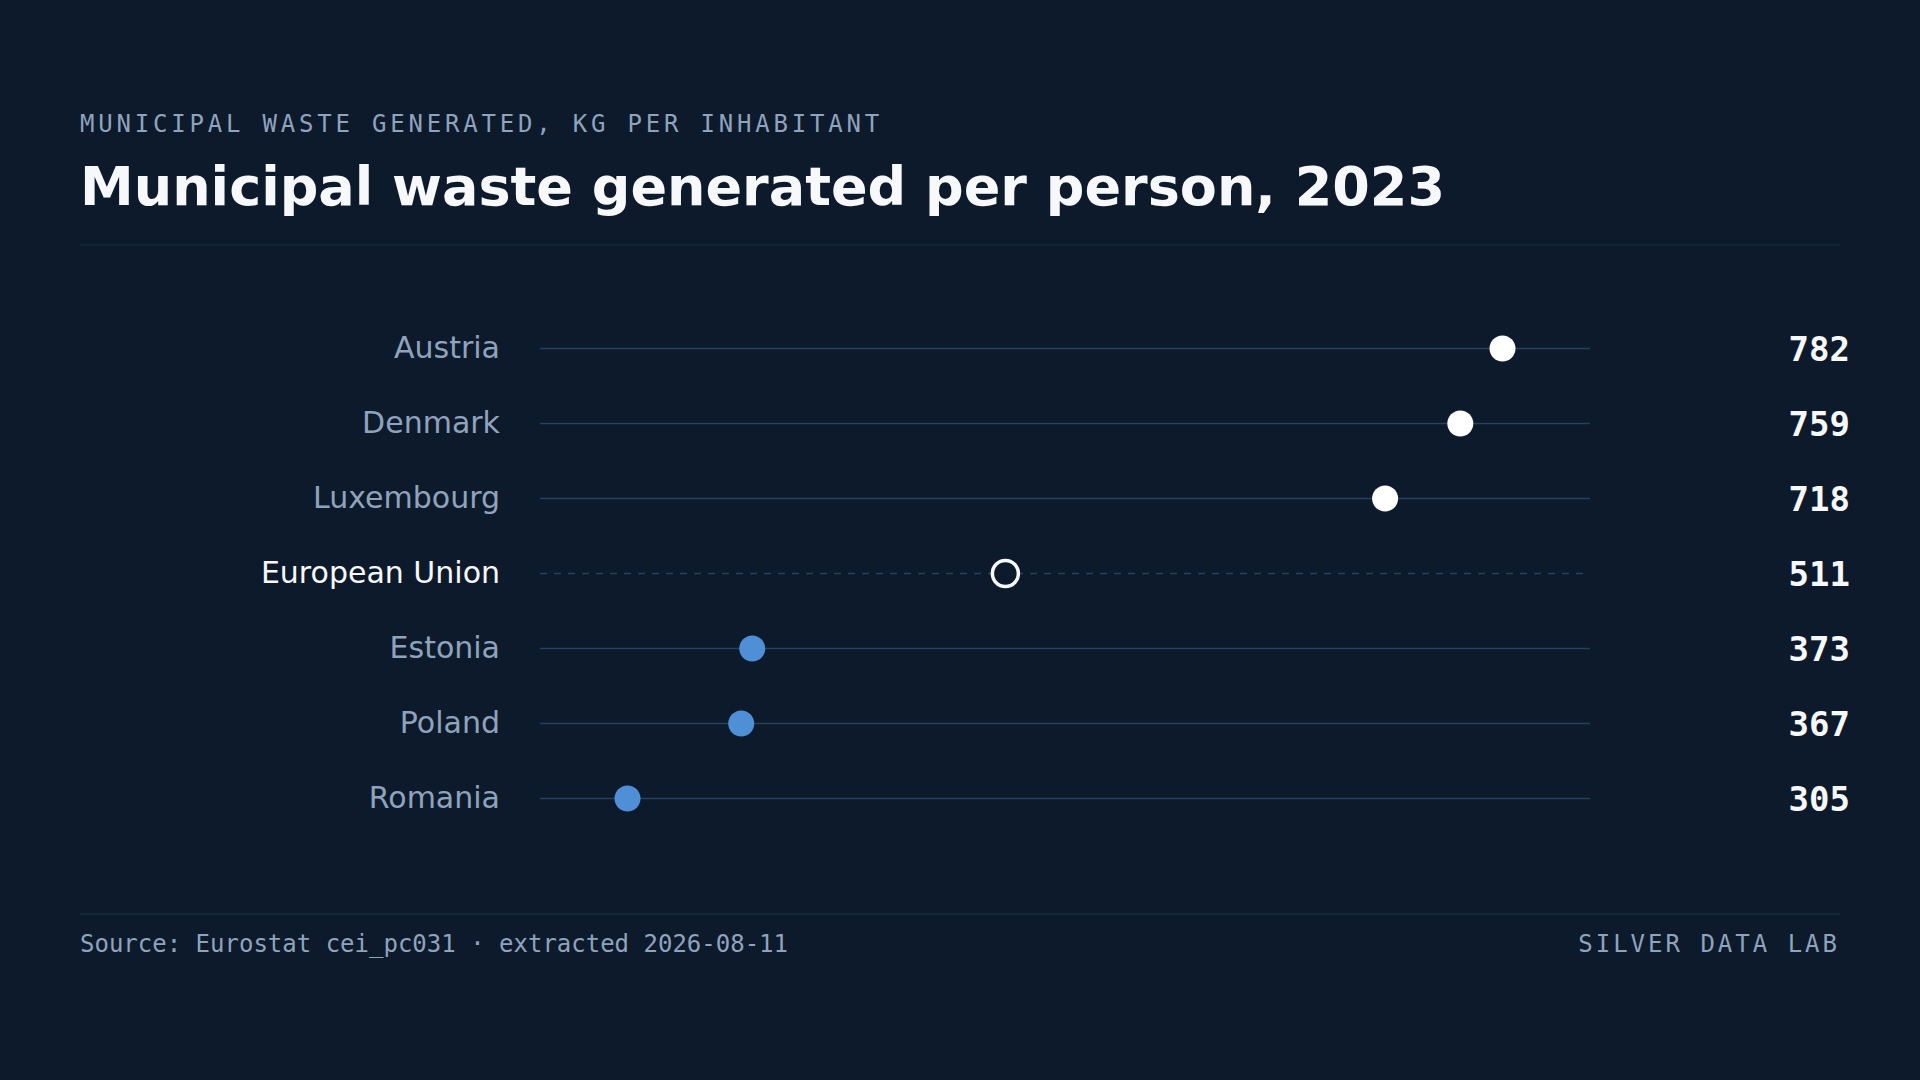
Austria Produces More Rubbish per Person Than Any Other EU Country
The EU generated 510 kg of municipal waste per inhabitant in 2023 — about 1.4 kg per person per day.
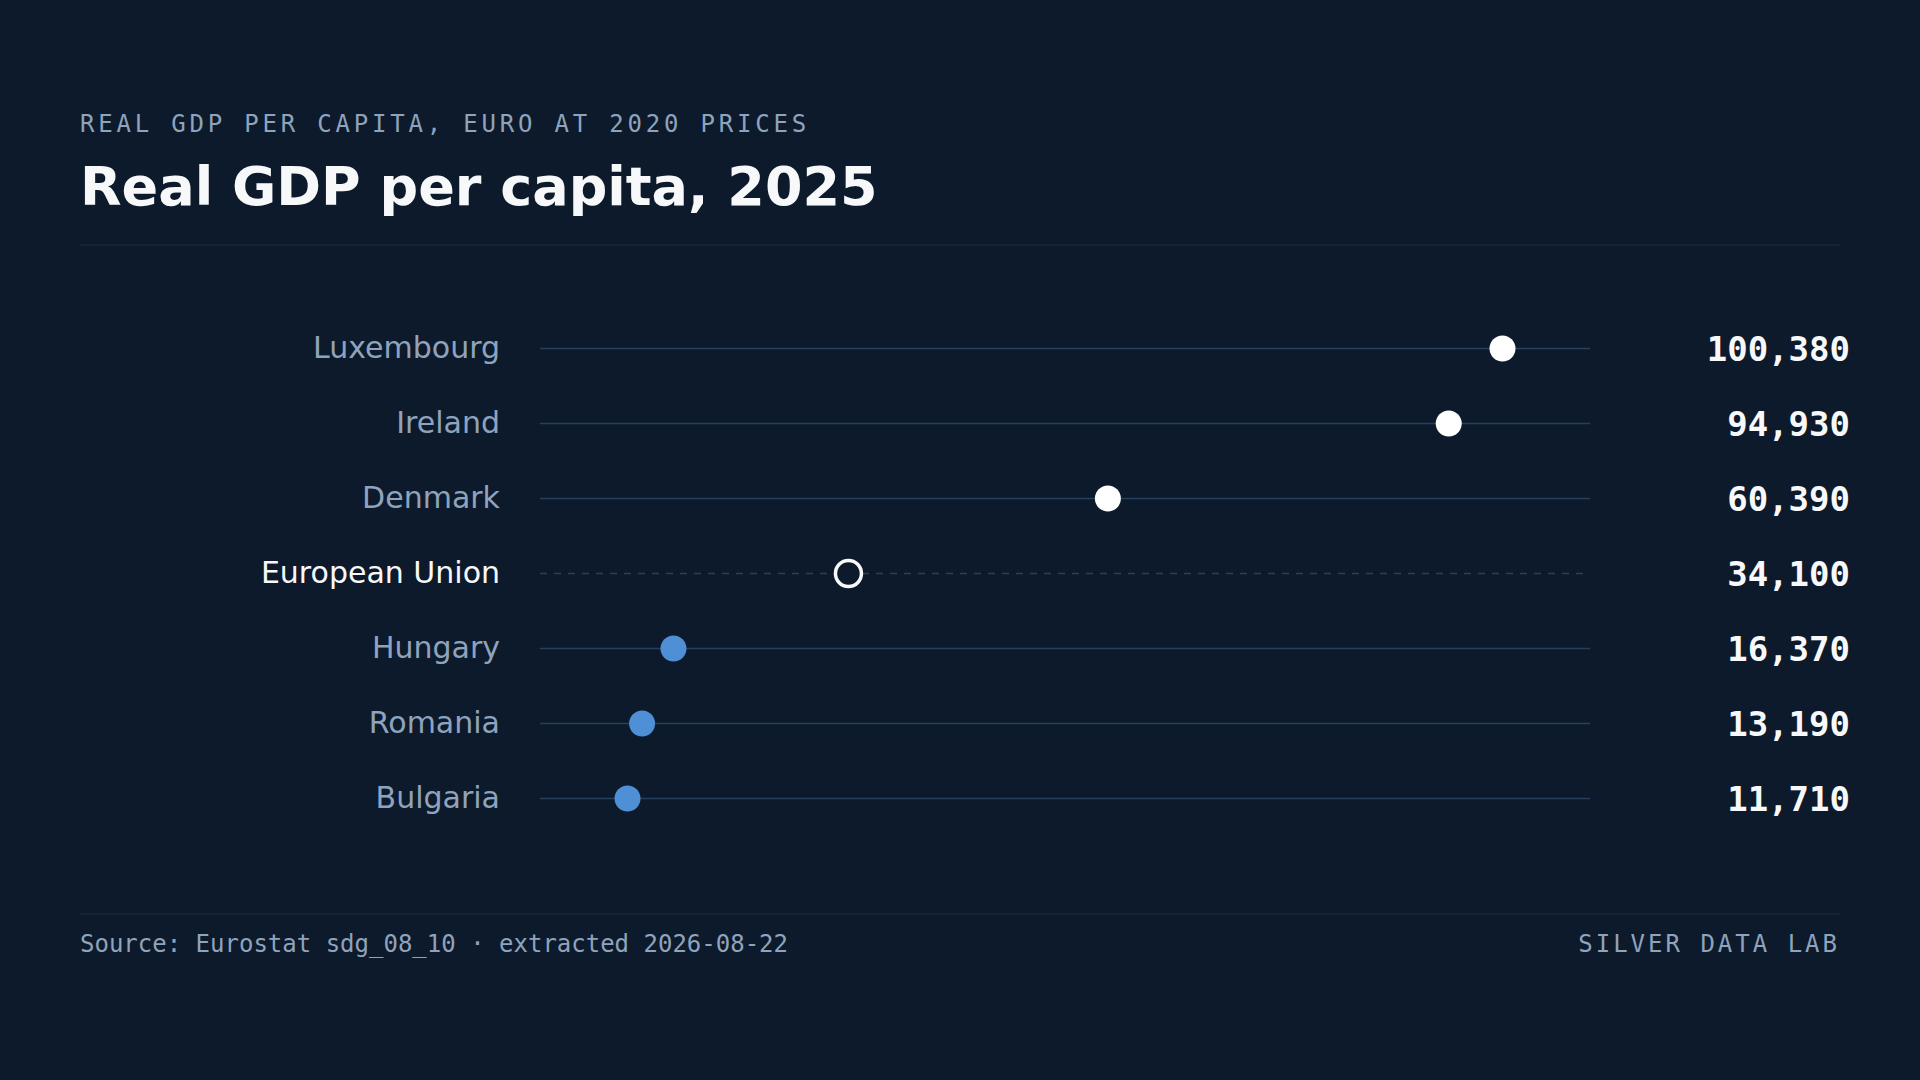
Bulgaria's GDP per Person Is About a Third of the EU Average
EU real GDP per capita was 34,250 euro in 2025, at 2020 prices.