Latvian Women Outlive Latvian Men by 9.8 Years, the Widest Gap in the EU
Silver Data Lab Research Desk · Statistical analysis · Published on 07 June 2026
- Data source
- Eurostat
- Reference period
- 2024
- Last updated
- 11 October 2026
Re-checked against the source on 26 September 2026. No value in its datasets has moved between the snapshots we hold. Every revision we have observed →
Key estimates
- Life expectancy at birth across the EU was 81.5 years in 2024: 84.1 for women and 78.9 for men.
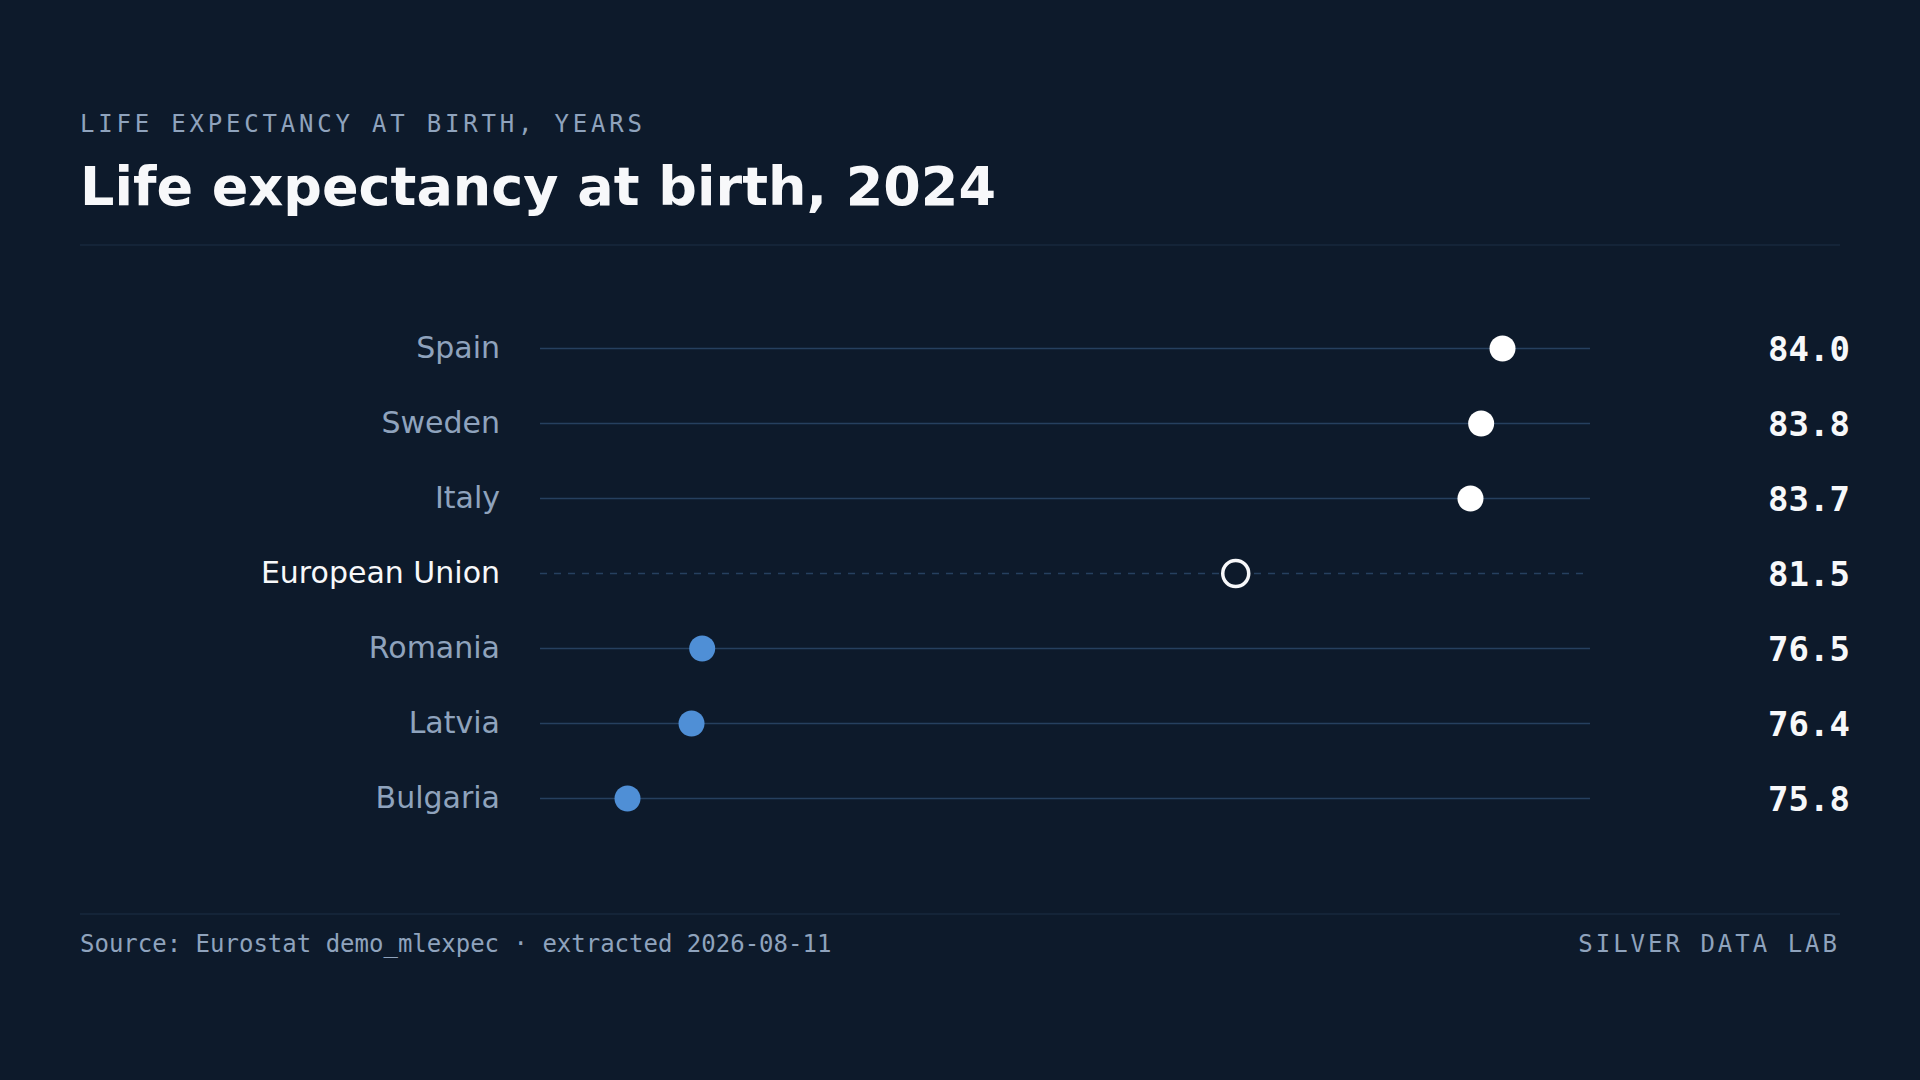
- Spain leads at 84.0 years, ahead of Sweden at 83.8 and Italy at 83.7. Bulgaria is lowest at 75.8.
- The 8.2 year spread between Spain and Bulgaria is large, but the sex gap varies far more in proportion to its size.
- Latvia records a 9.8 year gap between women and men; the Netherlands records 2.8.
- Latvian women reach 81.2 years, close to the EU total. Latvian men reach 71.4, more than ten years below it.
A national average that hides two populations
Life expectancy at birth is the most compressed summary statistic in demography: an entire country's mortality across every age reduced to one number. Across the European Union that number was 81.5 years in 2024.
It conceals two populations with systematically different outcomes. EU women reach 84.1 years, EU men 78.9 — a gap of 5.2 years that appears in no national ranking, because national rankings publish the total.
The country ranking, and its limits
Spain records the highest total at 84.0 years, followed by Sweden at 83.8 and Italy at 83.7. At the other end, Bulgaria records 75.8, Latvia 76.4 and Romania 76.5.
The distance between the highest and lowest Member State is 8.2 years. Read alone, that is the headline: an eight-year difference in how long a European can expect to live, depending on which country they are born in.
The gap that varies more in proportion to its size
Set the totals aside and measure the distance between women and men in each country, and the range is wider still relative to what is being measured.
Latvia records a gap of 9.8 years, Lithuania 8.6 and Estonia 8.3. The Netherlands records 2.8, Sweden 3.0 and Ireland 3.3. The largest sex gap in the Union is three and a half times the smallest.
Latvia is the case worth reading closely. Latvian women reach 81.2 years — below the EU total of 81.5, but not dramatically so, and above the total for several Member States. Latvian men reach 71.4 years, which is 10.1 years below the EU total and 9.8 below the women in their own country.
The country's position at the bottom of the European ranking is therefore not a general fact about Latvia. It is a fact about Latvian men, and a national average that reports 76.4 makes that invisible.
Why the pattern clusters
The three widest gaps in the Union are the three Baltic states, and the three narrowest are the Netherlands, Sweden and Ireland. That is not a random distribution across twenty-seven countries, and it points at differences in male mortality specifically rather than at health systems treating both sexes equally badly or equally well.
This study measures the gaps; it does not explain them. Attributing them to any particular cause would require cause-of-death data this extraction does not contain, and the temptation to supply a plausible explanation is exactly what the figures cannot support.
Life expectancy at birth, 2024
| Country | Years | Gap to EU averagederived |
|---|---|---|
| Spain | 84.0 | +2.5 |
| Sweden | 83.8 | +2.3 |
| Italy | 83.7 | +2.2 |
| European Unionaggregate | 81.5ep | — |
| Romania | 76.5e | −5.0 |
| Latvia | 76.4 | −5.1 |
| Bulgaria | 75.8 | −5.7 |
Flags carried by the source on these values: e estimated · ep estimated, provisional
This table as data: CSV · JSON
Every Member State for this indicator+
Members see every Member State for this indicator here, not only the rows the ranking prints. Become a Member
Embed this chart
Paste this code into a page. The frame carries the source and the extraction date, and links back to the study.
What these figures cannot tell you
- Life expectancy is a snapshot, not a forecast
- Period life expectancy applies the mortality rates observed in one year across a hypothetical lifetime. It describes conditions in 2024, not how long a child born in 2024 will actually live, which depends on mortality rates over the next eighty years that nobody has observed.
- Sex gaps are measured, not explained
- This study establishes the size of the difference between women and men in each Member State. It does not attribute it to behaviour, occupation, health service use or any other cause, because the extraction used contains life tables and nothing about causes of death.
- One year, no trend
- The values are for 2024 alone. Life expectancy fell across much of Europe during the pandemic years and has been recovering at different speeds, so a single year says nothing about whether a country is improving or deteriorating.
- National averages conceal regional differences
- Within-country variation in life expectancy can approach the between-country variation reported here, particularly in Member States with large regional disparities. A national figure is an average over regions that may differ by several years.
Frequently asked questions
- What is life expectancy in the EU?
- 81.5 years at birth in 2024, comprising 84.1 years for women and 78.9 for men. The figure is period life expectancy: it applies one year's mortality rates across a lifetime rather than forecasting how long anyone will live.
- Which EU country has the highest life expectancy?
- Spain, at 84.0 years in 2024, ahead of Sweden at 83.8 and Italy at 83.7. The lowest are Bulgaria at 75.8, Latvia at 76.4 and Romania at 76.5.
- How much longer do women live than men in the EU?
- 5.2 years on the EU aggregate. The gap varies far more in proportion to its size: 9.8 years in Latvia, 8.6 in Lithuania and 8.3 in Estonia, against 2.8 in the Netherlands, 3.0 in Sweden and 3.3 in Ireland.
- Why does Latvia rank low on life expectancy?
- Because of male mortality specifically. Latvian women reach 81.2 years, close to the EU total of 81.5, while Latvian men reach 71.4 — 10.1 years below the EU total. The national average of 76.4 is the midpoint of two very different outcomes.
Methodological note
Life expectancy at birth is taken from Eurostat's life tables, for the age group under one year, which is the standard definition of life expectancy at birth. Values are for 2024, the most recent year with complete coverage of the 27 Member States at the extraction date.
Figures are published separately for the total population and for women and men. The sex gap quoted for each country is derived by Silver Data Lab by subtracting the male figure from the female figure; Eurostat publishes the two series, not the difference.
Source data
The underlying series can be inspected and re-downloaded from the Eurostat data browser. The filters below are the ones applied.
Life expectancy by age and sex
demo_mlexpec
- Filters applied:
- freq=A · age=Y_LT1 · sex=T, F, M · unit=YR · time=2024
- Extracted:
- 2026-09-26
- Source last updated:
- 2026-09-25
Download the data
The data the study you have just read is built on, exactly as it was downloaded and archived.
Yours as a Member.
Data downloadable by Members
How to cite
Record the vintage as well as the study: the figures on this page are the ones extracted on the dates below.
Silver Data Lab Research Desk (2026). Latvian Women Outlive Latvian Men by 9.8 Years, the Widest Gap in the EU. Silver Data Lab, published 07 June 2026, last updated 11 October 2026. https://www.silverdatalab.com/studies/life-expectancy-in-the-eu
- Data: Eurostat, Life expectancy by age and sex (demo_mlexpec), filters freq=A, age=Y_LT1, sex=T, F, M, unit=YR, time=2024; extracted 2026-09-26; source last updated 2026-09-25. https://doi.org/10.2908/demo_mlexpec
Silver Data Lab's analysis is licensed CC BY 4.0. The statistics remain their publisher's and keep its terms of reuse.
Ask the research desk
A question about this study — a definition, a filter, a break in the series, what the figures can and cannot support — answered by the desk that made the extraction.
Members can write to the research desk
Studies where the same country leads or trails
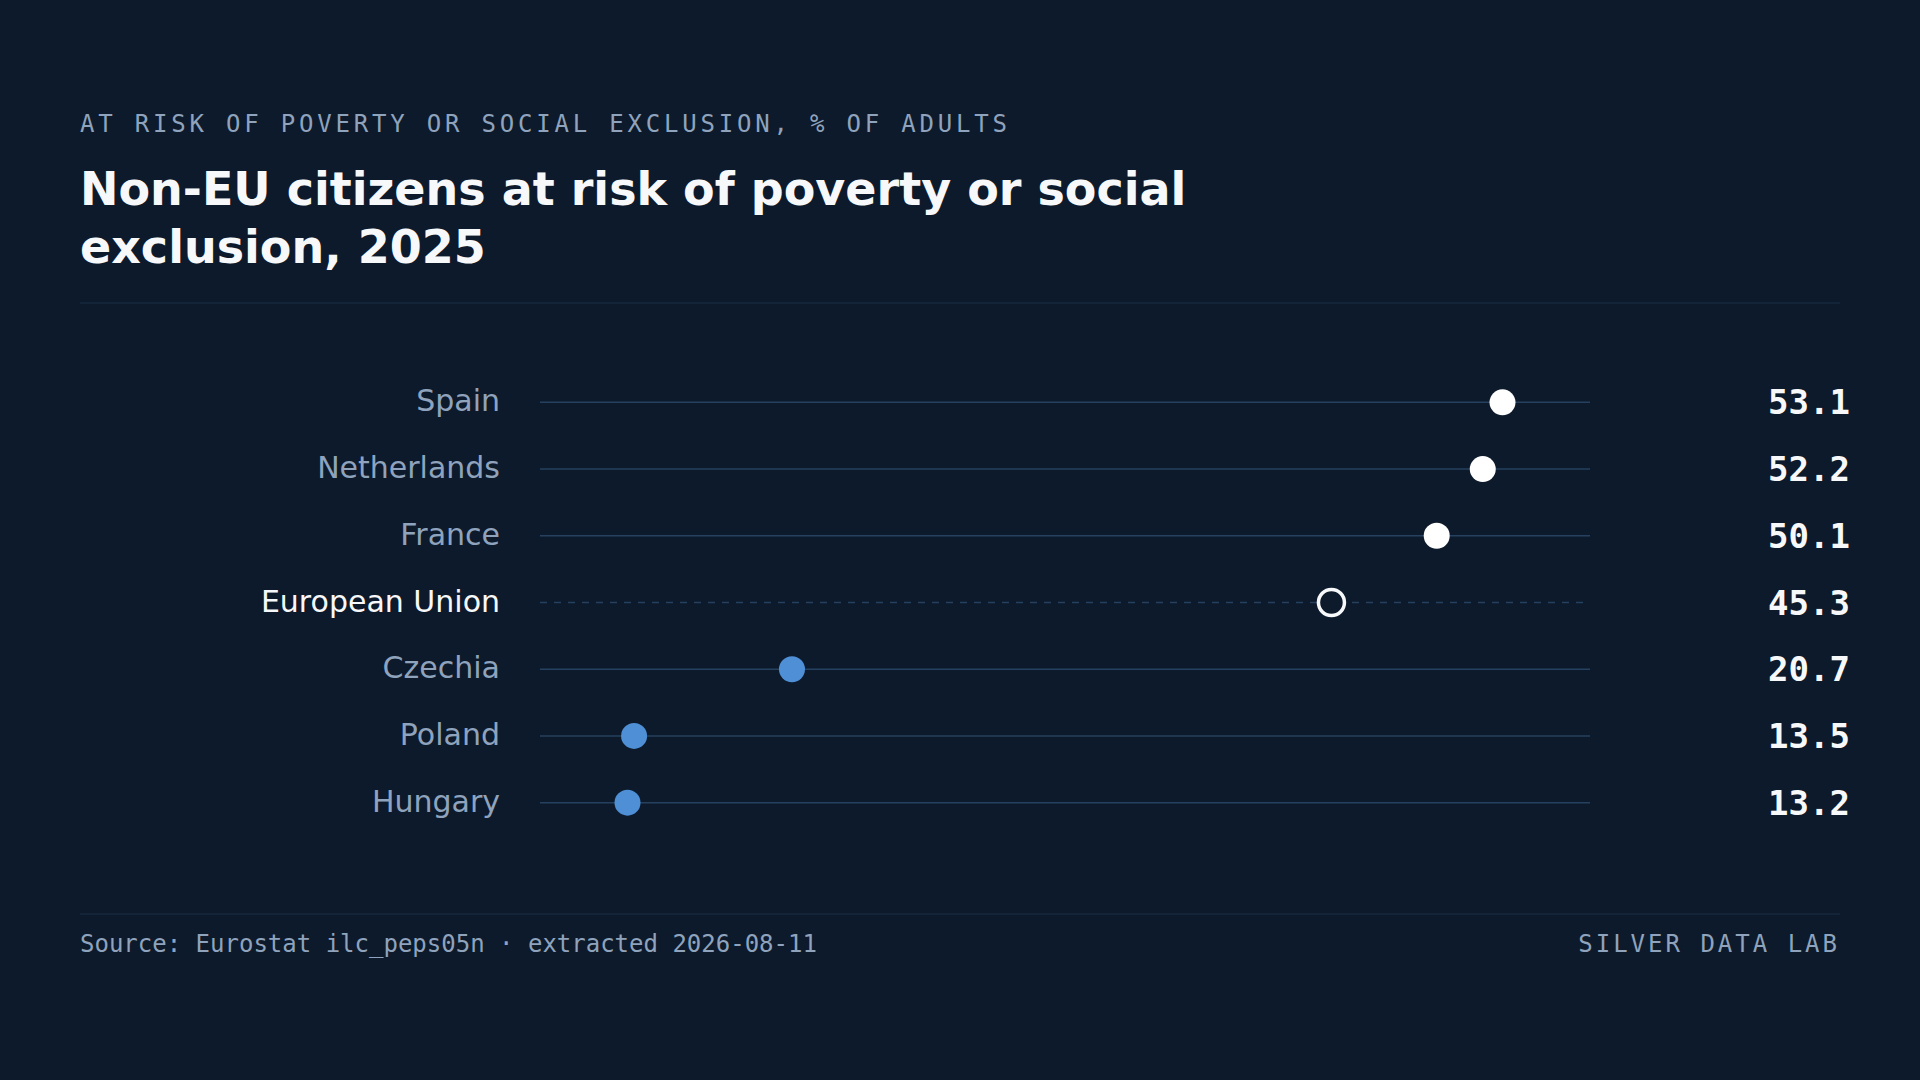
52.2% of Adult Non-EU Citizens in the Netherlands Risk Poverty or Exclusion
45.3% of non-EU citizens aged 18 and over in the EU were at risk of poverty or social exclusion in 2025, against 18.2% of nationals.
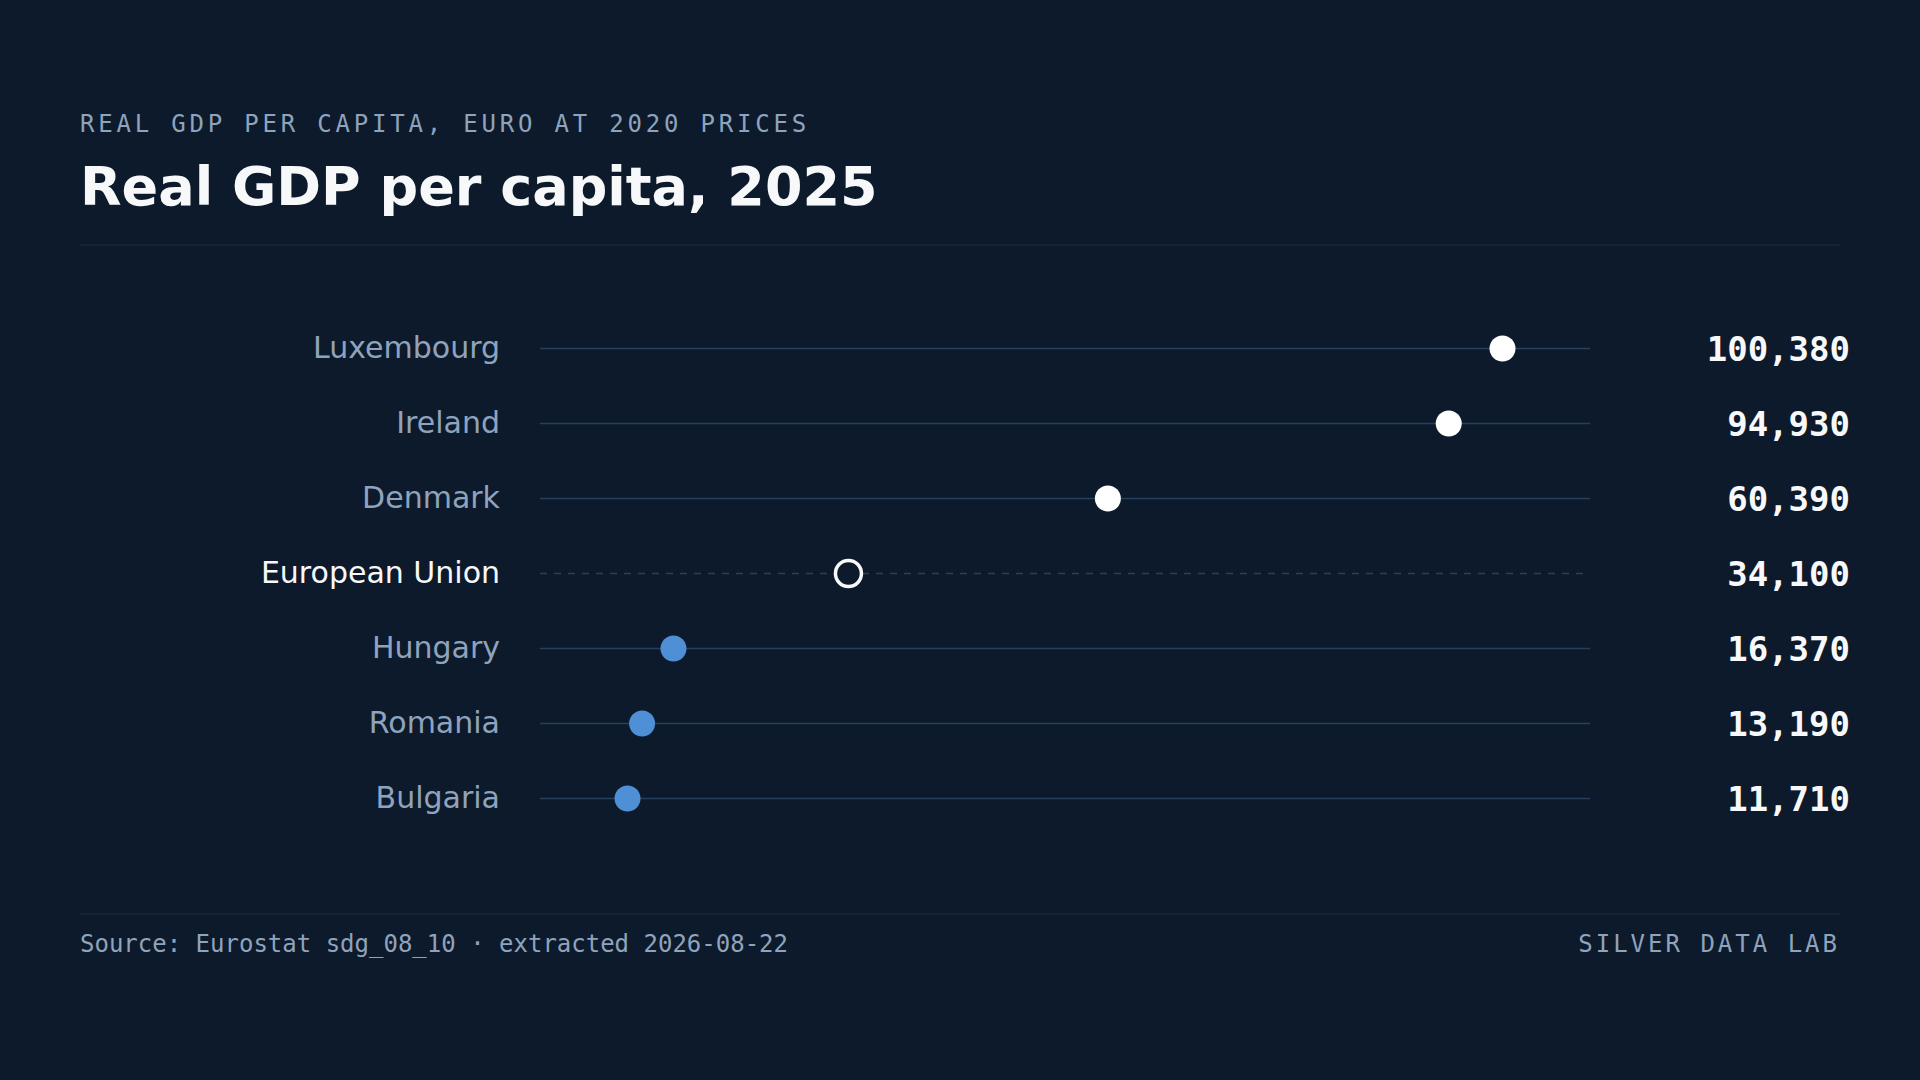
Bulgaria's GDP per Person Is About a Third of the EU Average
EU real GDP per capita was 34,250 euro in 2025, at 2020 prices.
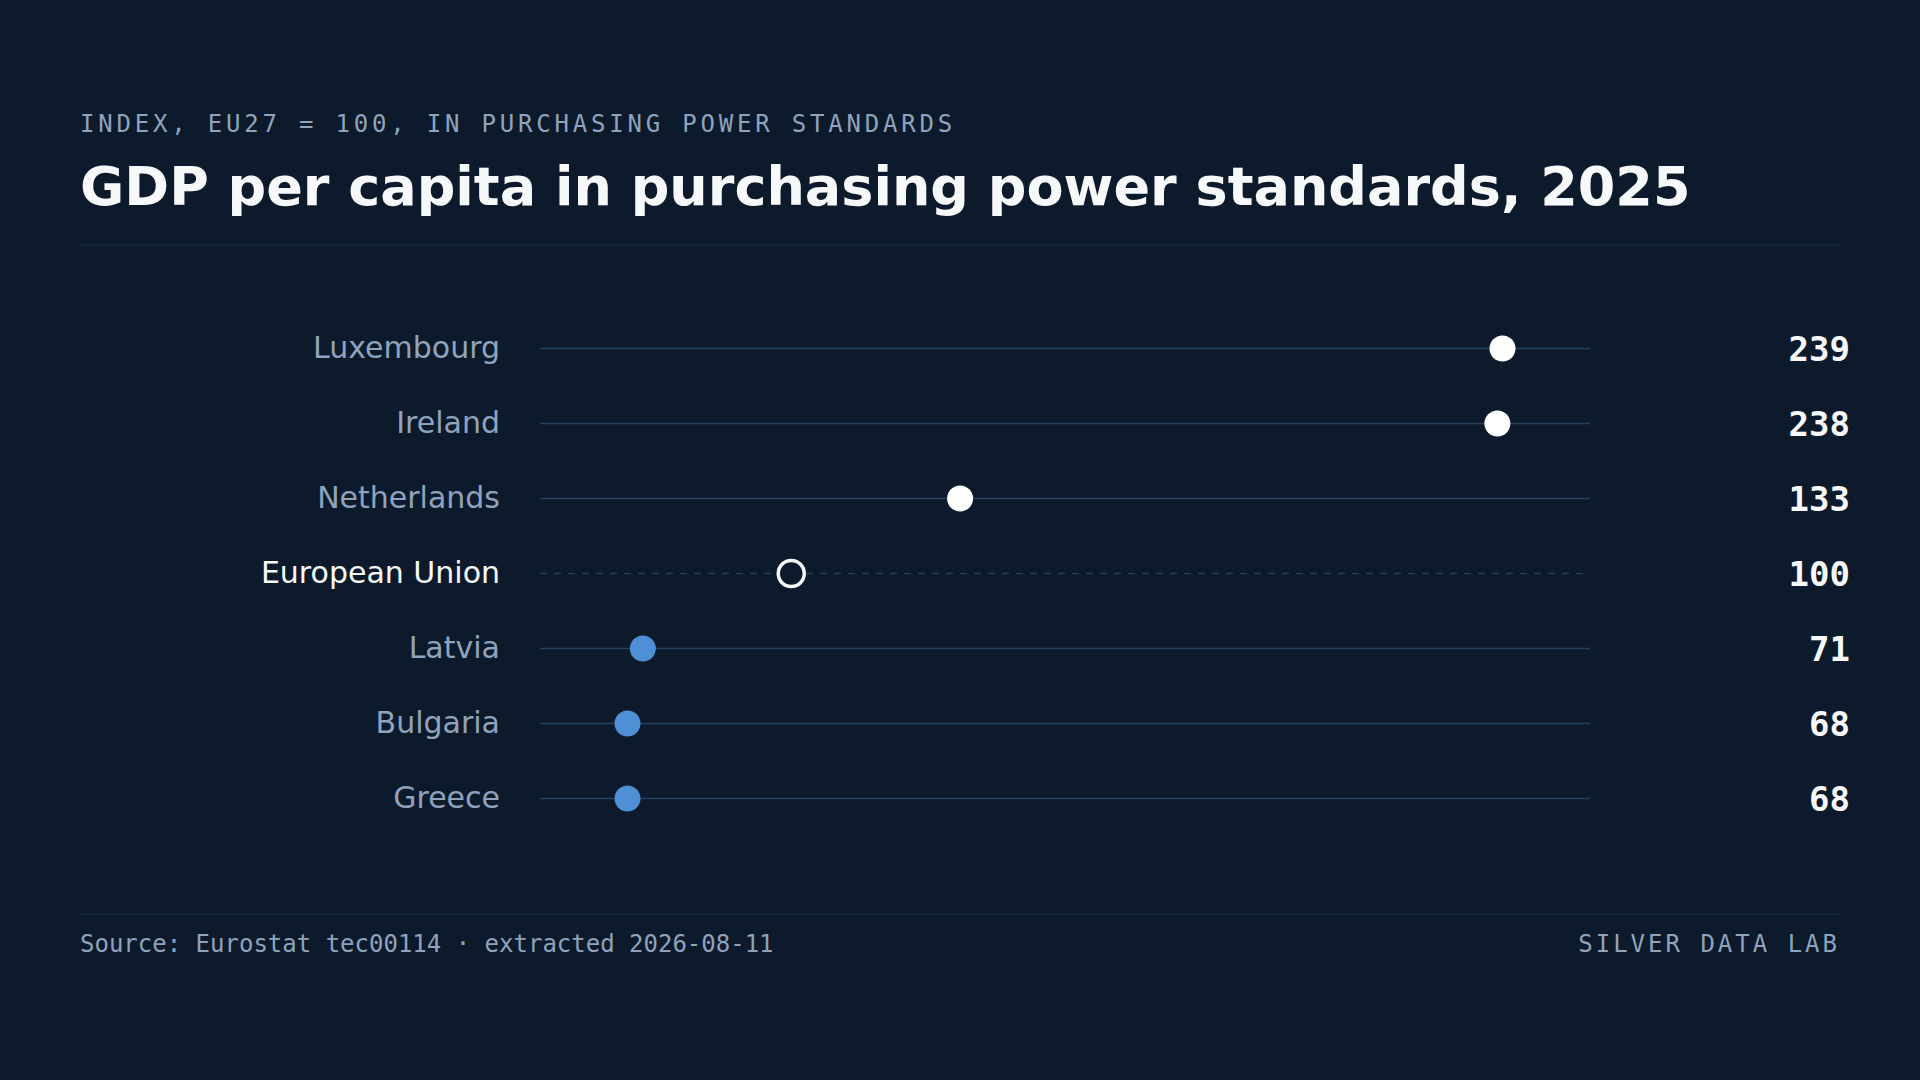
GDP per Head Makes Luxembourg and Ireland Look Richer Than They Are
Luxembourg records 239 and Ireland 238 against an EU average of 100 — more than double the Union's output per head.