Three Quarters of Irish Farm Output Comes From Animals
Silver Data Lab Research Desk · Statistical analysis · Published on 16 May 2026
- Data source
- Eurostat
- Reference period
- 2025
- Last updated
- 18 October 2026
Re-checked against the source on 11 August 2026. No value in its datasets has moved between the snapshots we hold. Every revision we have observed →
Key estimates
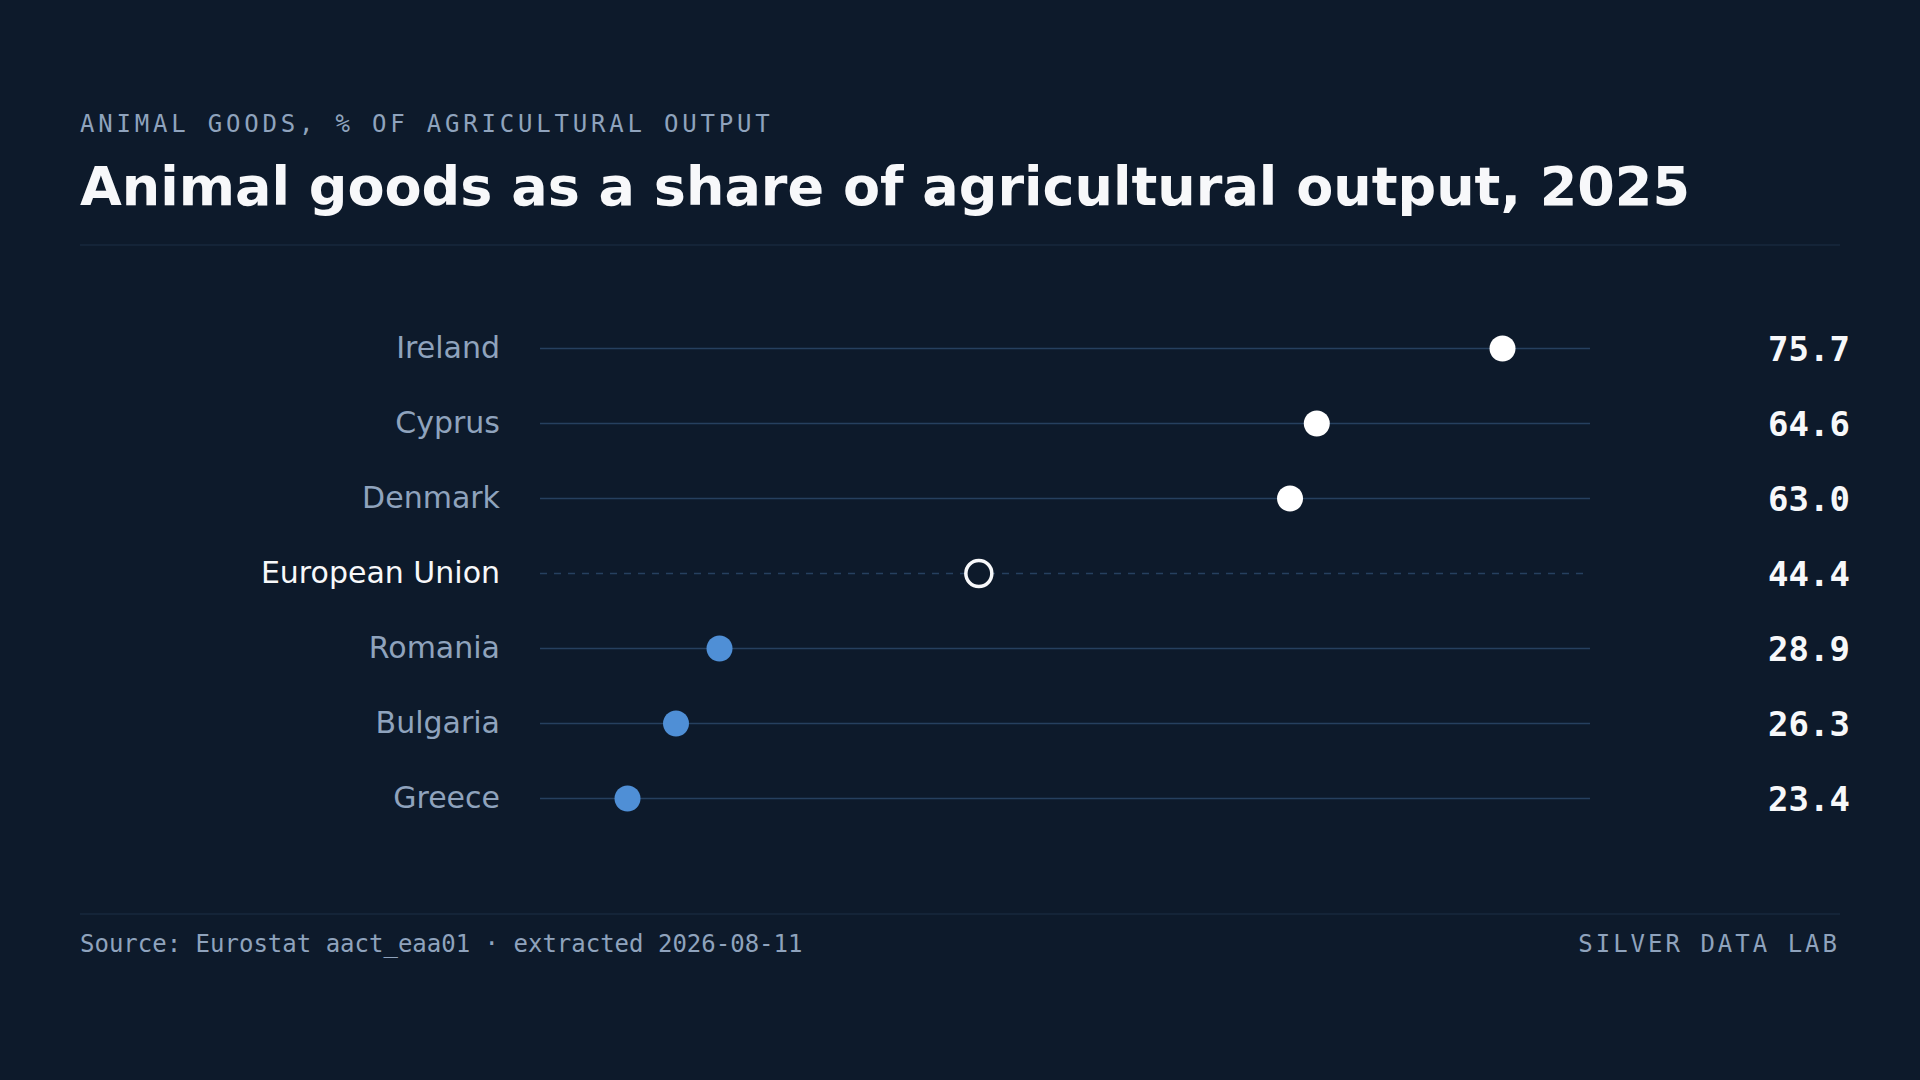
- Animal goods accounted for 44.4% of EU agricultural output by value in 2025.
- Ireland records 75.7% — three quarters of its farm output is animals and animal products.
- Greece records 23.4%, Bulgaria 26.3% and Romania 28.9%.
- Eleven Member States are above 50%, and all but Cyprus and Malta of them are in northern or central Europe.
- The ordering reads as a climate map, though no climate data enters this study; GDP per head lines up with it too.
What a farm sells
Agricultural output is mostly two things: crops, and animals with the products that come from them. The remainder, close to a twentieth of the Union total, is agricultural services, so the two do not sum to the whole. The balance between them describes what a country's farming is for.
Across the EU in 2025, animal goods accounted for 44.4% of agricultural output by value. Slightly less than half.
The national figures run from 75.7% to 23.4%, and the ordering is close to a map.
The grass economies
Ireland records 75.7%, the highest in the Union. Cyprus is second and is a case of its own, taken below; after it come Denmark at 63.0%, Luxembourg at 61.1%, Malta at 58.3%, Belgium at 58.2%, Finland at 54.4% and Estonia at 54.2%.
Ireland is the clearest case. It has high rainfall, mild winters and a long grass-growing season, and comparatively little land suited to arable crops at scale. Grass supports cattle and sheep, and cattle and sheep are what Irish agriculture largely produces.
Cyprus at 64.6% is the exception to the geography, and its position rests on a small total output — 885 million euro — in which intensive livestock is a large share of a small number.
The sun economies
Greece records 23.4%, the lowest in the Union. Bulgaria follows at 26.3%, Romania at 28.9% and Italy at 35.8%.
Greek agriculture is olives, fruit, vegetables and wine — crops that need sunshine and tolerate dry summers, and that generate high value per hectare without livestock. Portugal at 37.0% and Croatia at 37.7% sit in the same band. Slovakia at 36.5% and Lithuania at 37.4% sit in it without the climate: this study offers no account of either.
Why this is a climate ranking
Almost every Member State above 50% has cool summers, reliable rainfall and a short or unreliable arable season. Most Member States below 40% have hot dry summers and land suited to permanent crops; Lithuania and Slovakia, as above, do not.
That is a stronger regularity than most rankings on this site produce, and it has an obvious cause: farming is one of the few economic activities whose output mix is directly constrained by weather. A Greek farmer cannot easily choose to run a dairy herd on Greek rainfall, and an Irish farmer cannot grow olives.
Wealth and climate cannot be told apart here. Across the Union the animal share and GDP per head line up, high with high and low with low, a correspondence derived here from the two series, each for a single year. But in Europe wealth and growing season are not independent of one another, so the two point the same way here and a ranking of twenty-seven countries cannot separate them. The departures are large and run both ways — Estonia is below the EU level on GDP per head and sits near the top of this ranking, the Netherlands is far above it and sits below the EU animal share, Italy is above Estonia and sits near the bottom.
What follows from the split
The two halves of European agriculture face different risks and different policy. Livestock systems are exposed to feed costs, animal disease and emissions rules; crop systems are exposed to drought, frost at the wrong moment and the price of a small number of commodities.
An EU-wide agricultural policy is therefore acting on two sectors that share a name and little else, and the 44.4% average describes neither of them.
Animal goods as a share of agricultural output, 2025
| Country | % of agricultural output | Gap to EU averagepercentage points, derived |
|---|---|---|
| Ireland | 75.7 | +31.3 |
| Cyprus | 64.6 | +20.2 |
| Denmark | 63.0 | +18.6 |
| European Unionaggregate | 44.4 | — |
| Romania | 28.9 | −15.5 |
| Bulgaria | 26.3 | −18.1 |
| Greece | 23.4 | −21.0 |
This table as data: CSV · JSON
Every Member State for this indicator+
Members see every Member State for this indicator here, not only the rows the ranking prints. Become a Member
Embed this chart
Paste this code into a page. The frame carries the source and the extraction date, and links back to the study.
What these figures cannot tell you
- Value, not volume or headcount
- The share is measured in euro of output, so it moves with the relative prices of animal and crop products. A year of high grain prices lowers the animal share everywhere without any change in what farms produce.
- Two categories cover an uneven mix
- Animal goods combine live animals and animal products such as milk and eggs; crop output combines cereals, industrial crops, vegetables, fruit and wine. Neither category is homogeneous, and countries with very different farming can land on the same share. The denominator is total agricultural output, which also carries agricultural services, so subtracting the animal share does not leave the crop share.
- Small producers are volatile
- In Cyprus, Malta and Luxembourg total output is small enough that the composition can shift noticeably from one year to the next. Their positions are less stable than those of the large producers.
- Climate is described, not measured
- The characterisation of Member States by rainfall and growing season is a description offered to explain the pattern. No climate data enters this analysis, and the correspondence is an observation rather than a tested relationship.
- GDP per head is not household income
- The second series is Eurostat's volume index of GDP per head in purchasing power standards, with the EU set to one hundred. It measures output produced in a country rather than what its residents receive: the Irish and Luxembourg values are inflated by activity booked there by firms and by workers who live elsewhere, as the study of that index sets out. Ireland is also the top row of this ranking, so the correspondence drawn above leans on a country whose index overstates it.
Frequently asked questions
- How much of EU farming is livestock?
- Animal goods — live animals plus products such as milk and eggs — accounted for 44.4% of EU agricultural output by value in 2025, slightly less than half.
- Which EU country is most dependent on livestock?
- Ireland, where animal goods are 75.7% of agricultural output. Cyprus follows at 64.6% and Denmark at 63.0%. Ireland's high rainfall and long grass-growing season favour cattle and sheep over arable crops.
- Which EU country farms the fewest animals?
- Greece, where animal goods are 23.4% of agricultural output, followed by Bulgaria at 26.3% and Romania at 28.9%. Greek farming is dominated by olives, fruit, vegetables and wine.
- Does wealth determine whether a country farms animals or crops?
- The two line up: a high GDP per head goes with a high animal share across the Union, and a low one with a low share. But in Europe wealth and growing season are not independent of one another, so the two cannot be told apart here, and the departures are large in both directions — Estonia is below the EU level on GDP per head and near the top, the Netherlands far above it and below the EU animal share. What this study measures is the output split; wealth enters only as a comparison, and climate is described rather than measured.
Methodological note
The economic accounts for agriculture publish output at basic prices by product group. This study uses animal goods, which combine live animals and animal products, as a share of total agricultural output, both at current prices in millions of euro.
Values are for 2025 and cover all 27 Member States.
The shares themselves are computed by Silver Data Lab as animal goods divided by total agricultural output, and the counts of Member States above 50% and below 40% follow from that calculation; so does the correspondence between those shares and GDP per head, for which GDP per capita in purchasing power standards is declared as the second source below, and so does the size of the remainder that is neither crop output nor animal goods. All of them are labelled as derived. Total agricultural output is larger than crop output and animal goods together, because it also contains agricultural services. Eurostat flags every value in the agricultural extraction as an estimate, without exception, and the shares computed from them inherit that status.
Source data
This study draws on 2 datasets from Eurostat. Each can be inspected and re-downloaded from its catalogue, and the filters below are the ones applied.
Economic accounts for agriculture - values at current prices
aact_eaa01
- Filters applied:
- freq=A · indic_agr=PRD_BP · unit=MIO_EUR · am_item=AM100000, AM130000, AM160000 · time=2025
- Extracted:
- 2026-08-11
- Source last updated:
- 2026-05-13
GDP per capita in PPS
tec00114
- Filters applied:
- freq=A · indic_ppp=VI_PPS_EU27_2020_HAB · ppp_cat18=GDP · time=2025
- Extracted:
- 2026-08-11
- Source last updated:
- 2026-07-09
Download the data
The data the study you have just read is built on, exactly as it was downloaded and archived.
Yours as a Member.
Data downloadable by Members
How to cite
Record the vintage as well as the study: the figures on this page are the ones extracted on the dates below.
Silver Data Lab Research Desk (2026). Three Quarters of Irish Farm Output Comes From Animals. Silver Data Lab, published 16 May 2026, last updated 18 October 2026. https://www.silverdatalab.com/studies/livestock-farming-in-the-eu
- Data: Eurostat, Economic accounts for agriculture - values at current prices (aact_eaa01), filters freq=A, indic_agr=PRD_BP, unit=MIO_EUR, am_item=AM100000, AM130000, AM160000, time=2025; extracted 2026-08-11; source last updated 2026-05-13. https://doi.org/10.2908/aact_eaa01
- Data: Eurostat, GDP per capita in PPS (tec00114), filters freq=A, indic_ppp=VI_PPS_EU27_2020_HAB, ppp_cat18=GDP, time=2025; extracted 2026-08-11; source last updated 2026-07-09. https://doi.org/10.2908/tec00114
Silver Data Lab's analysis is licensed CC BY 4.0. The statistics remain their publisher's and keep its terms of reuse.
Ask the research desk
A question about this study — a definition, a filter, a break in the series, what the figures can and cannot support — answered by the desk that made the extraction.
Members can write to the research desk
Other studies on the same dataset
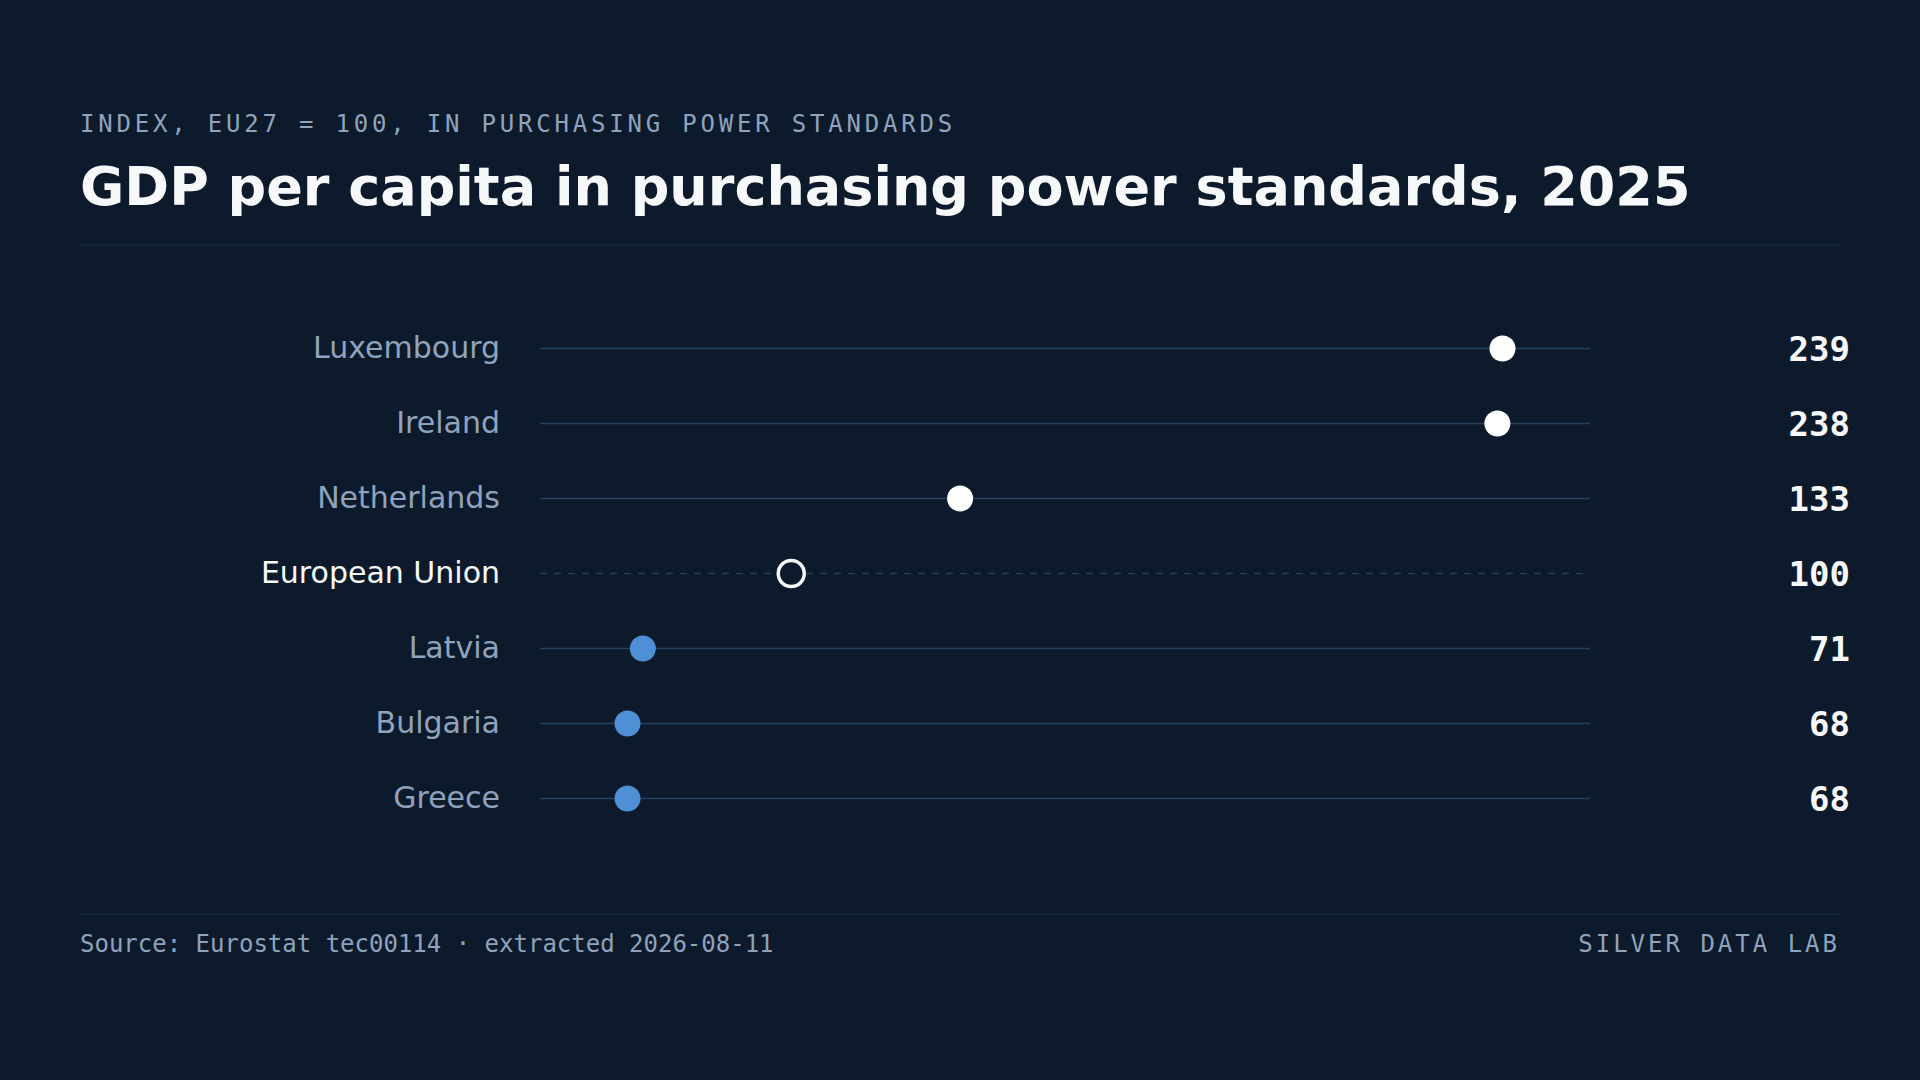
GDP per Head Makes Luxembourg and Ireland Look Richer Than They Are
Luxembourg records 239 and Ireland 238 against an EU average of 100 — more than double the Union's output per head.
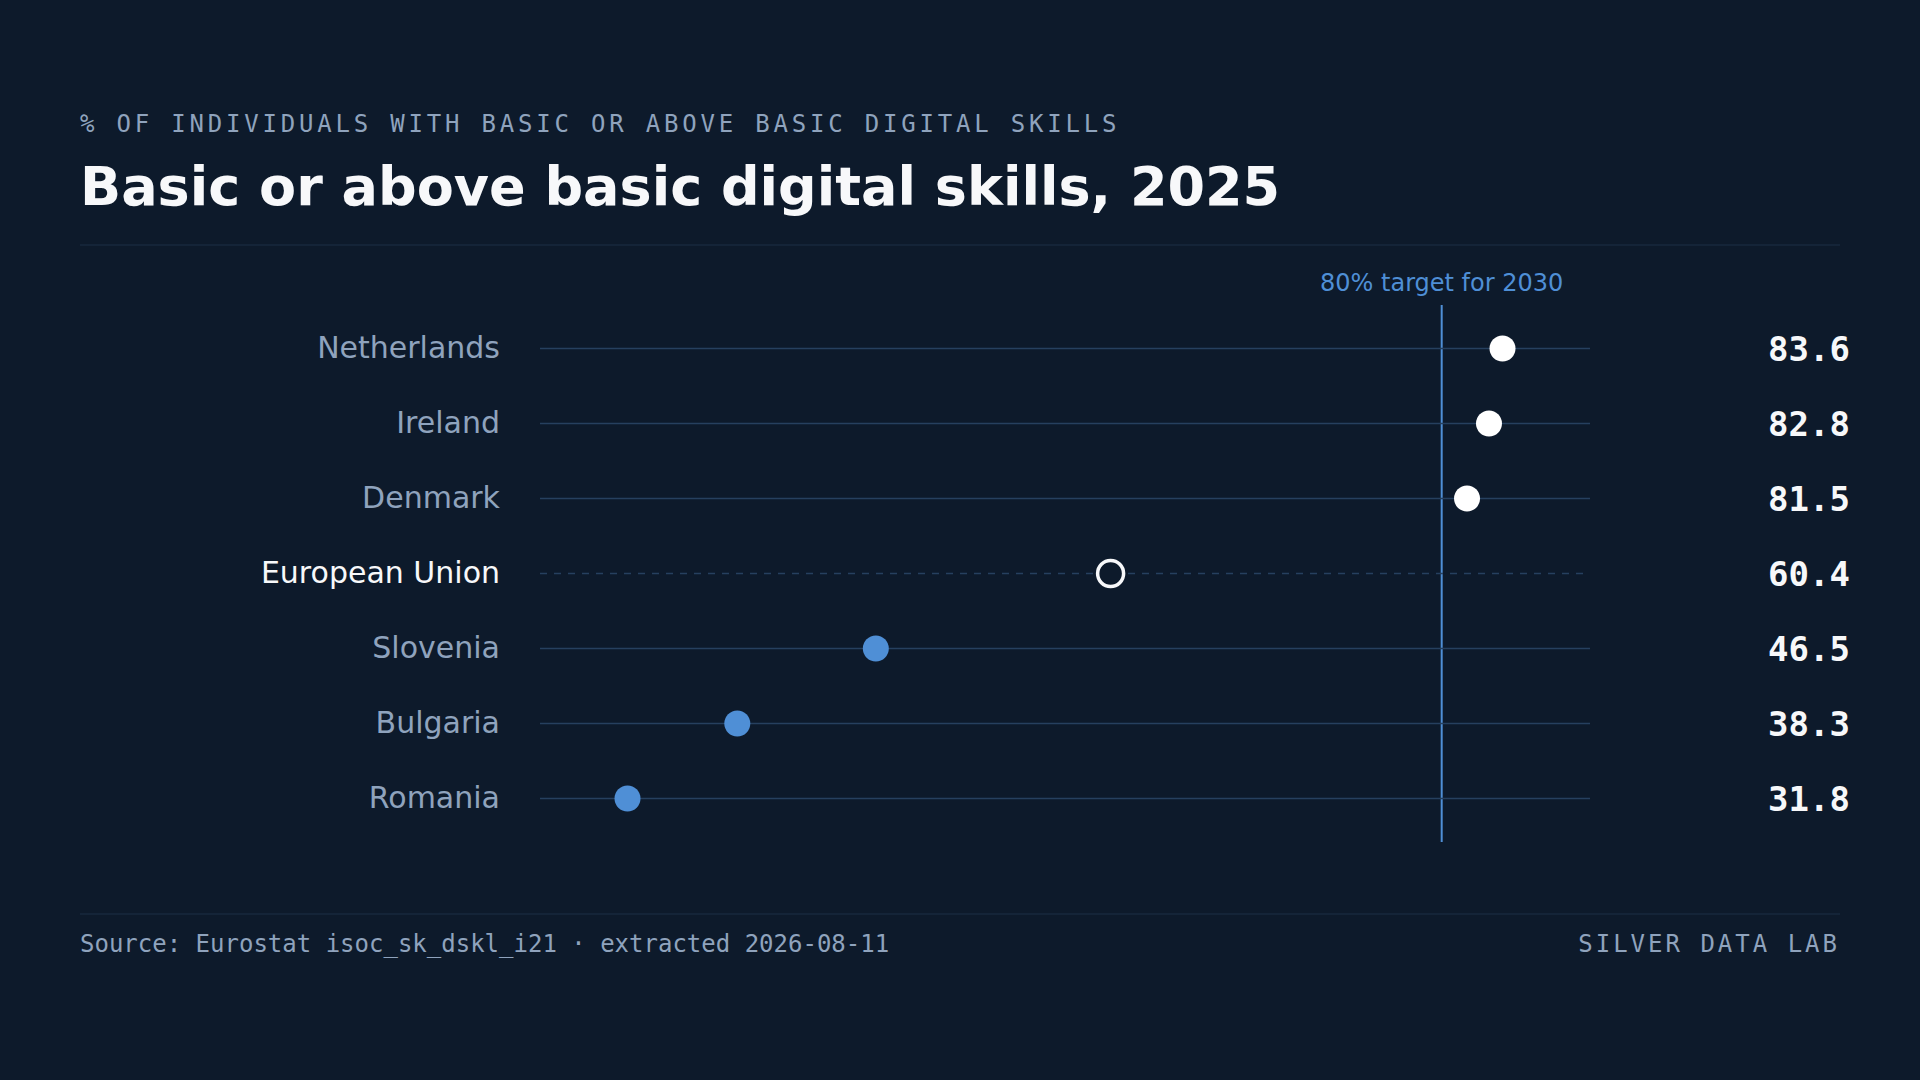
In Four EU Countries, Over 80% of People Have Basic Digital Skills
60.4% of people in the EU had at least basic overall digital skills in 2025, against the 80% the Union targets for 2030.
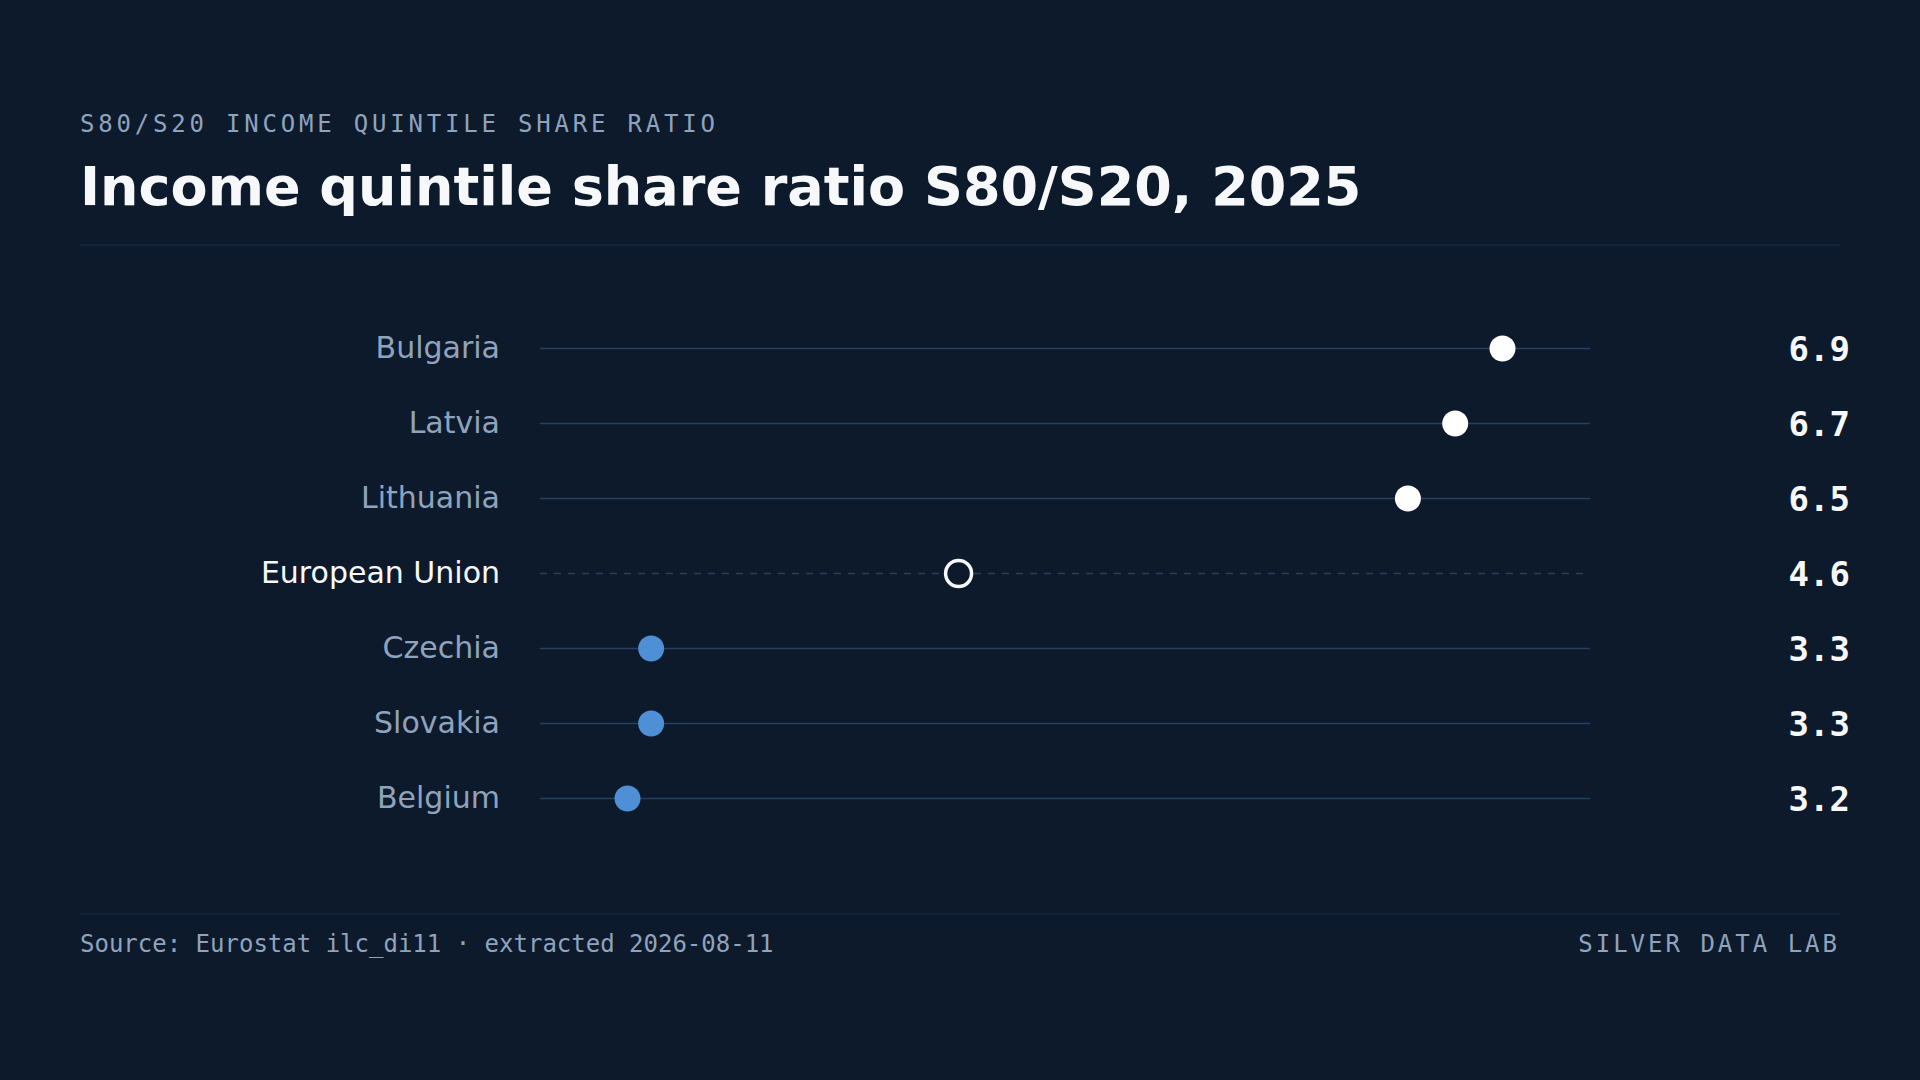
Bulgaria Has the EU's Widest Gap Between Rich and Poor
Across the EU, the richest fifth of the population received 4.6 times the income of the poorest fifth in 2025.
Studies where the same country leads or trails
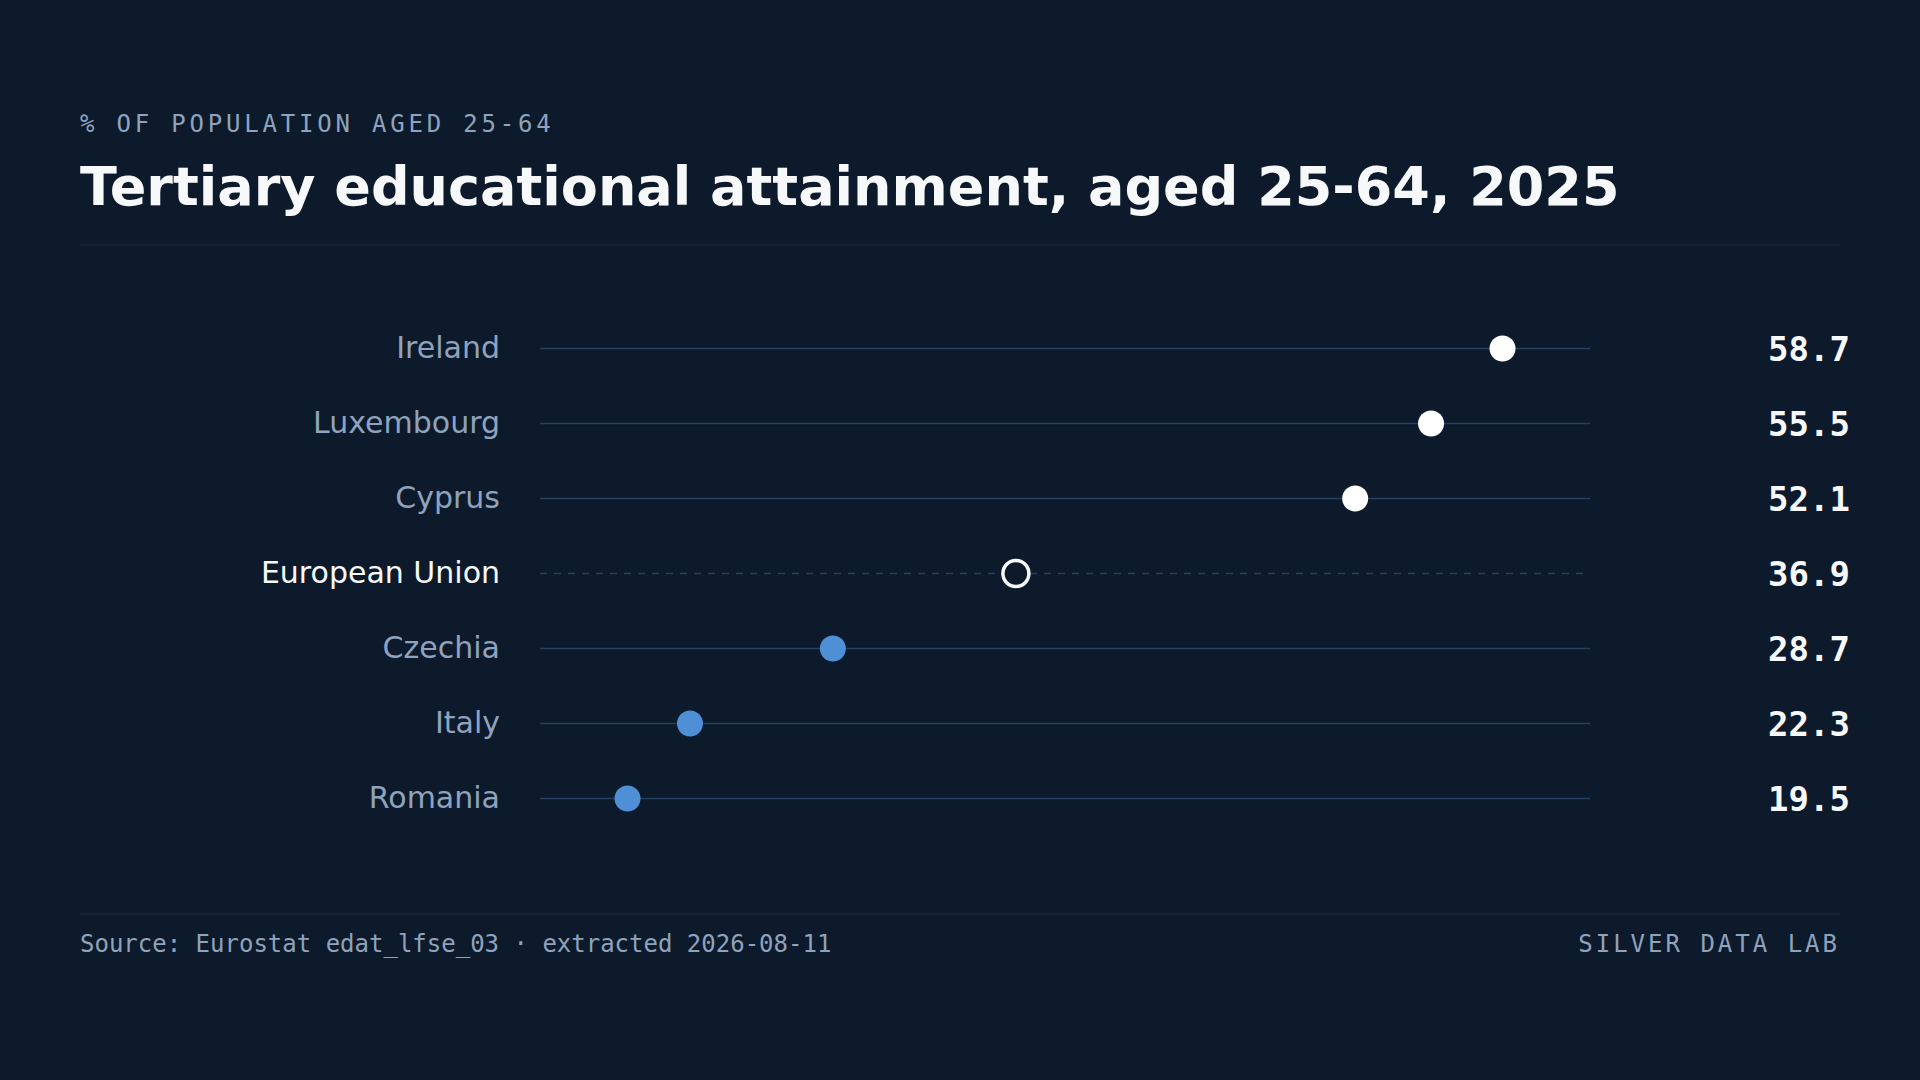
A Degree Is Three Times as Common Among Adults in Ireland as in Romania
36.9% of people aged 25 to 64 in the EU held a tertiary qualification in 2025.
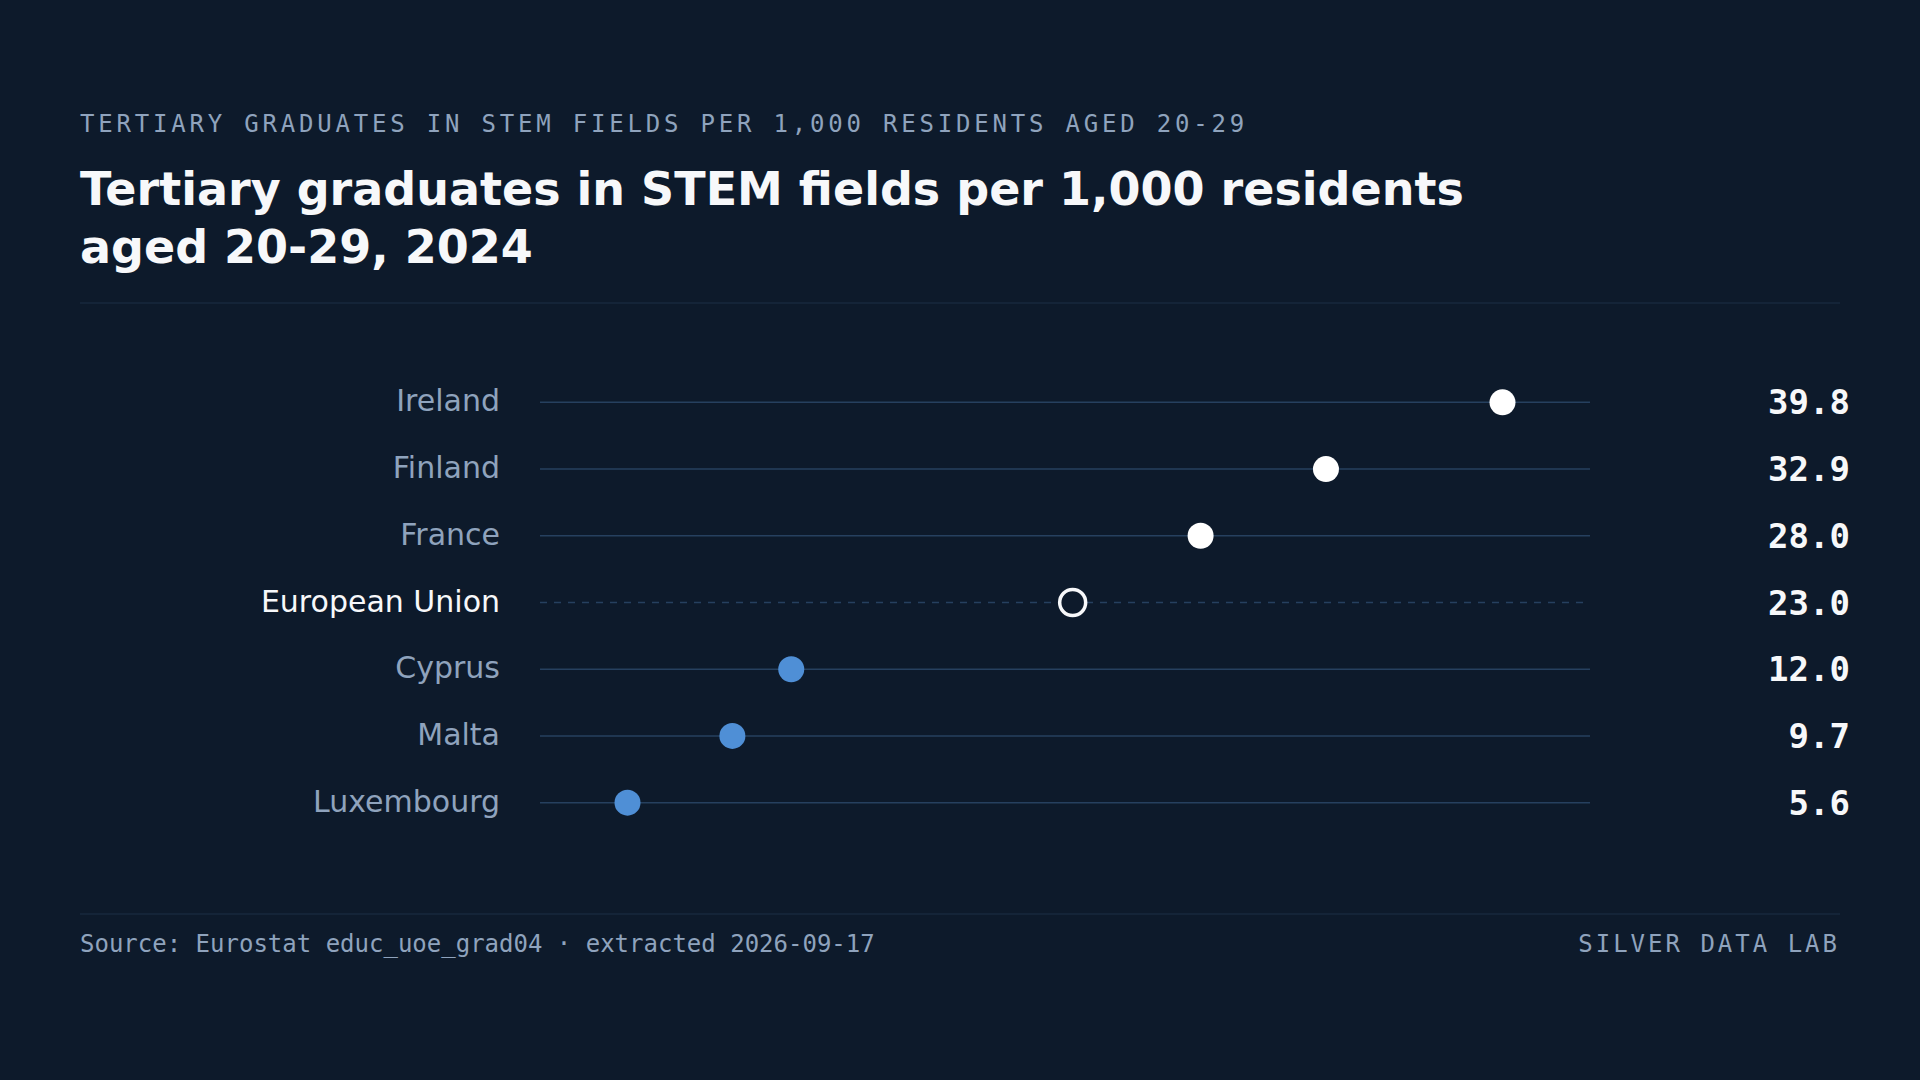
In No EU Country Do Women Graduate in STEM as Often as Men
In 2024 the EU produced 23.0 tertiary graduates in science, mathematics, computing, engineering, manufacturing and construction for every 1,000 residents aged 20 to 29.
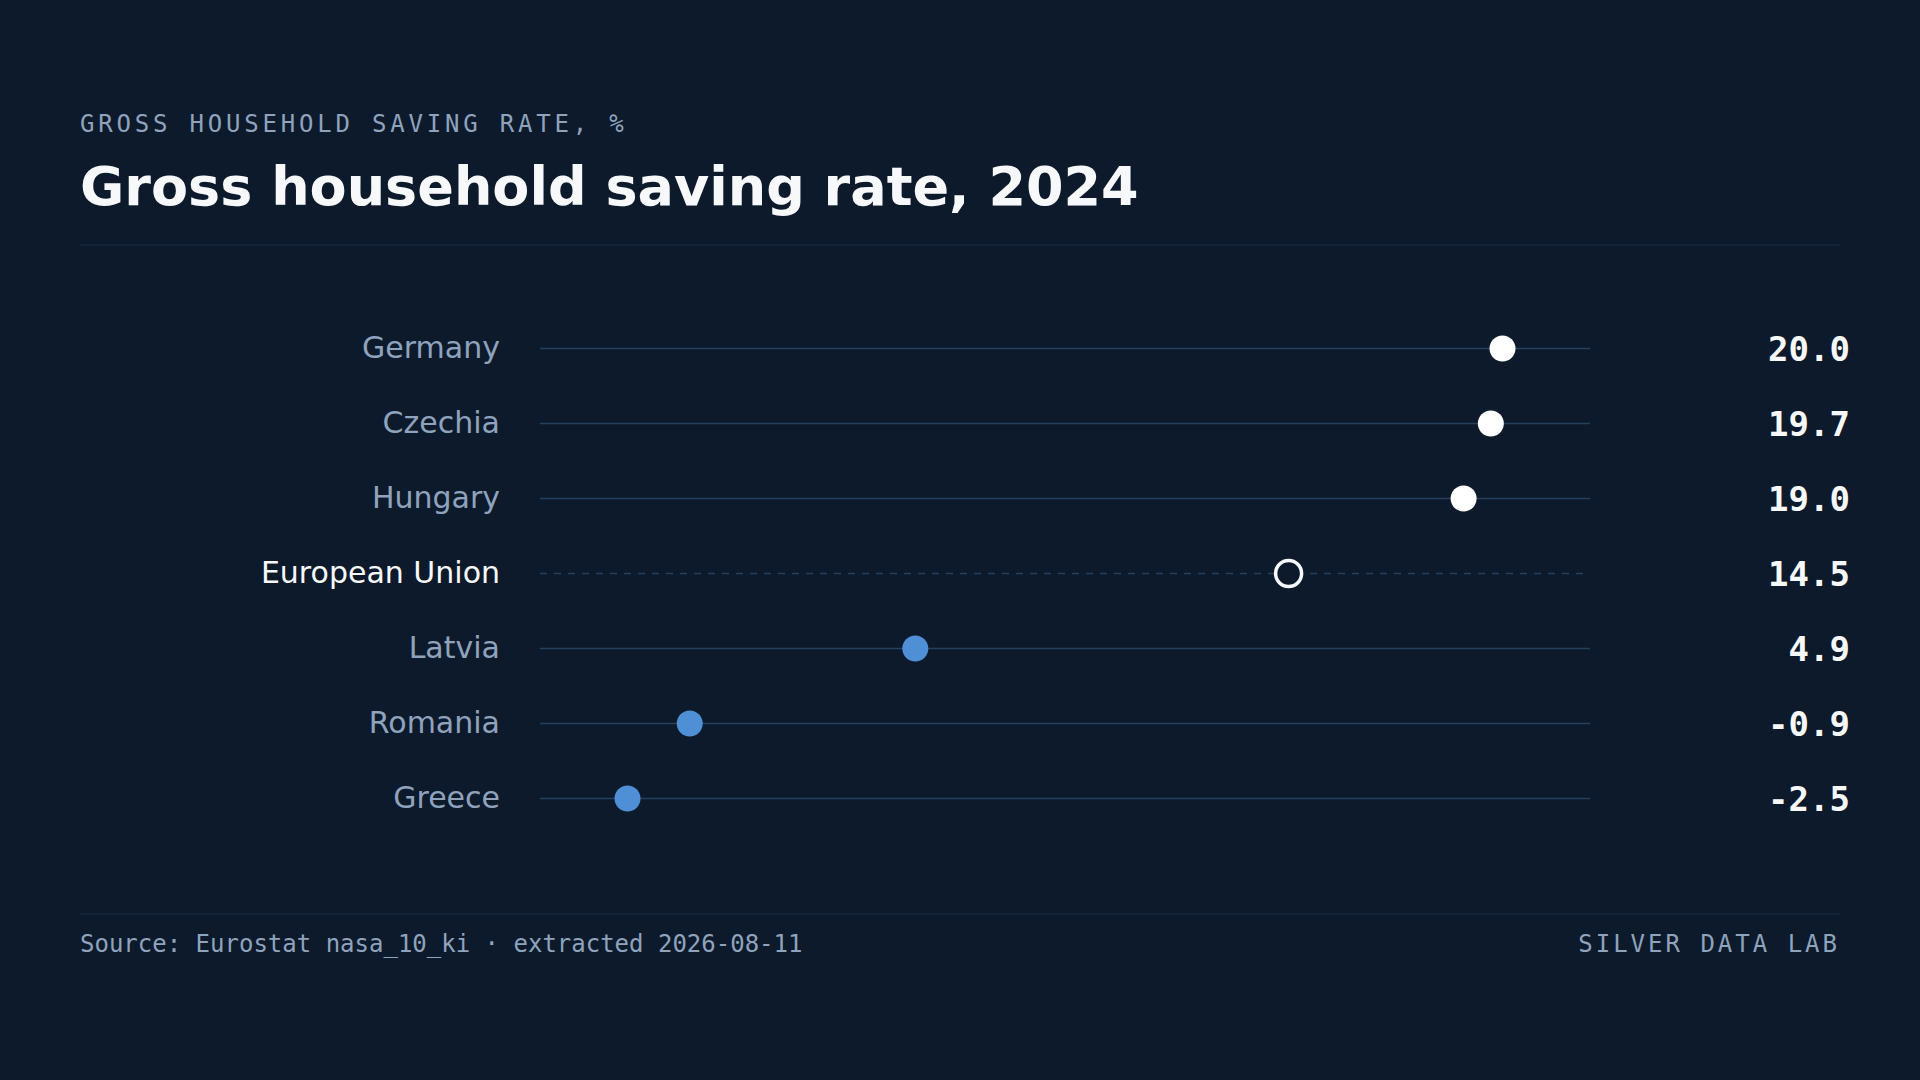
In Two EU Countries, Households Spend More Than They Earn
EU households saved 14.5% of their gross disposable income in 2024.