Mortgage Rates in Latvia Are More Than Twice Those in Malta
Silver Data Lab Research Desk · Statistical analysis · Published on 04 August 2026
This study is open to members only
Its sources, filters and extraction date are declared above, as they are for every study. Sign in to read the analysis in full.
- Data source
- European Central Bank
- Reference period
- August 2026
- Last updated
- 11 October 2026
Re-checked against the source on 02 October 2026. No value in its datasets has moved between the snapshots we hold. Every revision we have observed →
Key estimates
- A household taking out a new mortgage pays 4.39% in Latvia and 1.91% in Malta — 248 basis points apart, or 2.3 times the price.
- The euro area average is 3.60%. Eight of the twenty-one countries sit above it and thirteen below.
- Germany, the largest economy, is the fourth most expensive at 4.01%.
- Maltese mortgage rates are exactly where they were in August 2021, after a tightening cycle that raised the euro area average by 230 basis points.
- German rates rose 274 basis points over the same period, the largest increase of any euro-area country except Slovakia.
- The gap between the most and least expensive country reached 401 basis points in September 2023, when ECB rates peaked.
Two households, two prices, one currency
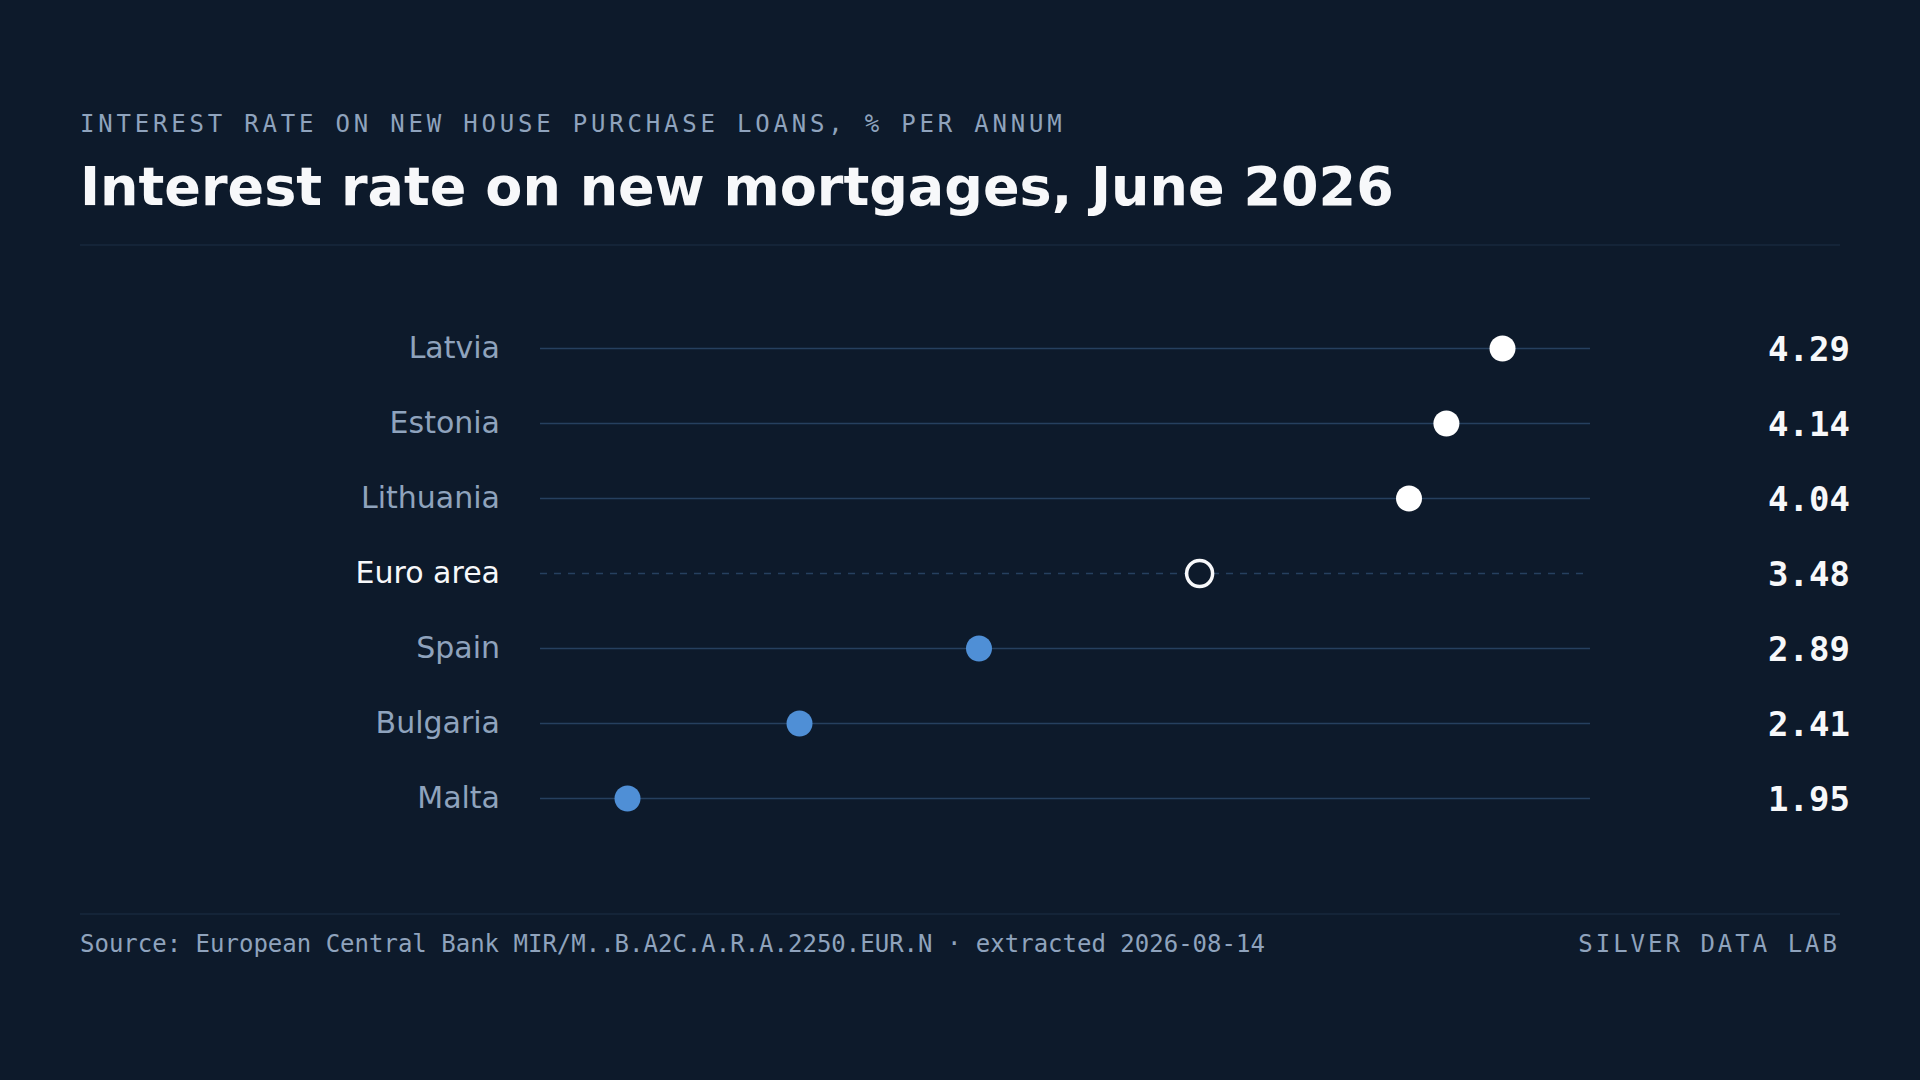
In August 2026 a household borrowing to buy a home paid 4.39% in Latvia and 1.91% in Malta. The Latvian household pays 2.3 times the Maltese rate for the same product, denominated in the same currency, in a union with a single central bank.
The euro area average is 3.60%, and the distribution around it is 248 basis points wide.
Malta did not participate in the tightening
Between August 2021 and August 2026 the ECB raised its deposit rate from −0.50% to a peak of 4.00% before easing to 2.25%. Euro-area mortgage rates rose 230 basis points on average across that period.
Maltese mortgage rates did not move at all.
The Maltese figure was 1.91% in August 2021, 1.93% at the September 2023 peak in ECB rates, and 1.91% in August 2026. Through the sharpest tightening cycle in the currency's history, the price of a Maltese mortgage came back to the hundredth of a point it started from.
Bulgaria is the only country lower than it was, at 77 basis points below its 2021 level — but Bulgaria spent most of that period outside the euro, joining on 1 January 2026, so its rates were not set under ECB policy for most of the comparison.
The largest economy is among the most expensive
Germany records 4.01%, the fourth highest rate in the euro area, behind only Latvia, Estonia and Lithuania. German rates rose 274 basis points from their 2021 level, more than any other country except Slovakia.
This is the opposite of what the same countries look like in business lending. On loans to companies, Germany, France, Italy and Spain all sit within 8 basis points of the euro area average, as the companion study on this site records. On mortgages they are spread across 97 basis points: Germany 4.01%, Italy 3.55%, France 3.20%, Spain 3.04%.
Household credit is priced far less uniformly across the union than corporate credit is.
The gap is wide, and it has been wider
At the September 2023 peak the distance between the most and least expensive country was 401 basis points, with Estonia at 5.94% and Malta at 1.93%. In December 2021, before the cycle began, it was 191 among the countries then in the euro area.
The dispersion is therefore not a residue of the tightening: it existed before, widened sharply during, and remains at 248 basis points now that policy has eased.
What this measures
The rate on new house purchase loans agreed in the reference month, as reported by banks to the ECB. It does not measure what existing borrowers pay, and it does not distinguish between fixed and variable-rate lending — a country whose mortgages are predominantly fixed will show current rates responding slowly to policy changes, while a variable-rate market transmits them almost immediately.
That distinction plausibly explains part of the pattern above. This data cannot confirm it, and no causal claim is made here.
Interest rate on new mortgages, August 2026
| Country | % per annum | Gap to Euro areapercentage points, derived |
|---|---|---|
| Latvia | 4.39 | +0.8 |
| Estonia | 4.26 | +0.7 |
| Lithuania | 4.16 | +0.6 |
| Euro areaaggregate | 3.60 | — |
| Croatia | 2.91 | −0.7 |
| Bulgaria | 2.42 | −1.2 |
| Malta | 1.91 | −1.7 |
This table as data: CSV · JSON
Every Member State for this indicator+
Members see every Member State for this indicator here, not only the rows the ranking prints. Become a Member
What these figures cannot tell you
- Fixed and variable lending are not separated
- The series covers all new house purchase loans regardless of rate fixation. Countries where fixed-rate mortgages dominate transmit policy changes to new lending differently from variable-rate markets, and this figure does not distinguish them.
- New lending only
- The rate applies to mortgages agreed in the reference month. It says nothing about the much larger stock of existing mortgages, where the rate paid may have been set years earlier.
- Bulgaria's comparison period straddles euro entry
- Bulgaria adopted the euro on 1 January 2026. Its rates before that date were set under its own currency board arrangement rather than ECB policy, so its change since 2021 is not comparable with that of long-standing members.
- The average is volume-weighted
- The euro area figure of 3.60% weights each country by lending volume and is therefore dominated by the largest mortgage markets. It is not the average of the twenty-one national rates.
- Prices, not causes
- The data records rates charged. Rate fixation practice, bank concentration, credit risk, property collateral values and household indebtedness may all contribute, and this series cannot separate them.
Frequently asked questions
- Where are mortgages cheapest in the euro area?
- Malta, at 1.91% on new house purchase loans in August 2026, followed by Bulgaria at 2.42% and Croatia at 2.91%. The most expensive is Latvia at 4.39%.
- Why do mortgage rates differ so much between euro-area countries?
- The ECB sets one policy rate, but banks price mortgages nationally. Rate fixation practice, bank concentration, credit risk and collateral values plausibly all contribute. This study records the 248 basis point spread rather than attributing it to any single cause.
- How much did mortgage rates rise during the ECB tightening cycle?
- The euro area average rose 230 basis points between August 2021 and August 2026. Individual countries ranged from Slovakia at 276 and Germany at 274 to Malta, where rates ended exactly where they started — and Bulgaria below where it started, though it spent most of the period outside the euro.
- Are German mortgages expensive?
- By euro-area standards, yes. Germany records 4.01%, the fourth highest rate of the twenty-one countries, and its increase of 274 basis points since 2021 is the second largest in the union.
- Is this the rate existing borrowers pay?
- No. The series covers mortgages agreed in the reference month. Existing borrowers pay the rate set when their loan was agreed, which in fixed-rate markets can differ substantially from current conditions.
Methodological note
The ECB publishes MFI interest rate statistics through the ECB Data Portal. This study uses the rate on new loans to households for house purchase, excluding revolving loans and overdrafts, all maturities and all loan sizes, as published, for August 2026 — the most recent month available at extraction. All twenty-one euro-area countries report a value.
The 248 basis point spread, the 2.3 ratio between Latvia and Malta, the counts above and below the average, the changes since August 2021, and the spreads for December 2021 and September 2023 are derived by Silver Data Lab from the published series. The euro area aggregate is the published figure, not a computed one.
ECB policy rates quoted for context come from the key interest rates study on this site, and the business lending comparison from the euro-area business lending rates study, both drawing on their own declared extractions.
Source data
The underlying series can be inspected and re-downloaded from the ECB Data Portal. The filters below are the ones applied.
MFI interest rates on new loans to households for house purchase
MIR/M..B.A2C.A.R.A.2250.EUR.N
- Filters applied:
- freq=M · ref_area=all euro-area countries and U2 aggregate · bs_rep_sector=B · bs_item=A2C (lending for house purchase excluding revolving loans and overdrafts) · maturity=A (total) · data_type_mir=R (annualised agreed rate) · amount_cat=A (total) · bs_count_sector=2250 (households) · currency=EUR · ir_bus_cov=N (new business)
- Extracted:
- 2026-10-02
- Source last updated:
- 2026-08-01
Download the data
The data the study you have just read is built on, exactly as it was downloaded and archived.
Yours as a Member.
Data downloadable by Members
How to cite
Record the vintage as well as the study: the figures on this page are the ones extracted on the dates below.
Silver Data Lab Research Desk (2026). Mortgage Rates in Latvia Are More Than Twice Those in Malta. Silver Data Lab, published 04 August 2026, last updated 11 October 2026. https://www.silverdatalab.com/studies/mortgage-rates-in-the-euro-area
- Data: European Central Bank, MFI interest rates on new loans to households for house purchase (MIR/M..B.A2C.A.R.A.2250.EUR.N), filters freq=M, ref_area=all euro-area countries and U2 aggregate, bs_rep_sector=B, bs_item=A2C (lending for house purchase excluding revolving loans and overdrafts), maturity=A (total), data_type_mir=R (annualised agreed rate), amount_cat=A (total), bs_count_sector=2250 (households), currency=EUR, ir_bus_cov=N (new business); extracted 2026-10-02; source last updated 2026-08-01. https://data.ecb.europa.eu/data/datasets/MIR
Silver Data Lab's analysis is licensed CC BY 4.0. The statistics remain their publisher's and keep its terms of reuse.
Ask the research desk
A question about this study — a definition, a filter, a break in the series, what the figures can and cannot support — answered by the desk that made the extraction.
Members can write to the research desk
Studies where the same country leads or trails
Austria Already Farms a Quarter of Its Farmland Organically
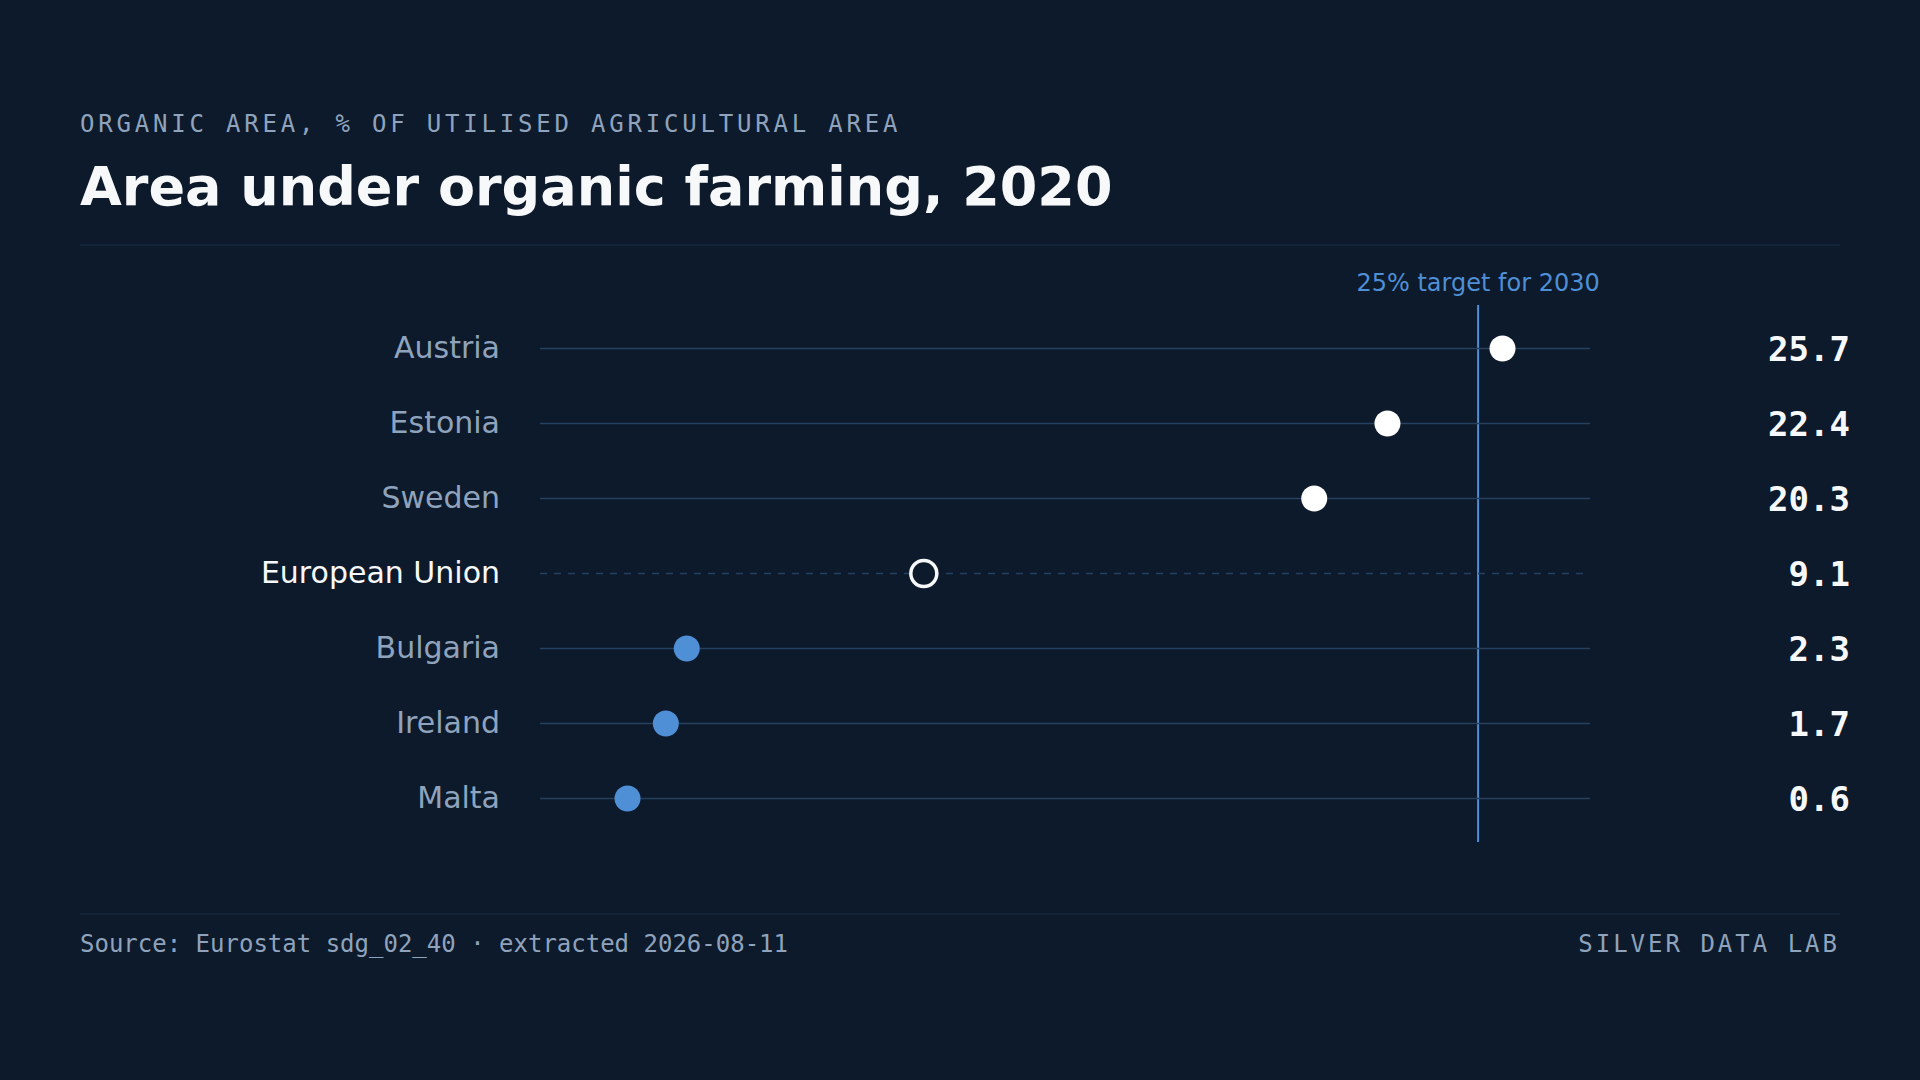
9.1% of the EU's utilised agricultural area was under organic management in 2020, against a target of 25% by 2030.
In No EU Country Are Enough Babies Born to Replace Their Parents
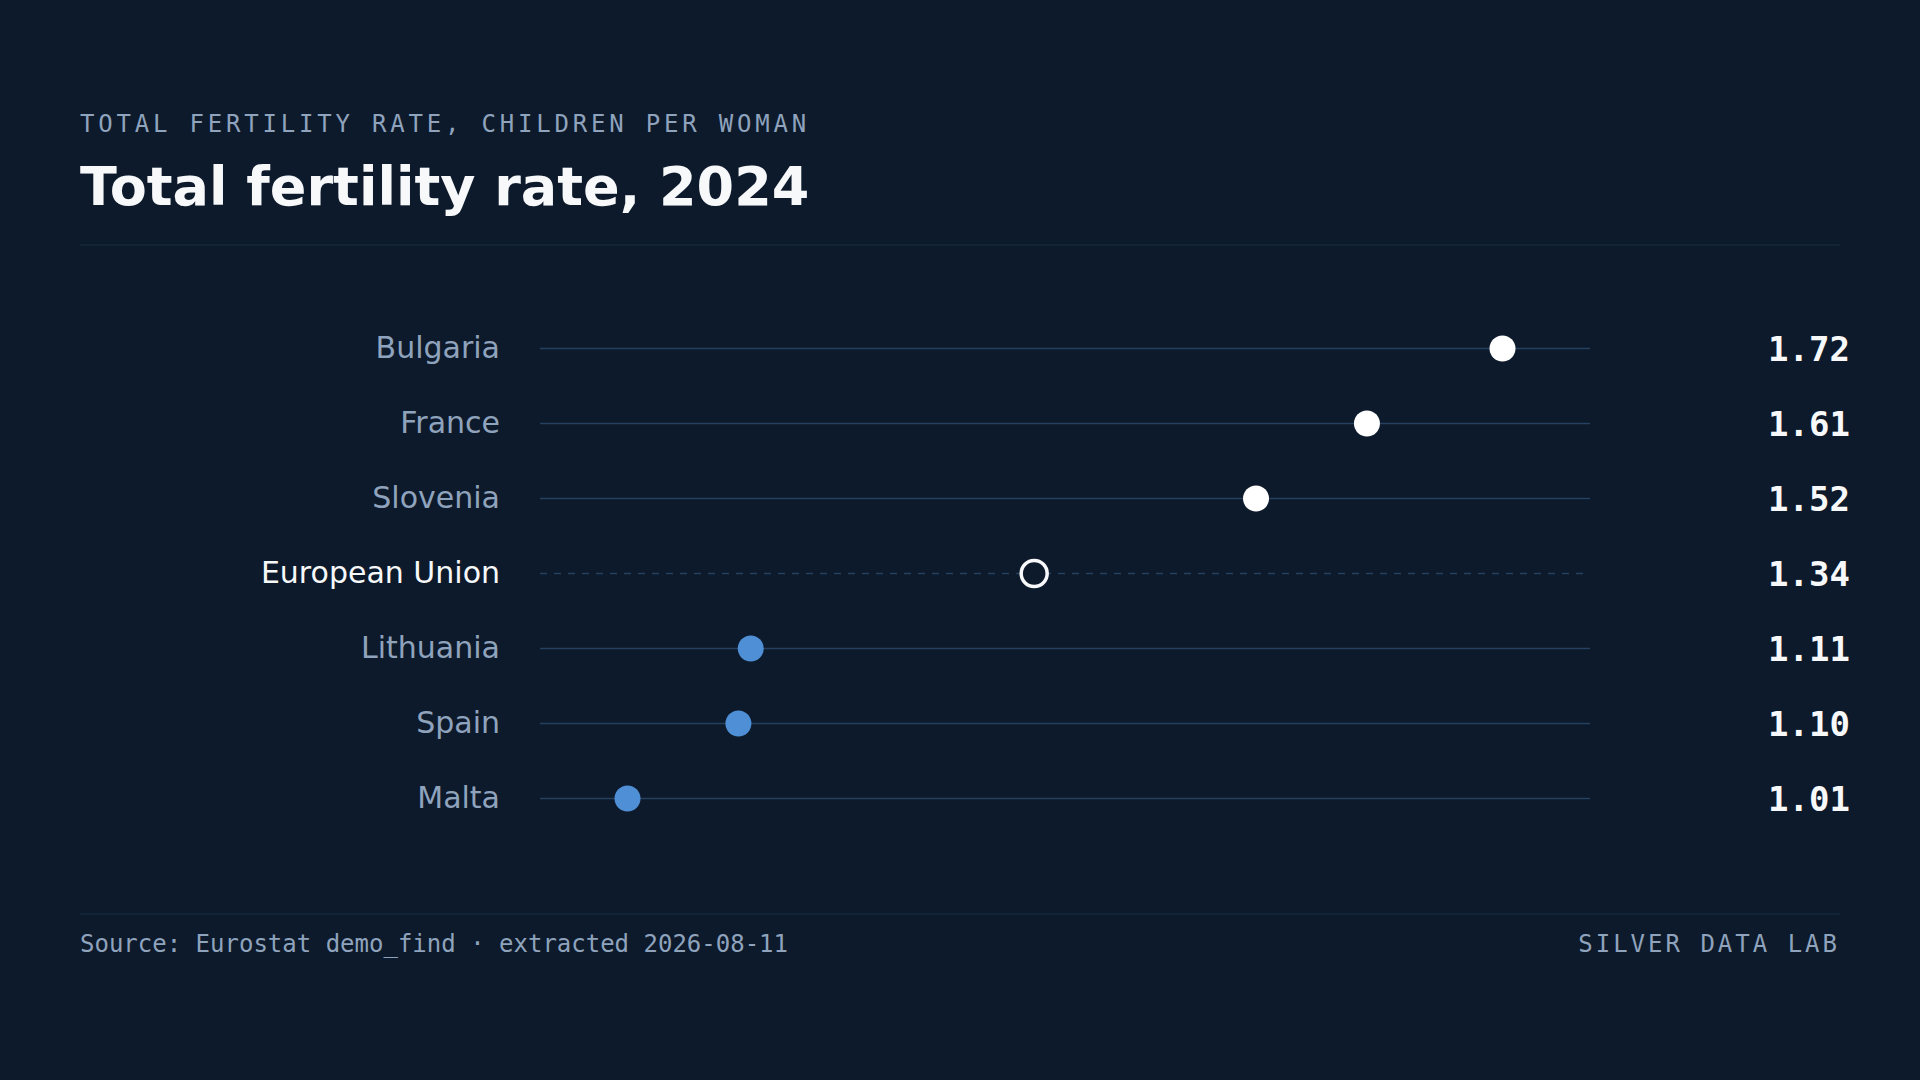
The EU total fertility rate was 1.34 children per woman in 2024, against the 2.1 conventionally taken as replacement level.
More Than One Latvian in Nine Lives in a Crowded, Run-Down Home
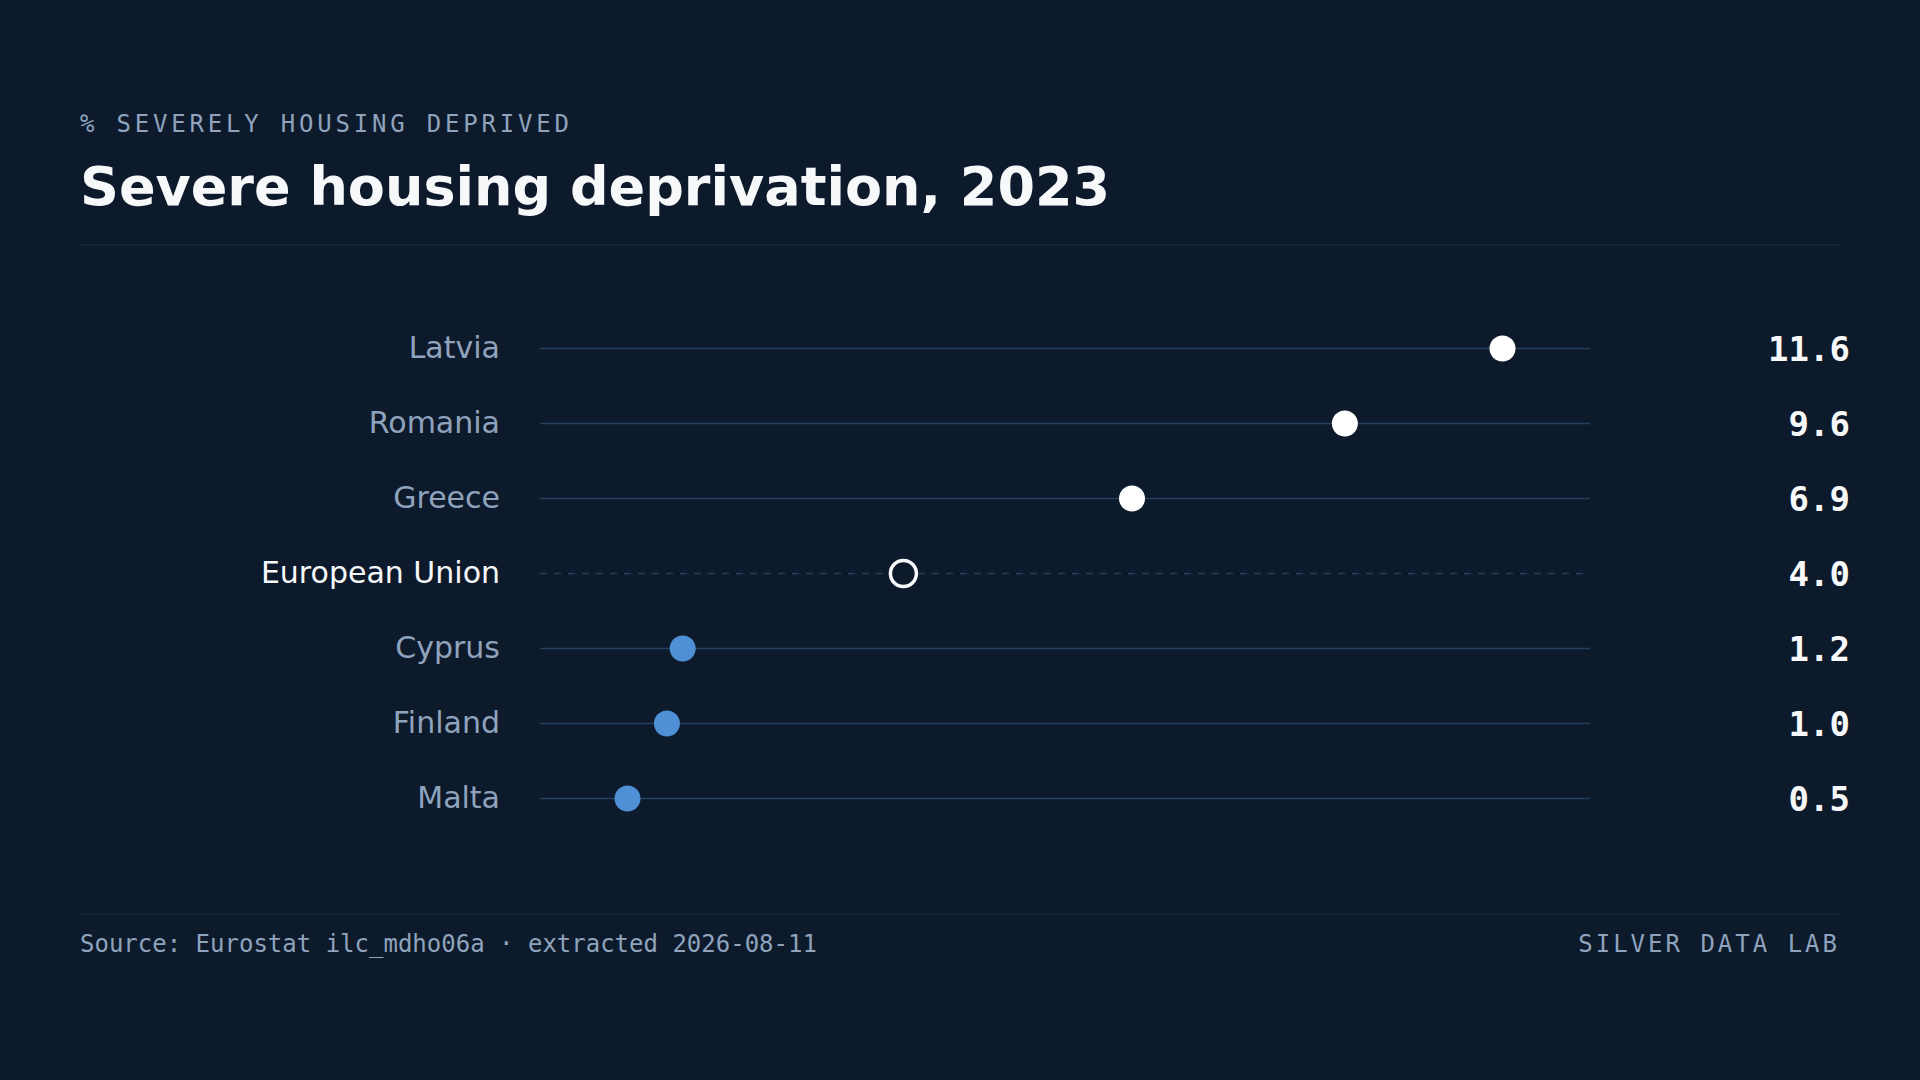
4.0% of the EU population lived in severely deprived housing in 2023.