One in Nine Young Europeans Is Neither Working Nor Studying
Silver Data Lab Research Desk · Statistical analysis · Published on 14 June 2026
This study is open to members only
Its sources, filters and extraction date are declared above, as they are for every study. Sign in to read the analysis in full.
- Data source
- Eurostat
- Reference period
- 2025
- Last updated
- 05 October 2026
Re-checked against the source on 11 September 2026. 1 values in its datasets moved between snapshots; none is a figure stated on this page. Every revision we have observed →
Key estimates
- 11.0% of people aged 15 to 29 in the EU were neither in employment nor in education or training in 2025.
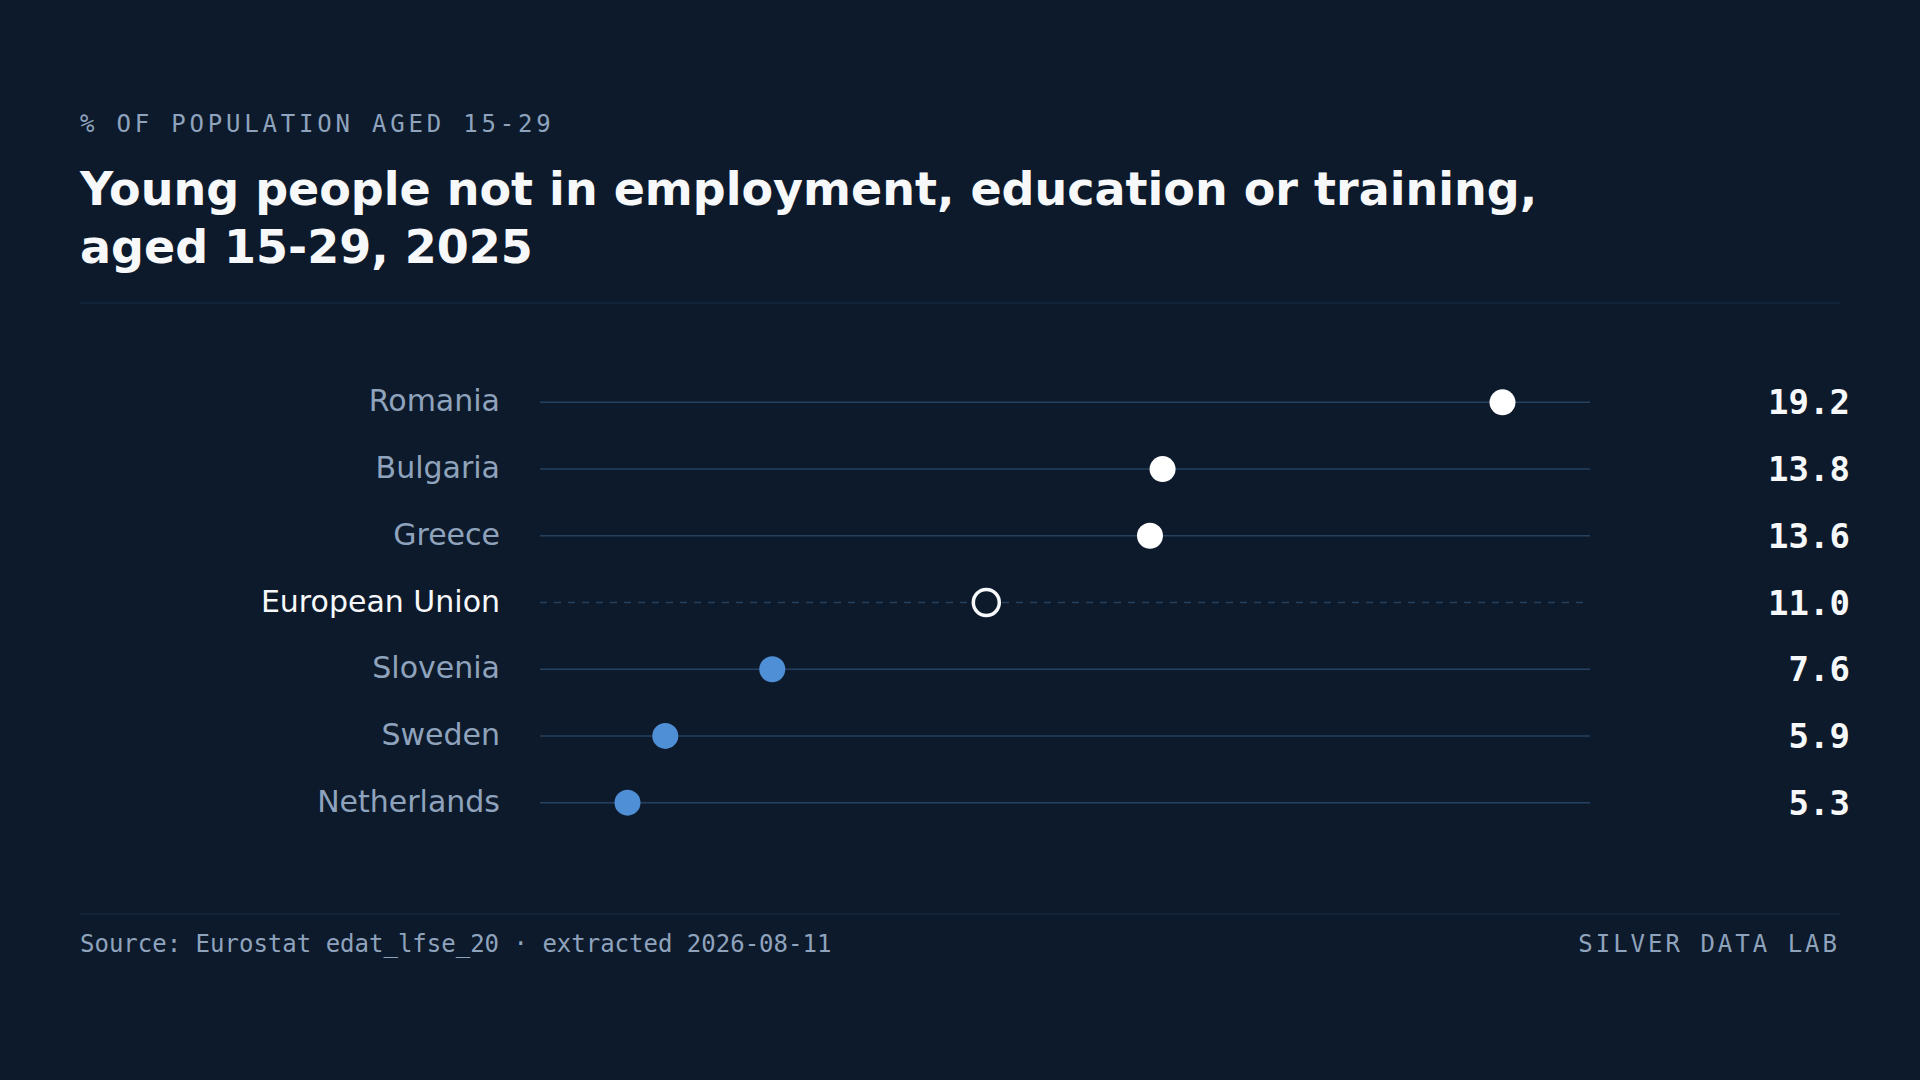
- Romania records 19.2%, the highest in the Union, ahead of Bulgaria at 13.8% and Greece at 13.6%.
- The Netherlands records 5.3%, Sweden 5.9% and Slovenia 7.6%.
- Italy at 13.3%, France at 12.9% and Spain at 11.5% are the large economies above the EU figure.
- The measure counts inactivity as well as unemployment, so it captures young people who are not looking for work.
The measure that catches what unemployment misses
Youth unemployment counts young people who are out of work and actively looking. It excludes anyone who has stopped looking, and it excludes students entirely — which means a country can post a low unemployment rate while a substantial share of its young population is doing nothing at all.
The NEET rate closes that gap. It counts everyone aged 15 to 29 who is not in employment and not in education or training, whether they are searching for work or not.
Across the EU, 11.0% of that age group were NEET in 2025 — roughly one young European in nine.
Where disengagement is highest
Romania records 19.2%, the highest in the Union: nearly one in five. Bulgaria follows at 13.8%, Greece at 13.6%, Italy at 13.3% and France at 12.9%.
Italy and France in that group are the finding, and Spain at 11.5% belongs with them — with the caveat set out below, which works against rather than for the comparison: France and Spain count some workers on temporary lay-off as employed, which holds their NEET rates down. All three are among the Union's largest economies, and all three sit above an average held up by considerably poorer Member States. Poland records 9.2%, Czechia 8.0% and Portugal 8.0% — all below the three despite lower incomes.
Where young people are engaged
The Netherlands records 5.3%, Sweden 5.9%, Slovenia 7.6% and Portugal and Czechia 8.0%.
The Dutch and Swedish figures are less than half the Romanian one, and both countries combine them with high rates of student employment, which keeps young people inside the employment category while studying.
Why NEET and youth unemployment disagree
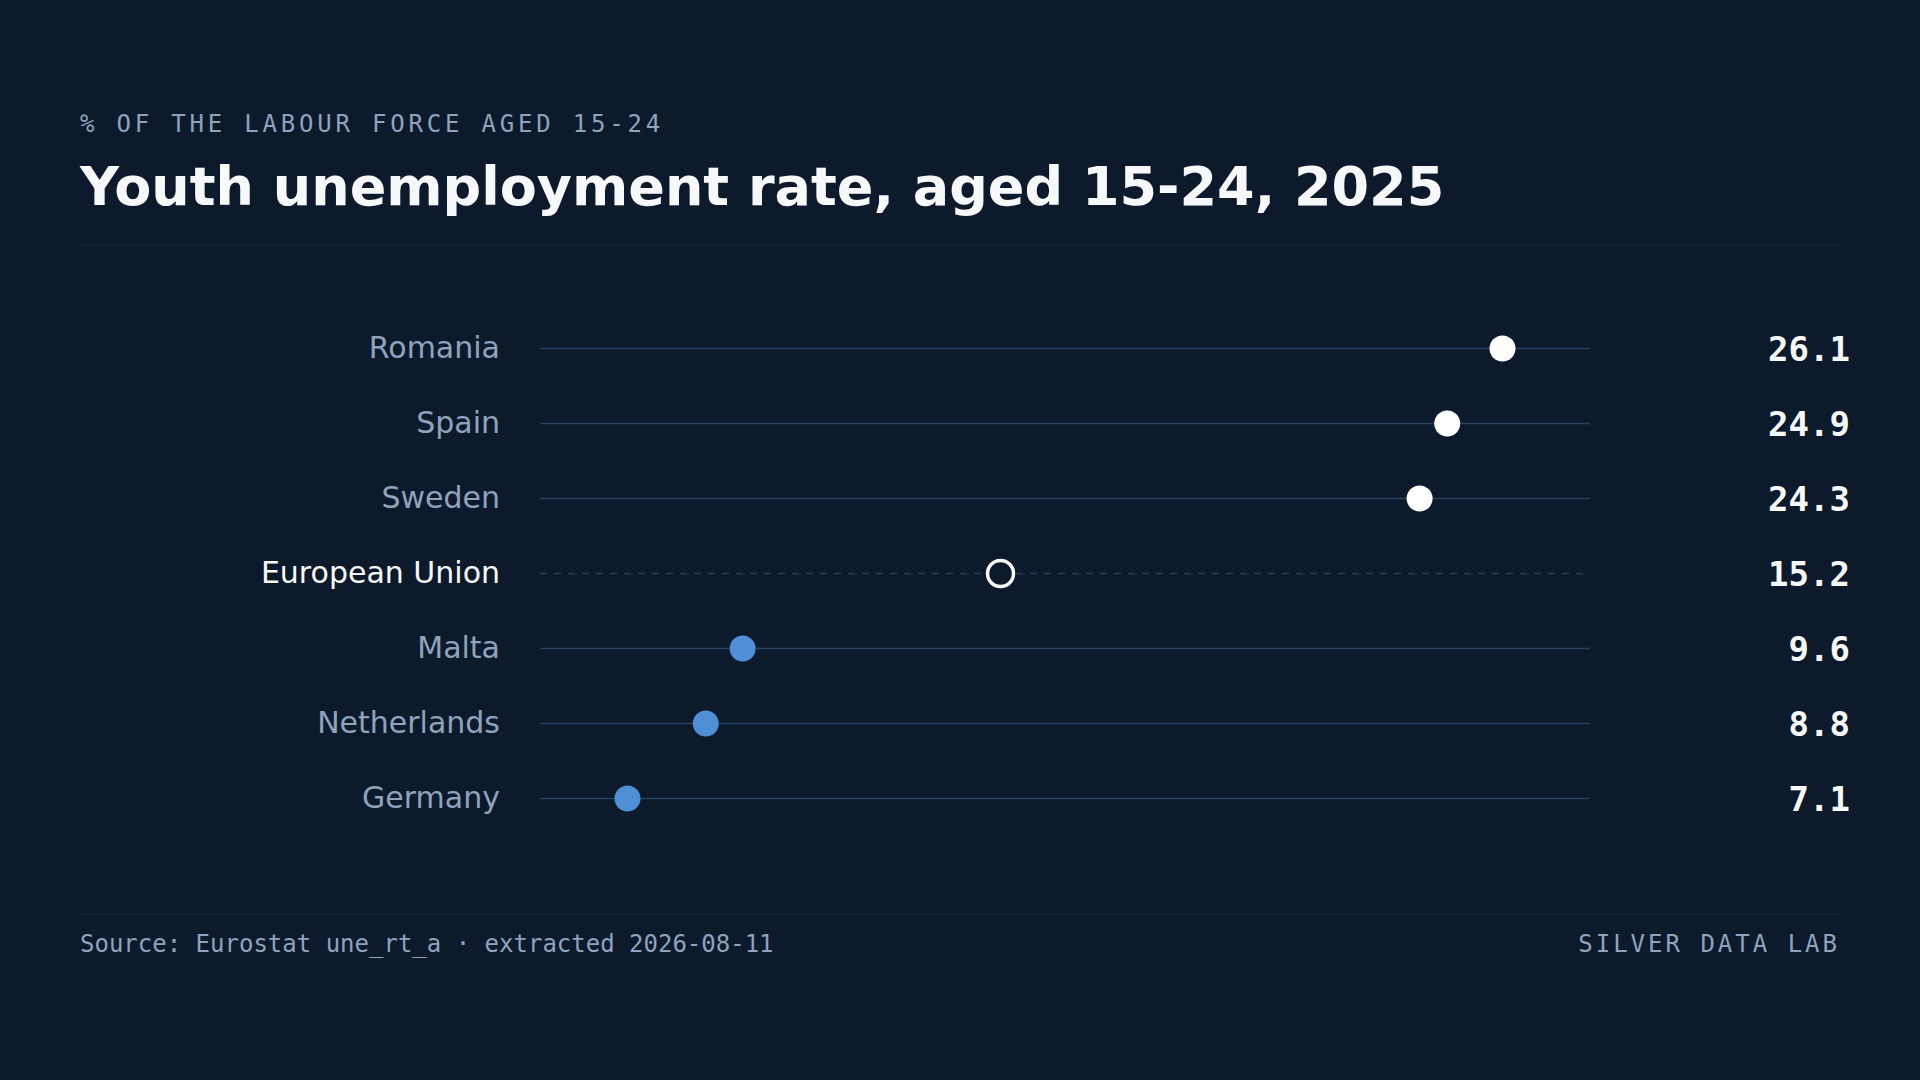
Sweden records a NEET rate of 5.9% and a youth unemployment rate of 24.3% — the third highest in the Union. Those two facts are not in conflict, and the reason is a definitional one worth stating plainly.
Youth unemployment is expressed as a share of the labour force, not of the population. In countries where most young people are students, the labour force is small, and the students who do look for part-time work while studying dominate it. A high youth unemployment rate in that setting describes a small denominator rather than widespread joblessness.
NEET uses the whole population as its denominator and does not have that problem. Where the two disagree, NEET is generally the more informative figure about how many young people are disengaged.
Young people not in employment, education or training, aged 15-29, 2025
| Country | % of population aged 15-29 | Gap to EU averagepercentage points, derived |
|---|---|---|
| Romania | 19.2 | +8.2 |
| Bulgaria | 13.8 | +2.8 |
| Greece | 13.6 | +2.6 |
| European Unionaggregate | 11.0 | — |
| Slovenia | 7.6 | −3.4 |
| Sweden | 5.9 | −5.1 |
| Netherlands | 5.3 | −5.7 |
This table as data: CSV · JSON
Every Member State for this indicator+
Members see every Member State for this indicator here, not only the rows the ranking prints. Become a Member
What these figures cannot tell you
- A wide age band
- Fifteen to twenty-nine covers school age, university age and early career. A country with long tertiary education will have a different composition of NEETs from one where young people enter work at eighteen, and the single rate does not distinguish them.
- Not all NEETs are the same
- The measure combines young people looking for work, young people caring for family, young people who are ill, and young people doing nothing by choice. Policy responses to those groups differ entirely and the headline rate cannot separate them.
- Informal training is excluded
- Only formal and non-formal education and training count. Someone learning independently or in an unrecognised programme is classified as NEET.
- Two of the countries named here count employment differently
- Eurostat marks the French and Spanish values as departing from the common definition, and the labour force survey's own comparability note says what departs: both still apply the older test of job attachment to employees on temporary lay-off, counting them as employed where the Regulation that now governs the survey would not. Because NEET counts those not in employment, a wider employment definition lowers the rate — so the French and Spanish figures understate their distance above the EU average rather than exaggerating it.
- Survey based
- Figures come from the labour force survey and are estimates from samples rather than counts.
Frequently asked questions
- What does NEET mean?
- Not in employment, education or training. The measure counts young people who are neither working nor studying, whether or not they are looking for work, which is why it captures disengagement that unemployment statistics miss.
- How many young Europeans are NEET?
- 11.0% of people aged 15 to 29 in 2025 — roughly one in nine. National rates ran from 19.2% in Romania to 5.3% in the Netherlands.
- Which EU country has the highest NEET rate?
- Romania, at 19.2% in 2025, followed by Bulgaria at 13.8% and Greece at 13.6%. Italy at 13.3%, France at 12.9% and Spain at 11.5% are the large economies above the EU figure.
- Why does Sweden have low NEET but high youth unemployment?
- Because the two use different denominators. Youth unemployment is a share of the labour force, which is small in a country where most young people study, and is dominated by students seeking part-time work. NEET is a share of the whole population and does not have that distortion.
Methodological note
The NEET rate is published by Eurostat as the share of the population in a given age band that is not in employment and not in formal or non-formal education or training. This study uses the 15 to 29 band.
Values are for 2025, the most recent year with complete coverage of the 27 Member States at the extraction date.
The comparison with Swedish youth unemployment draws on the companion study in this category, which uses a separate extraction and a different denominator — the labour force rather than the population.
Source data
The underlying series can be inspected and re-downloaded from the Eurostat data browser. The filters below are the ones applied.
Young people neither in employment nor in education and training
edat_lfse_20
- Filters applied:
- freq=A · sex=T · age=Y15-29 · training=NO_FE_NO_NFE · wstatus=NEMP · unit=PC · time=2025
- Extracted:
- 2026-09-11
- Source last updated:
- 2026-09-10
Download the data
The data the study you have just read is built on, exactly as it was downloaded and archived.
Yours as a Member.
Data downloadable by Members
How to cite
Record the vintage as well as the study: the figures on this page are the ones extracted on the dates below.
Silver Data Lab Research Desk (2026). One in Nine Young Europeans Is Neither Working Nor Studying. Silver Data Lab, published 14 June 2026, last updated 05 October 2026. https://www.silverdatalab.com/studies/neet-rate-in-the-eu
- Data: Eurostat, Young people neither in employment nor in education and training (edat_lfse_20), filters freq=A, sex=T, age=Y15-29, training=NO_FE_NO_NFE, wstatus=NEMP, unit=PC, time=2025; extracted 2026-09-11; source last updated 2026-09-10. https://doi.org/10.2908/edat_lfse_20
Silver Data Lab's analysis is licensed CC BY 4.0. The statistics remain their publisher's and keep its terms of reuse.
Ask the research desk
A question about this study — a definition, a filter, a break in the series, what the figures can and cannot support — answered by the desk that made the extraction.
Members can write to the research desk
Other studies on the same dataset
Studies where the same country leads or trails
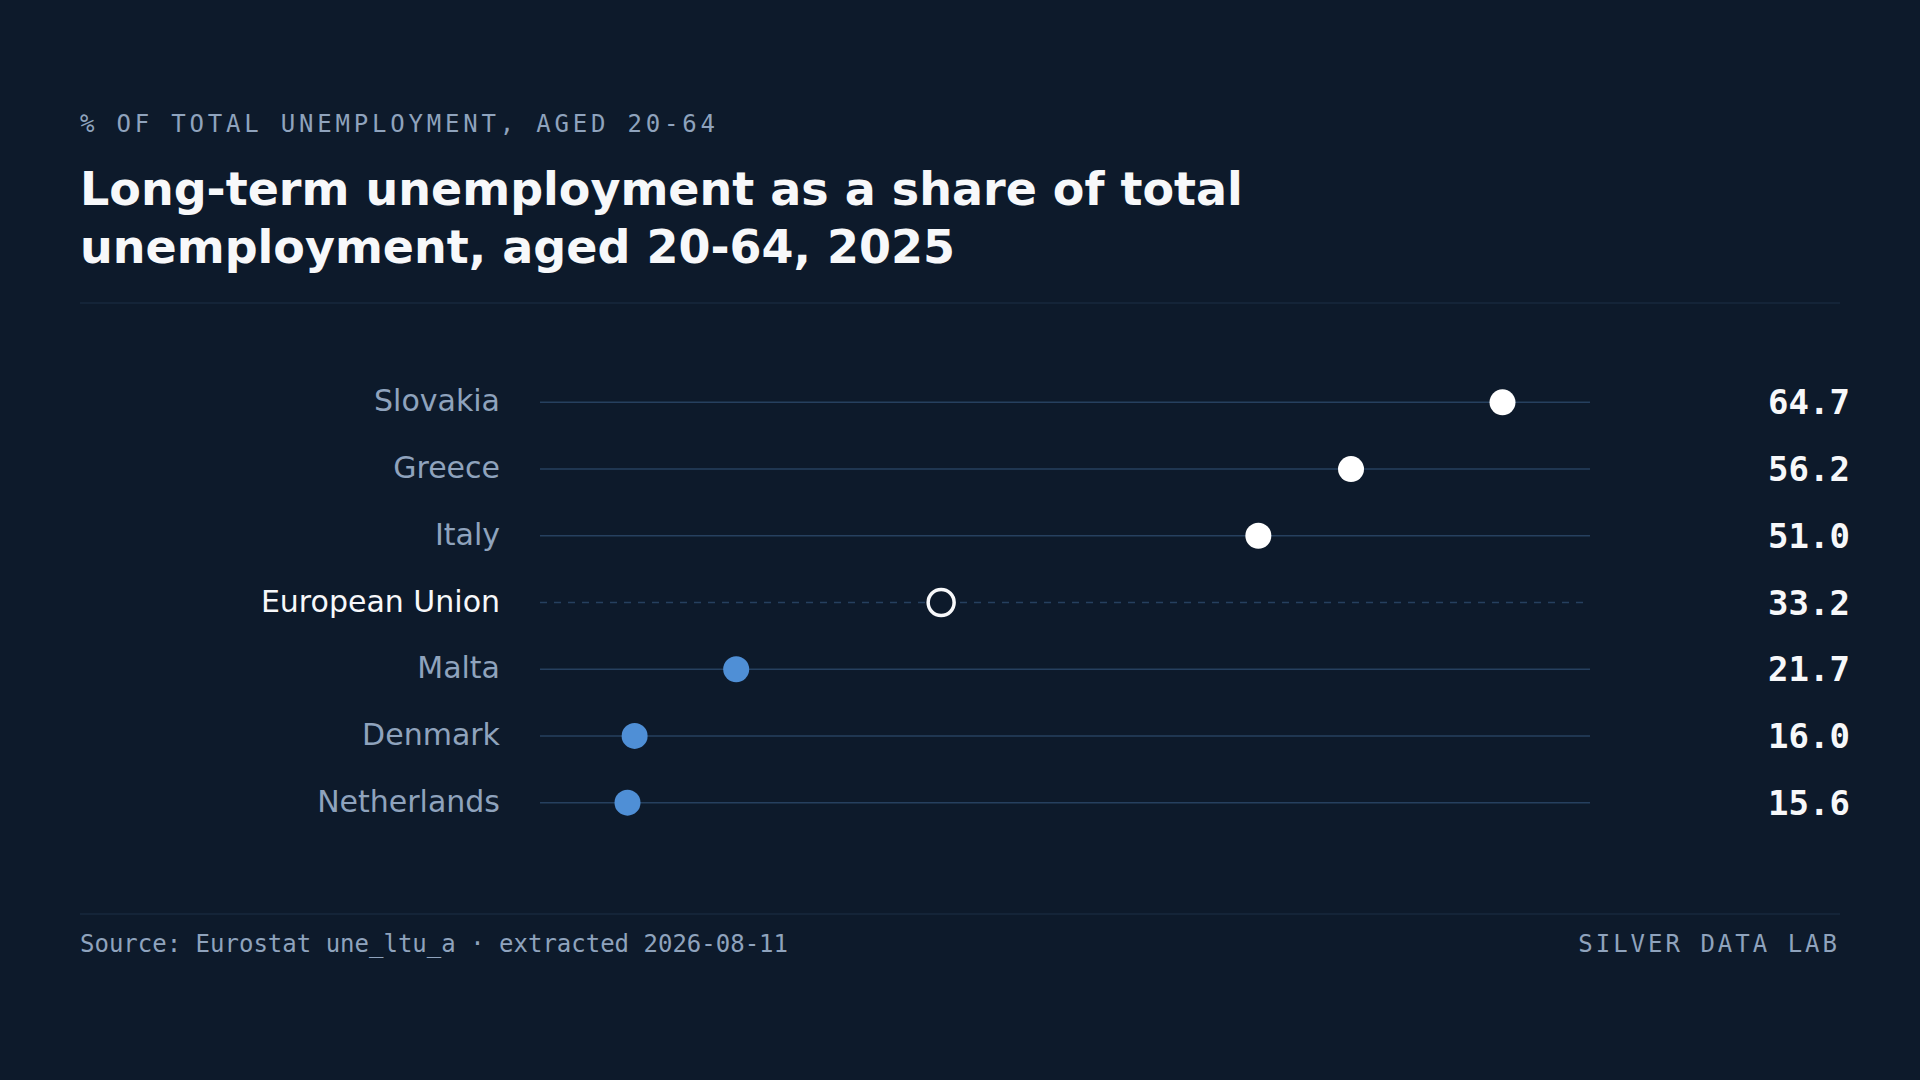
A Third of the EU's Unemployed Have Been Out of Work for a Year or More
33.2% of unemployed people aged 20 to 64 in the EU had been out of work for twelve months or more in 2025 — 4.0 million people.
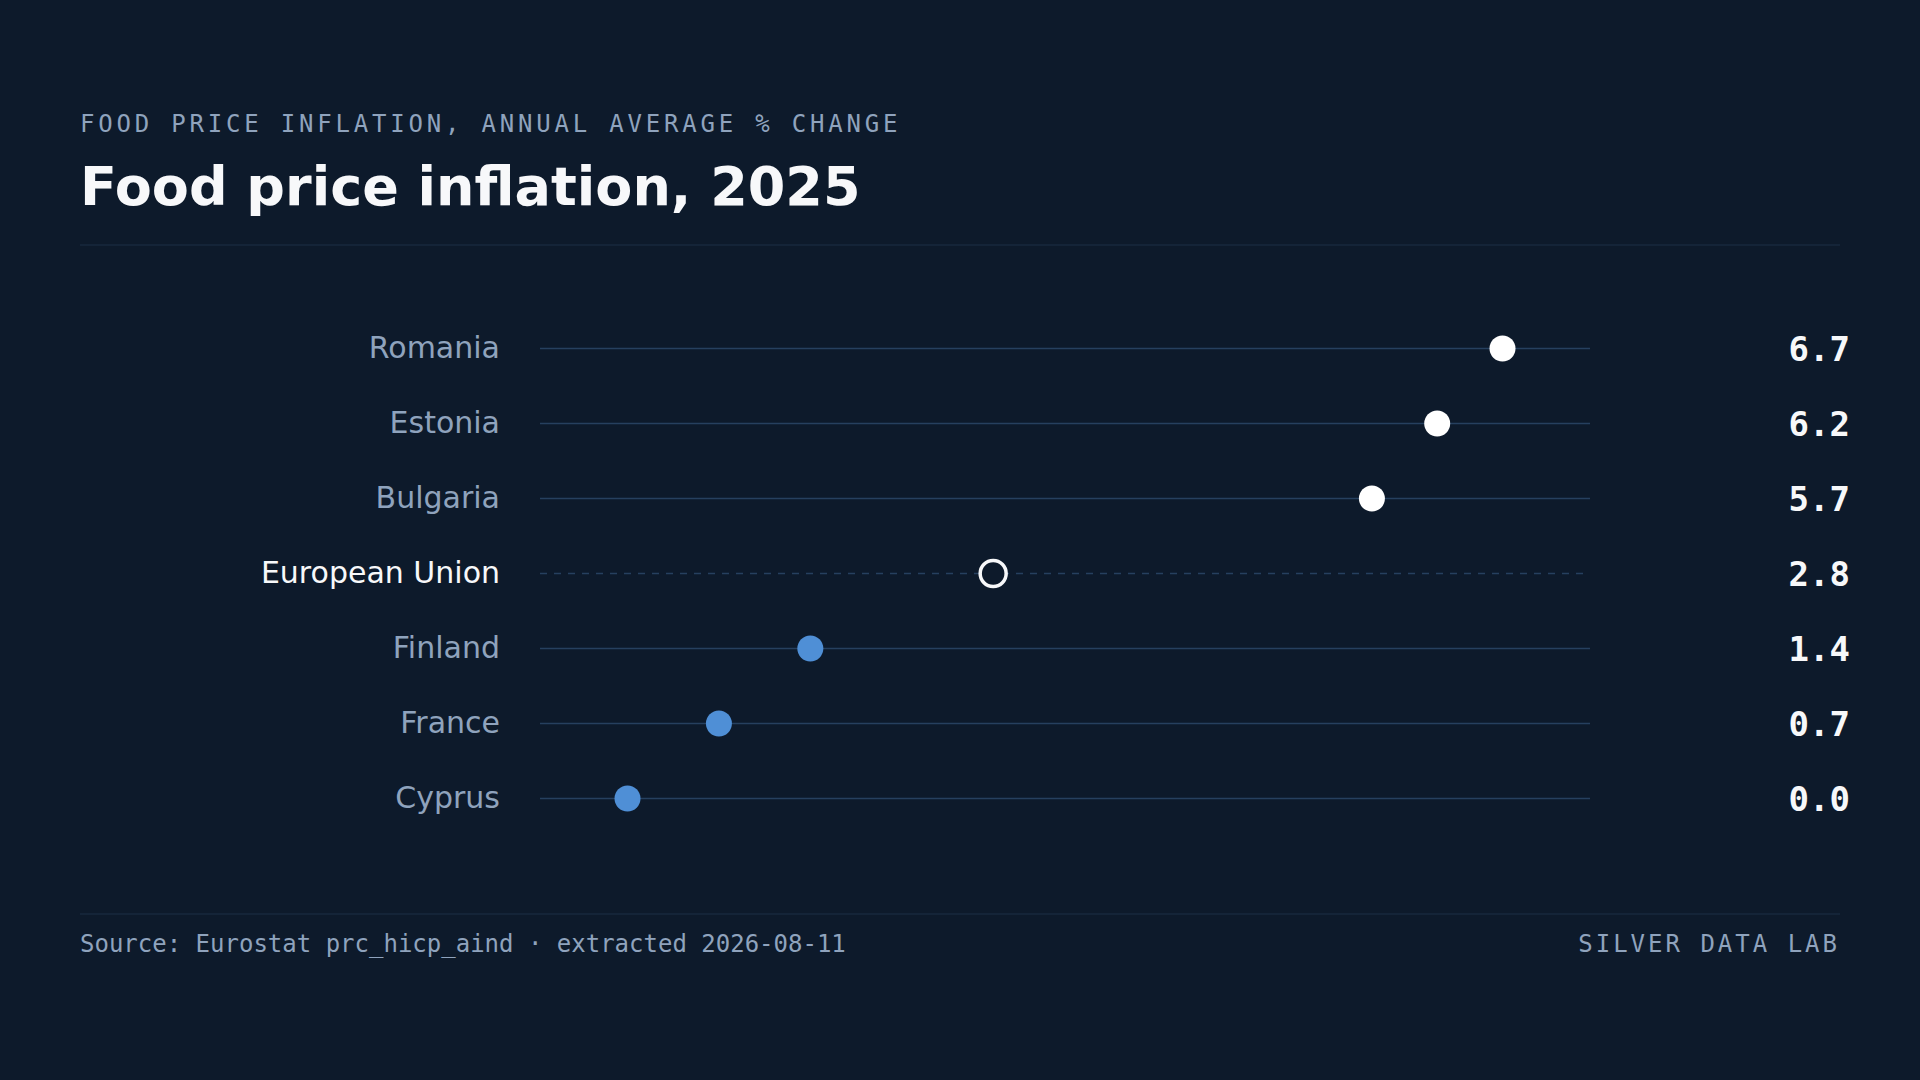
Food Prices Rose 6.7% in Romania and Not at All in Cyprus
Food prices in the EU rose 2.8% on average in 2025.
Germany Has the EU's Biggest Trade Surplus in Goods With Non-EU Countries
EU Member States together ran a goods trade surplus of 113.9 billion euro with countries outside the Union in 2025.