Denmark's Net Wealth Abroad Is Worth 97.8% of Its GDP
Silver Data Lab Research Desk · Statistical analysis · Published on 11 July 2026
This study is open to members only
Its sources, filters and extraction date are declared above, as they are for every study. Sign in to read the analysis in full.
- Data source
- Eurostat
- Reference period
- 2025
- Last updated
- 13 October 2026
Re-checked against the source on 13 October 2026. 25 values in its datasets moved between snapshots; none is a figure stated on this page. Every revision we have observed →
Key estimates
- Denmark's net international investment position stood at 97.8% of GDP at the end of 2025 — close to a full year of its economic output.
- Malta records 88.6% and Germany 80.8%.
- Greece records -139.2%, Cyprus -86.0% and Ireland -54.4%.
- The distance between Denmark and Greece is 237 percentage points of GDP.
- Nine Member States sit below -35% of GDP, the threshold the Commission's imbalance procedure uses.
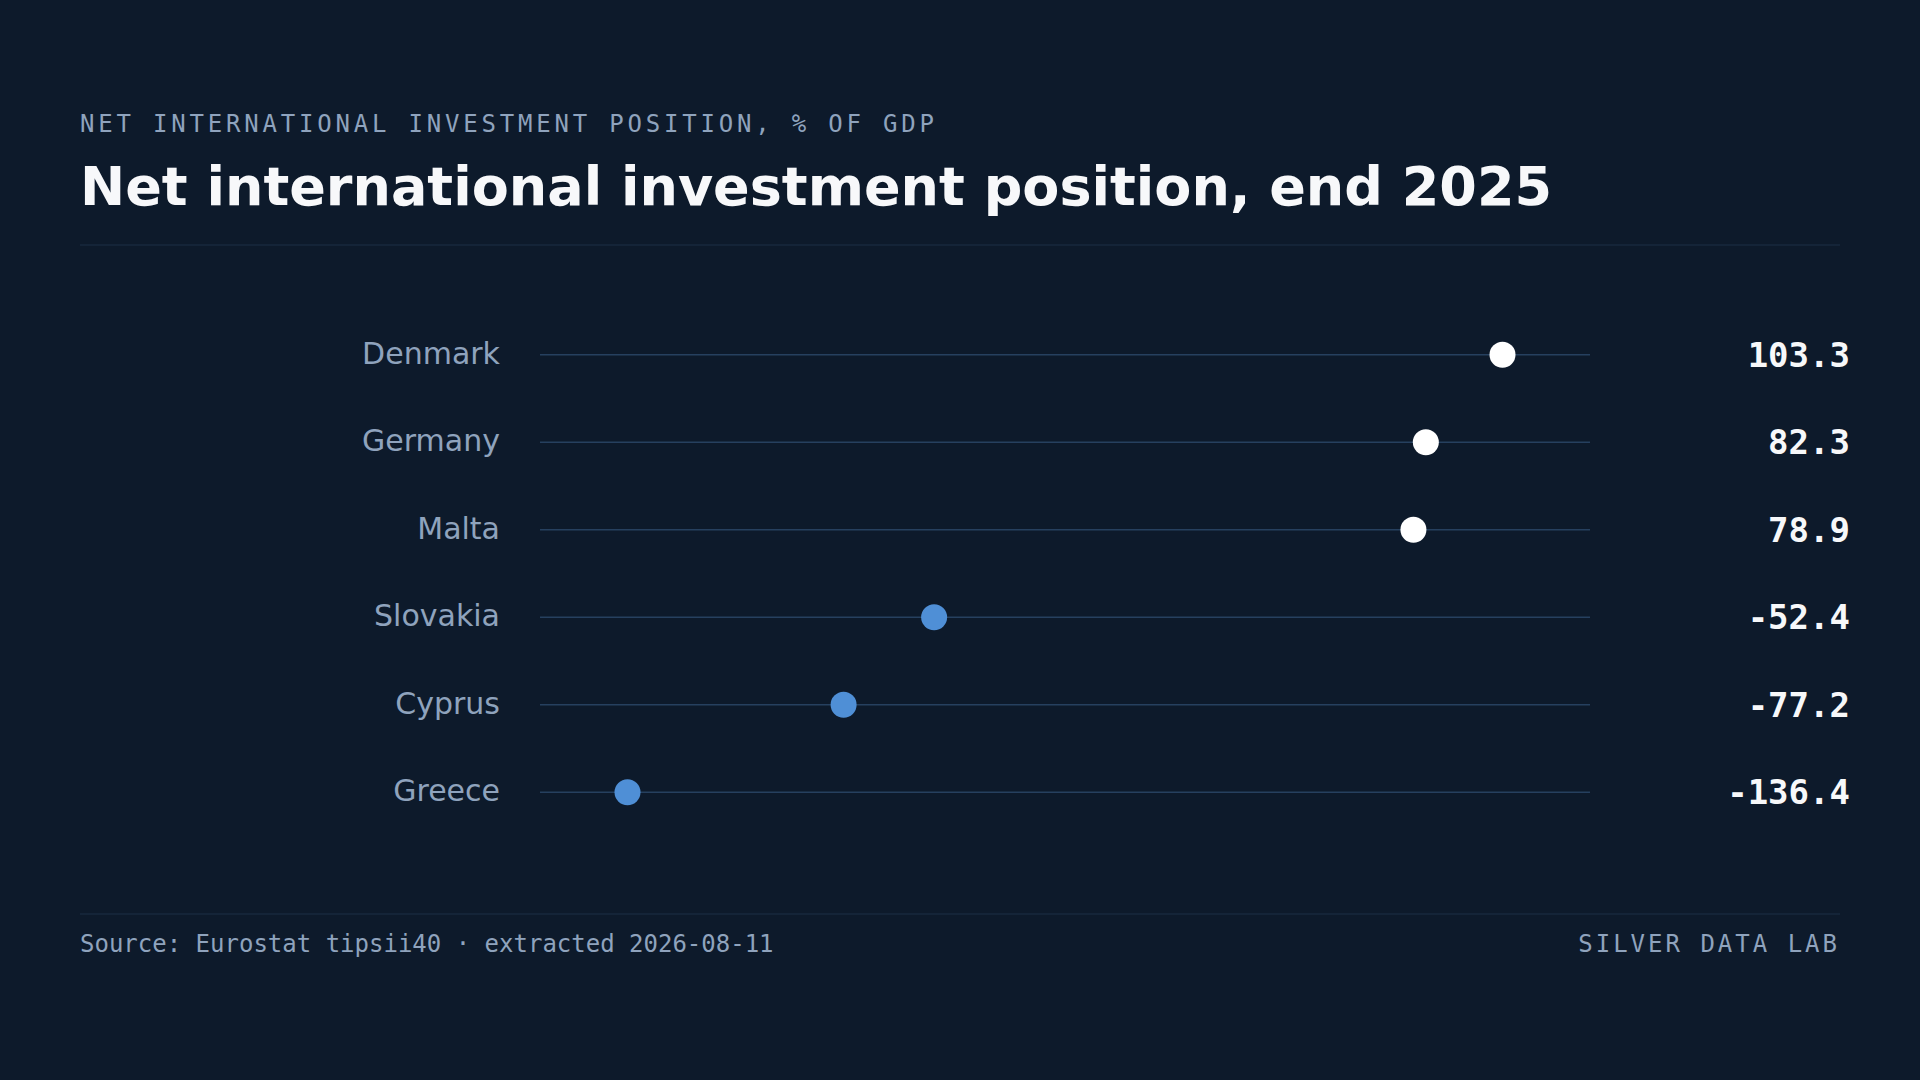
What a country owns abroad, against what the world owns of it
The net international investment position is a stock, not a flow. It adds up everything residents of a country own outside it — foreign shares, bonds, direct investments, deposits — and subtracts everything foreigners own inside it.
A positive figure means a country is a net creditor to the rest of the world. A negative figure means it is a net debtor.
Across the EU at the end of 2025 the positions ranged from +97.8% of GDP to -139.2%.
The creditors
Denmark records 97.8%. Danish residents' net foreign assets come close to a full year of Danish economic output.
Malta follows at 88.6%, Germany at 80.8% and Sweden at 59.7%. These are economies that have run current account surpluses for long periods; a surplus is the annual flow, and this stock is what decades of it accumulate into.
Germany's position is the one with the most weight behind it, because of the size of the economy. It is the world's largest creditor in absolute terms among EU Member States, and the counterpart to the export surpluses it has run since the early 2000s.
The debtors
Greece records -139.2%. Foreigners' net claims on Greece exceed its annual output by close to two fifths.
Cyprus records -86.0%, Ireland -54.4% and Slovakia -51.6%, with Portugal at -49.6%, Romania at -44.0%, Spain at -42.7%, Hungary at -35.5% and Croatia at -35.1% completing the nine Member States below -35% of GDP.
That threshold is not arbitrary. The Commission's macroeconomic imbalance procedure uses -35% as the indicative level below which a country's external position is flagged for closer examination, and the number of Member States below it is one measure of how much external imbalance the Union is carrying.
Why a large negative position is not automatically a crisis
Greece's figure is the legacy of its sovereign debt crisis and the official lending that followed. A substantial part of the claims on Greece is held by other European governments and institutions on concessional terms with very long maturities, which is a different kind of liability from short-term market debt.
Slovakia's negative position is largely foreign direct investment: factories built by foreign firms count as foreign claims on Slovakia. Eurostat publishes that component of the same position, and for Slovakia it reads -43.3% of GDP against a total of -51.6% — four fifths of the shortfall, a share derived here by division. That is an external liability in the accounting sense and an industrial base in the physical sense, and the two readings point opposite ways.
Greece is the contrast that makes the point. Its direct investment position is -26.4% of GDP against a total of -139.2%, under a fifth of it, so most of what the world holds of Greece is in instruments that have to be serviced rather than owned. Two Member States deep in negative territory, and the money arrived for opposite reasons.
This is the central difficulty with the indicator. A large negative position can mean a country borrowed to consume, or that it attracted investment to produce. The headline number does not distinguish them, and the composition matters more than the level.
What it is good for
Where the indicator is unambiguous is in showing accumulation. A country cannot run persistent deficits without its position deteriorating, and it cannot reverse a position of -100% of GDP quickly by any means.
It is therefore the measure that shows which imbalances are structural rather than cyclical, and it is the reason a current account deficit in one year is a smaller matter than the same deficit sustained for twenty.
Net international investment position, end 2025
| Country | % of GDP |
|---|---|
| Denmark | 97.8 |
| Malta | 88.6 |
| Germany | 80.8 |
| Ireland | -54.4 |
| Cyprus | -86.0 |
| Greece | -139.2 |
This table as data: CSV · JSON
Every Member State for this indicator+
Members see every Member State for this indicator here, not only the rows the ranking prints. Become a Member
What these figures cannot tell you
- Composition matters more than level
- A negative position built from foreign direct investment in productive capacity is different from one built from borrowing to consume. Slovakia and Greece both record large negative positions for very different reasons, and the headline figure does not distinguish them. The direct investment component is published separately and is what separates the two cases here; the other components are not shown in this study.
- No EU aggregate is published
- Eurostat publishes no EU value for this series. Consolidating the Member States would require netting out their claims on each other, which this extraction does not support, so no reference row is shown.
- Valuation moves the stock without any transaction
- The position is measured at market value, so it changes when asset prices and exchange rates move. A country's figure can improve or deteriorate substantially in a year with no change in its borrowing or lending.
- Small economies with large financial sectors
- In Malta, Luxembourg, Ireland and Cyprus the position reflects the activity of internationally oriented financial and corporate structures that are large relative to the domestic economy.
Frequently asked questions
- Which EU country is the biggest net creditor?
- Denmark, whose net international investment position stood at 97.8% of GDP at the end of 2025 — its residents' net foreign assets come close to a full year of national output. Malta follows at 88.6% and Germany at 80.8%.
- Which EU country owes the most to the rest of the world?
- Greece, at -139.2% of GDP at the end of 2025. Cyprus follows at -86.0% and Ireland at -54.4%. A substantial part of the claims on Greece is official lending on concessional terms rather than market debt.
- What counts as a dangerous level?
- The Commission's macroeconomic imbalance procedure uses -35% of GDP as the indicative threshold for closer examination. Nine Member States were below it at the end of 2025.
- Is a negative position always bad?
- No. Foreign direct investment counts as a foreign claim, so a country that attracts factories built by foreign firms records a more negative position while gaining productive capacity. Slovakia is the clearest example. Composition matters more than the headline level.
Methodological note
The net international investment position is published by Eurostat as a share of GDP from balance of payments statistics under the BPM6 framework, measured against the rest of the world.
This study uses the end-2025 position, taken from the fourth quarter of the quarterly series, unadjusted. All 27 Member States have published values. Eurostat publishes no EU aggregate for this series, so none is quoted anywhere in this study.
The direct investment component of the same positions comes from a second table, declared below and read on the same basis: end-2025, unadjusted, against the rest of the world. Its total agrees cell for cell with the headline table for all 27 Member States.
The count of Member States below the -35% threshold, the distance between the highest and lowest, and the share of each country's position accounted for by direct investment are derived by Silver Data Lab. The -35% figure is the indicative threshold used in the Commission's macroeconomic imbalance procedure and is not a Eurostat statistic.
Source data
This study draws on 2 datasets from Eurostat. Each can be inspected and re-downloaded from its catalogue, and the filters below are the ones applied.
Net international investment position, % of GDP
tipsii40
- Filters applied:
- freq=Q · unit=PC_GDP · s_adj=NSA · bop_item=FA · stk_flow=N_LE · partner=WRL_REST · time=2025-Q4
- Extracted:
- 2026-10-03
- Source last updated:
- 2026-10-02
International investment position by item, % of GDP
bop_gdp6_q
- Filters applied:
- freq=Q · unit=PC_GDP · s_adj=NSA · bop_item=FA, FA__D__F · stk_flow=N_LE · partner=WRL_REST · time=2025-Q4
- Extracted:
- 2026-10-13
- Source last updated:
- 2026-10-02
Download the data
The data the study you have just read is built on, exactly as it was downloaded and archived.
Yours as a Member.
Data downloadable by Members
How to cite
Record the vintage as well as the study: the figures on this page are the ones extracted on the dates below.
Silver Data Lab Research Desk (2026). Denmark's Net Wealth Abroad Is Worth 97.8% of Its GDP. Silver Data Lab, published 11 July 2026, last updated 13 October 2026. https://www.silverdatalab.com/studies/net-international-investment-position-in-the-eu
- Data: Eurostat, Net international investment position, % of GDP (tipsii40), filters freq=Q, unit=PC_GDP, s_adj=NSA, bop_item=FA, stk_flow=N_LE, partner=WRL_REST, time=2025-Q4; extracted 2026-10-03; source last updated 2026-10-02. https://doi.org/10.2908/tipsii40
- Data: Eurostat, International investment position by item, % of GDP (bop_gdp6_q), filters freq=Q, unit=PC_GDP, s_adj=NSA, bop_item=FA, FA__D__F, stk_flow=N_LE, partner=WRL_REST, time=2025-Q4; extracted 2026-10-13; source last updated 2026-10-02. https://doi.org/10.2908/bop_gdp6_q
Silver Data Lab's analysis is licensed CC BY 4.0. The statistics remain their publisher's and keep its terms of reuse.
Ask the research desk
A question about this study — a definition, a filter, a break in the series, what the figures can and cannot support — answered by the desk that made the extraction.
Members can write to the research desk
Other studies on the same dataset
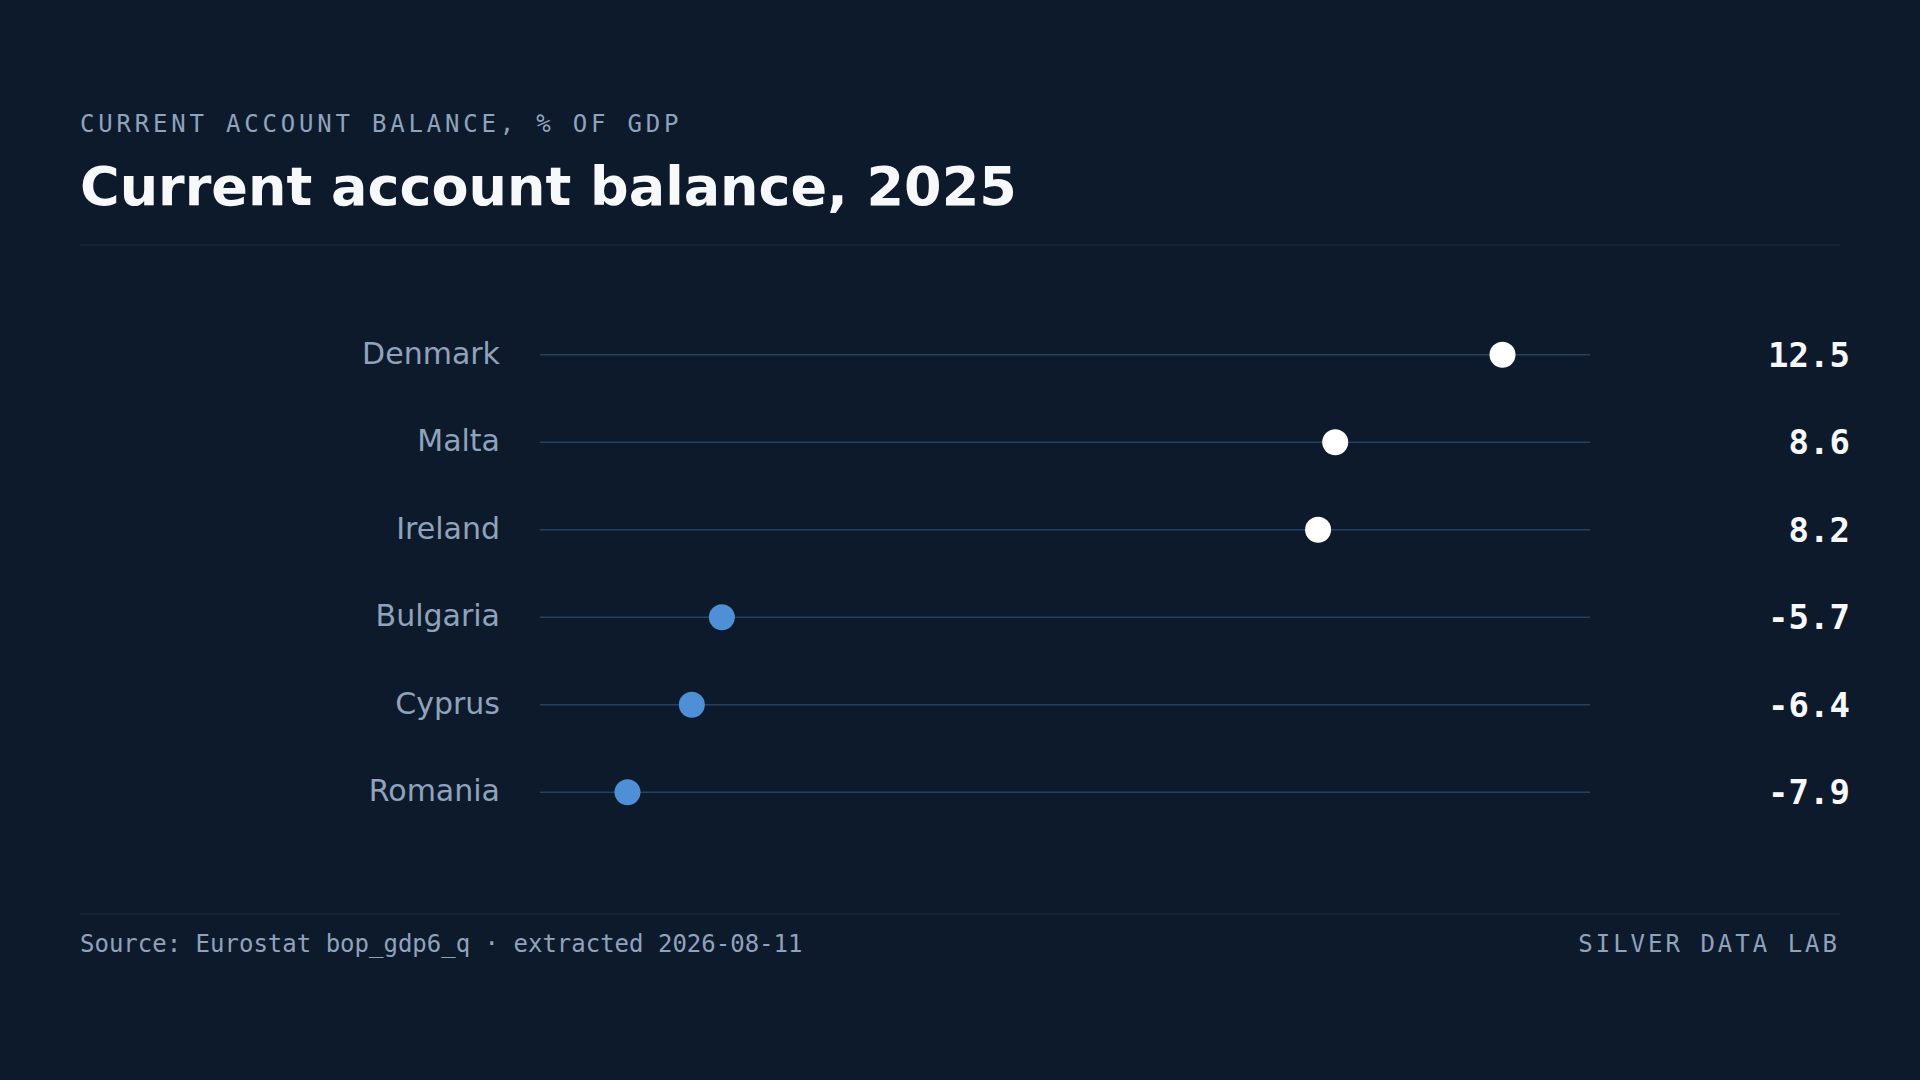
Denmark Has the EU's Biggest Surplus With the World, at 12.3% of GDP
Denmark ran a current account surplus worth 12.3% of GDP in 2025, the largest in the Union.
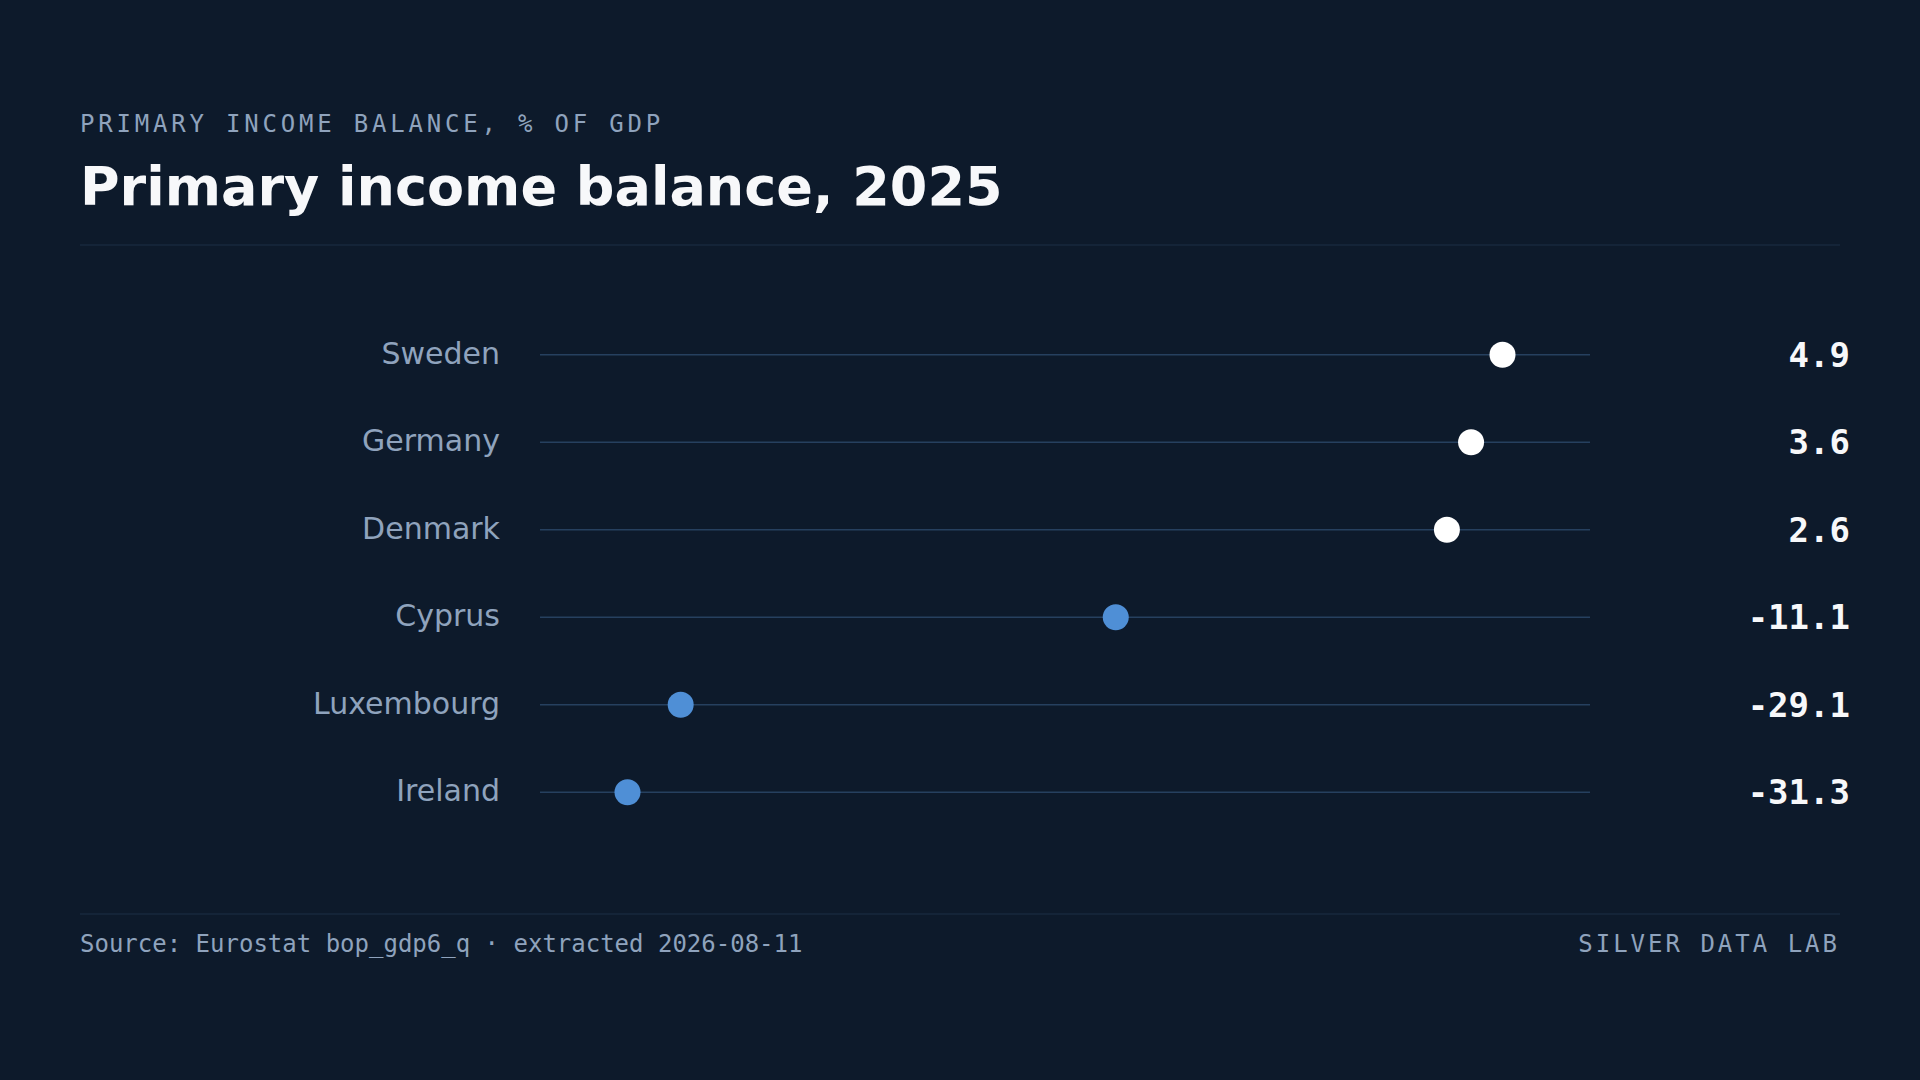
Ireland Pays Out More Income Abroad Than It Receives, a Net 28.6% of GDP
Ireland's net primary income outflow was 28.6% of GDP in 2025, second only to Luxembourg's 29.3%.
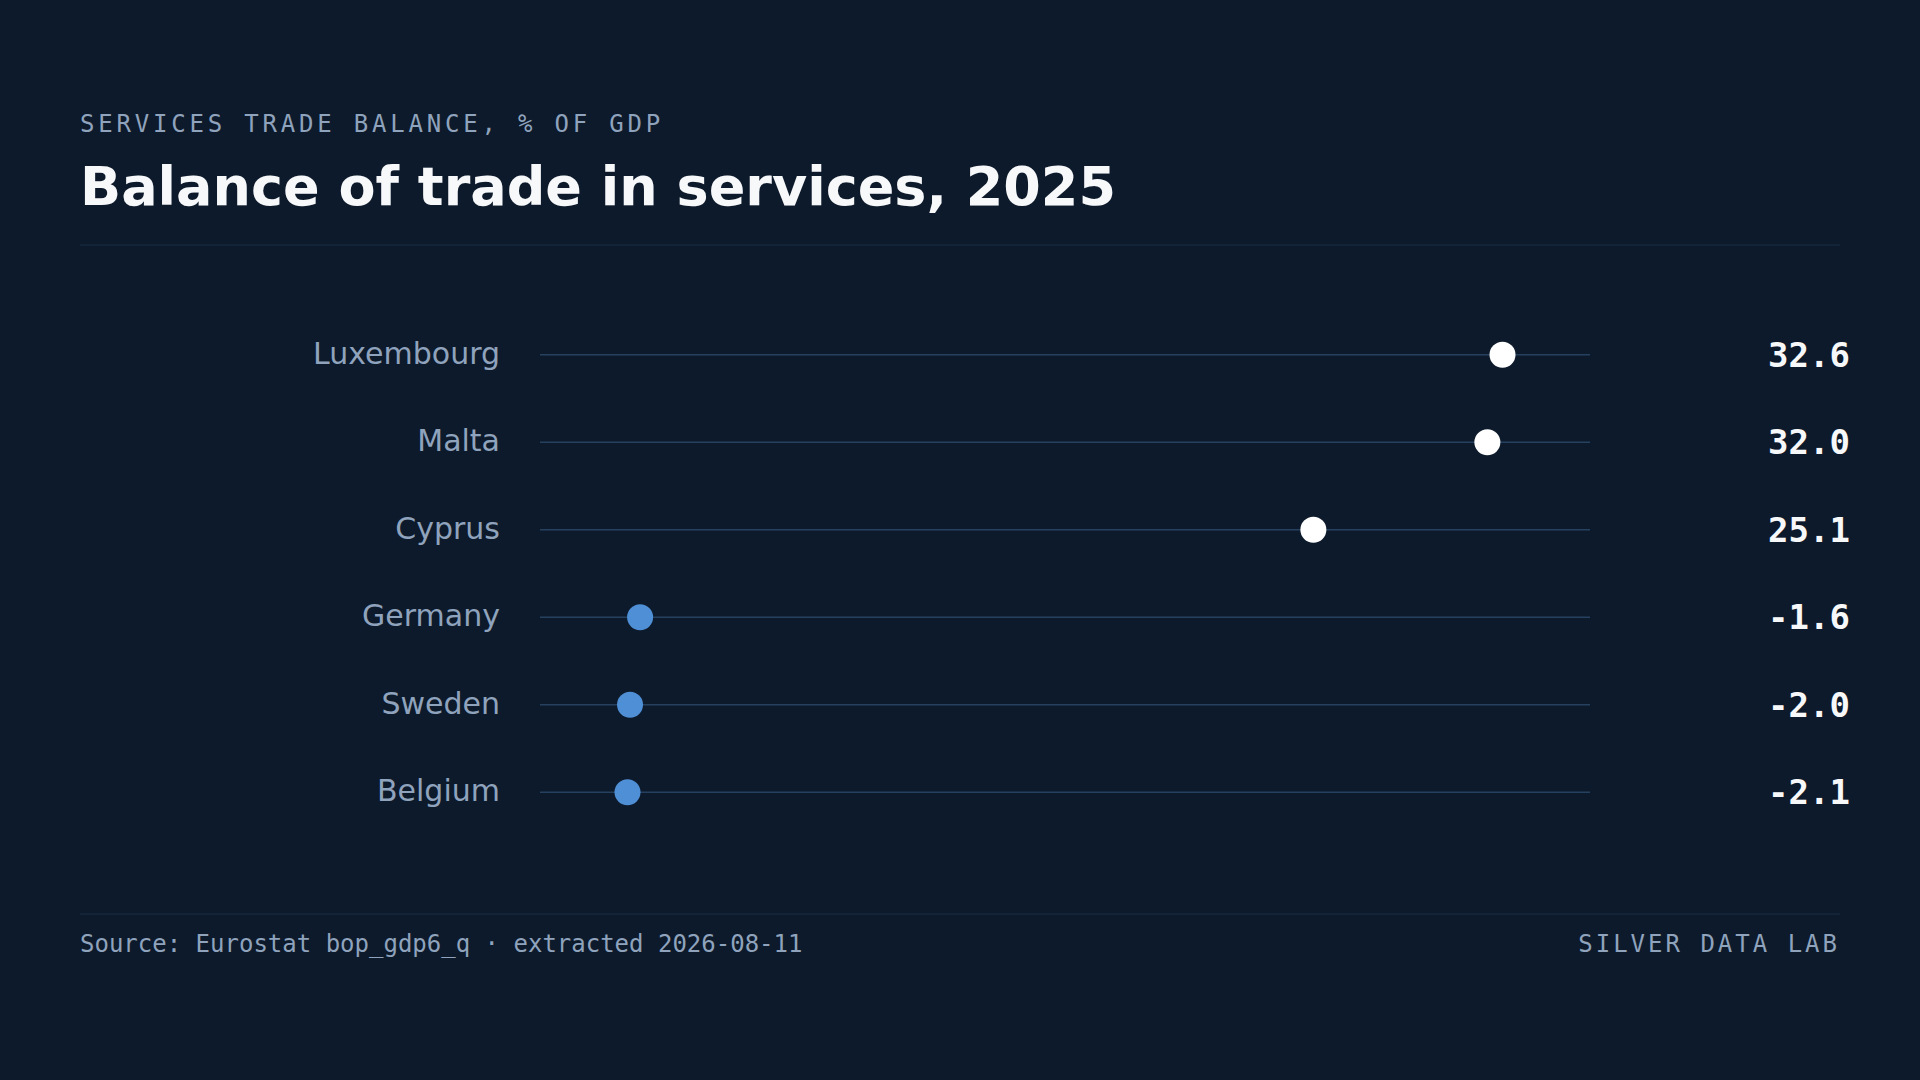
Germany Buys More Services From Abroad Than It Sells
Malta records a services trade surplus worth 33.2% of GDP, Luxembourg 30.3% and Cyprus 27.4%.
Studies where the same country leads or trails
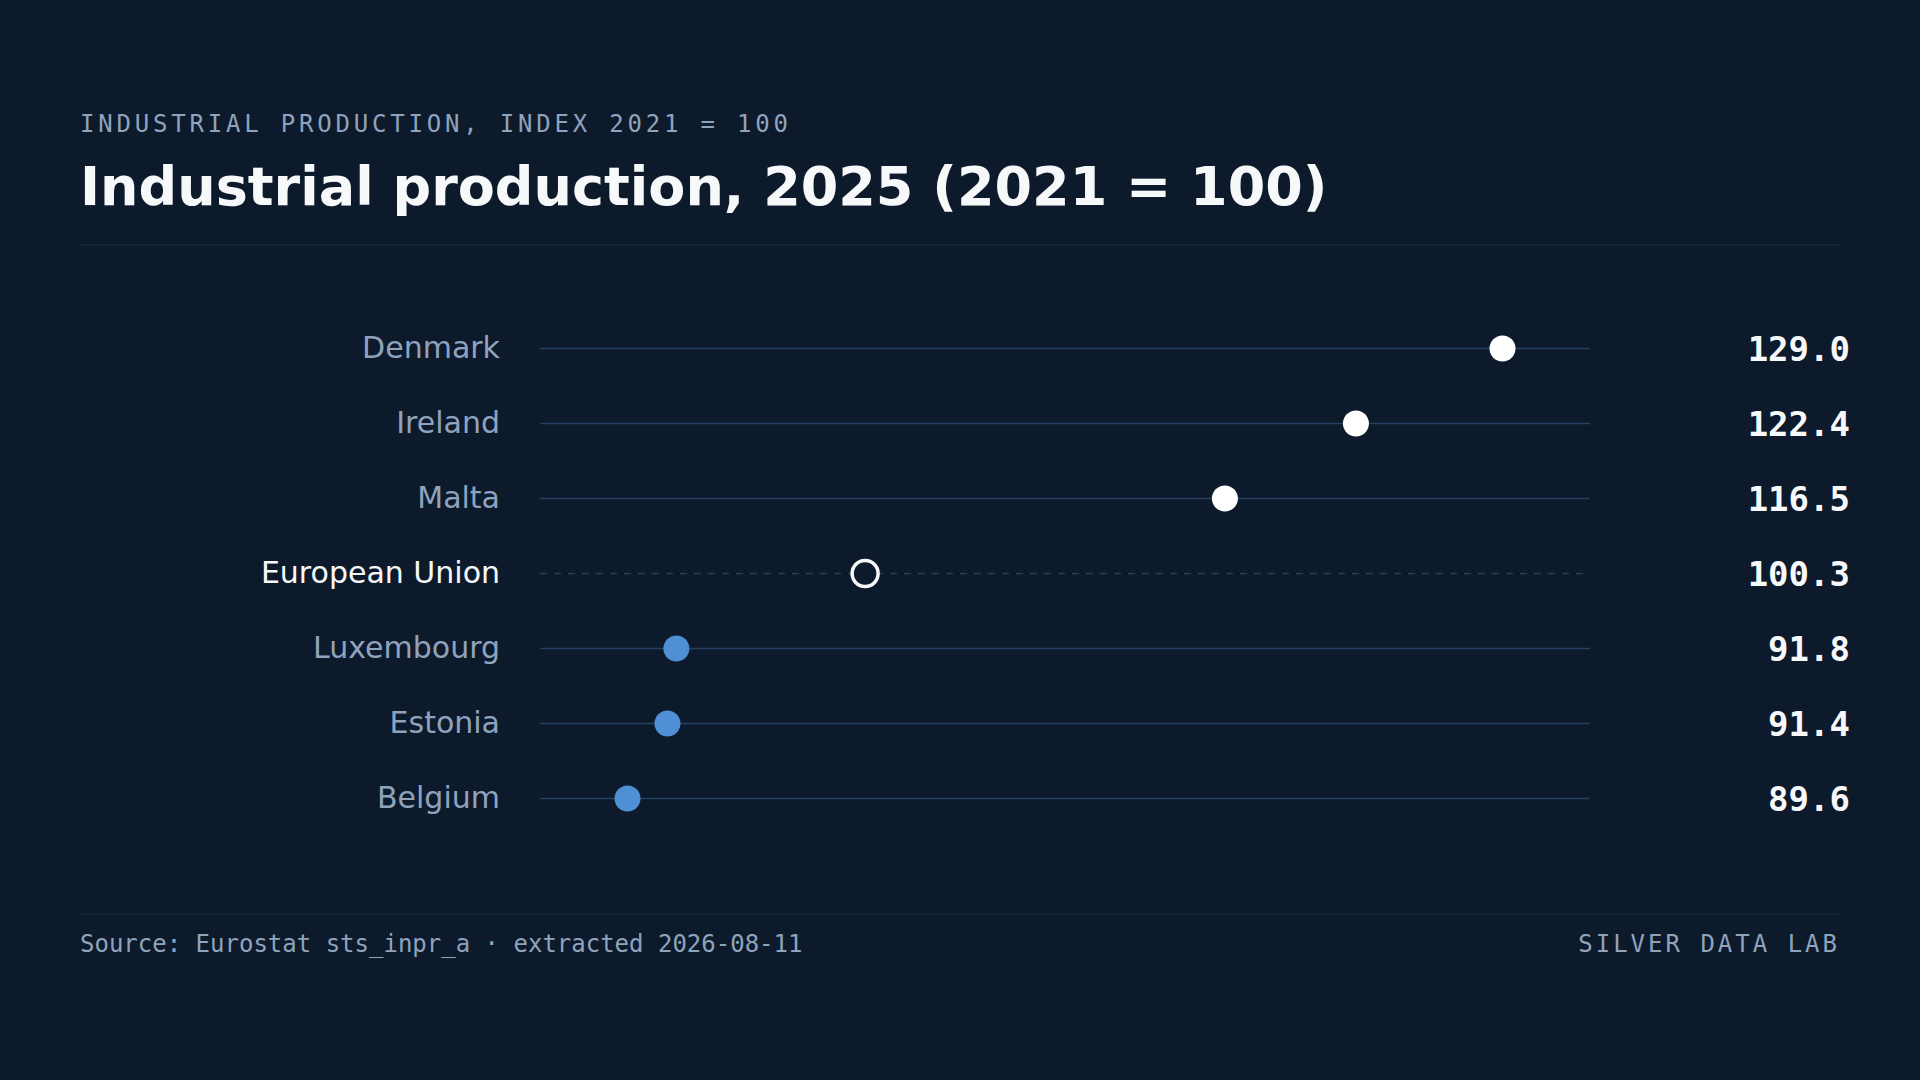
EU Industrial Output Is Where It Was Four Years Ago
EU industrial production in 2025 stood at 100.4 against a 2021 base of 100 — output is essentially unchanged after four years.
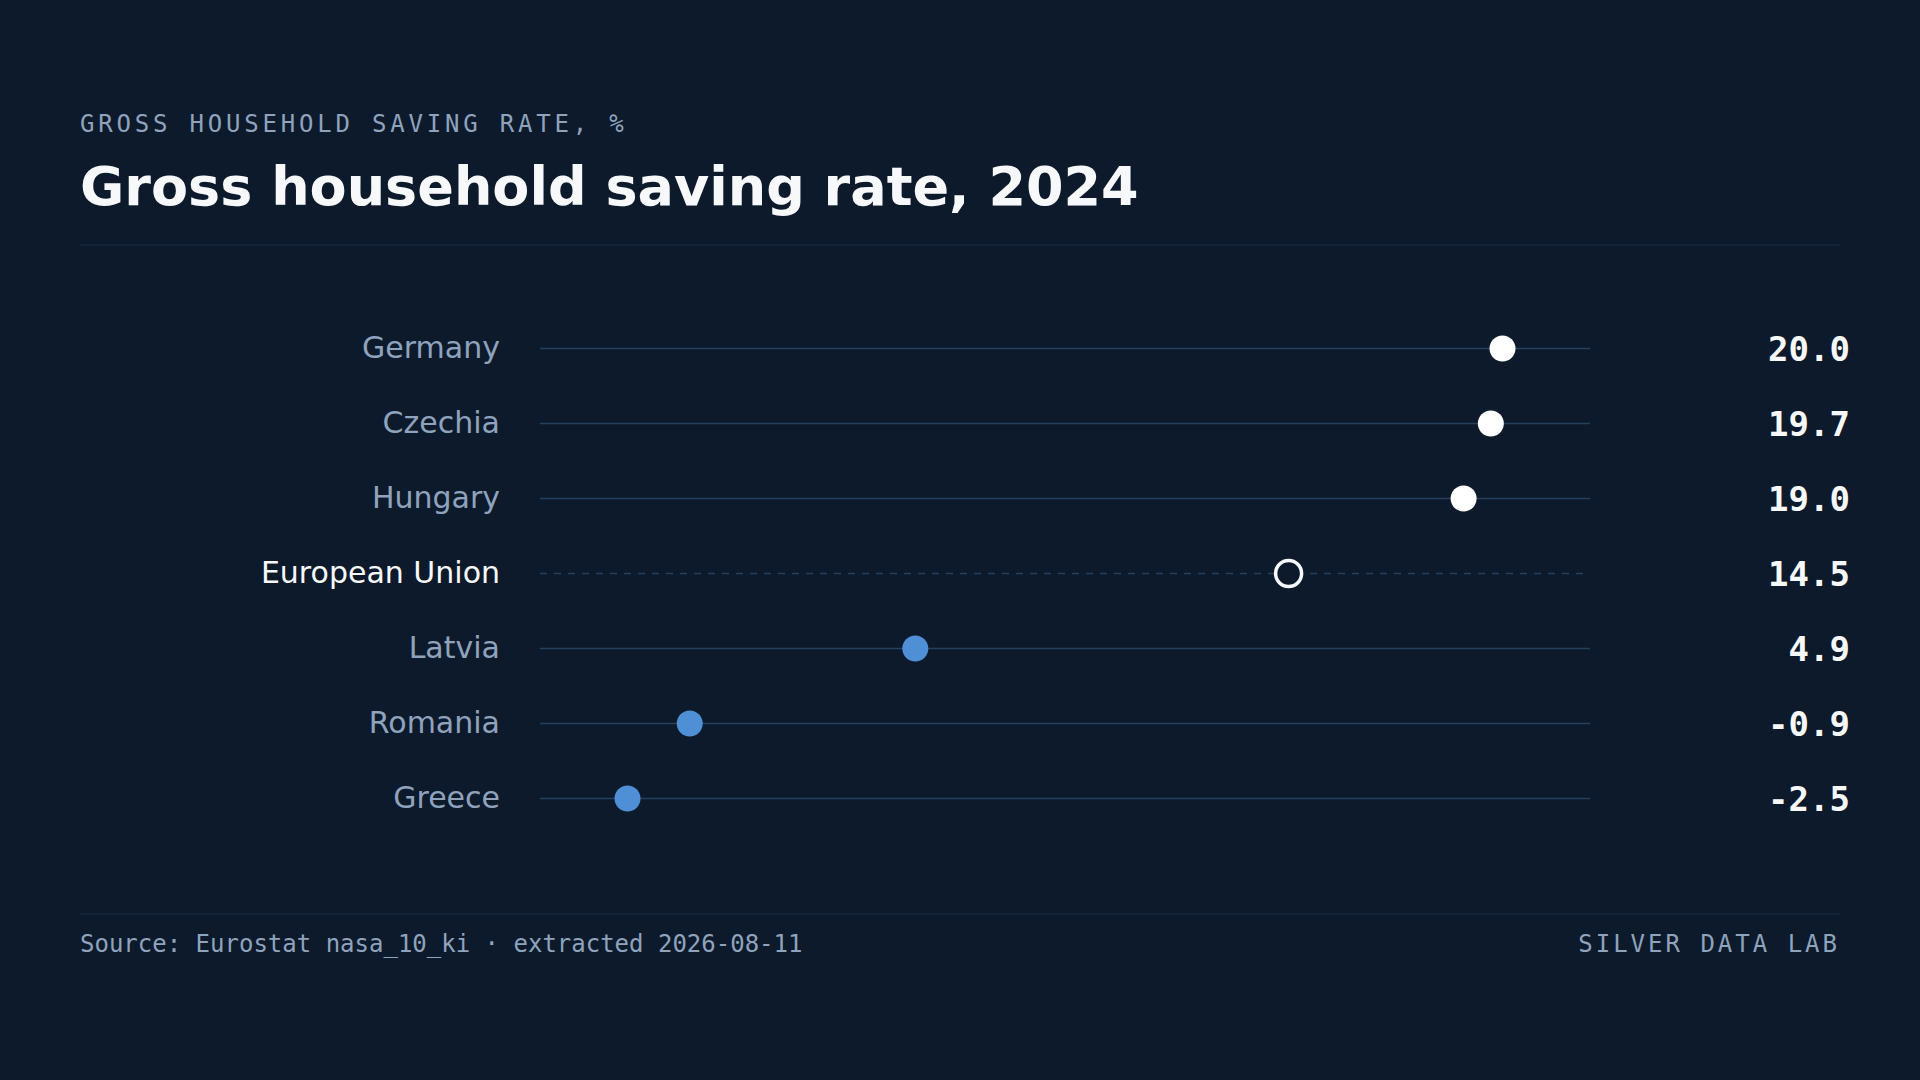
In Two EU Countries, Households Spend More Than They Earn
EU households saved 14.5% of their gross disposable income in 2024.
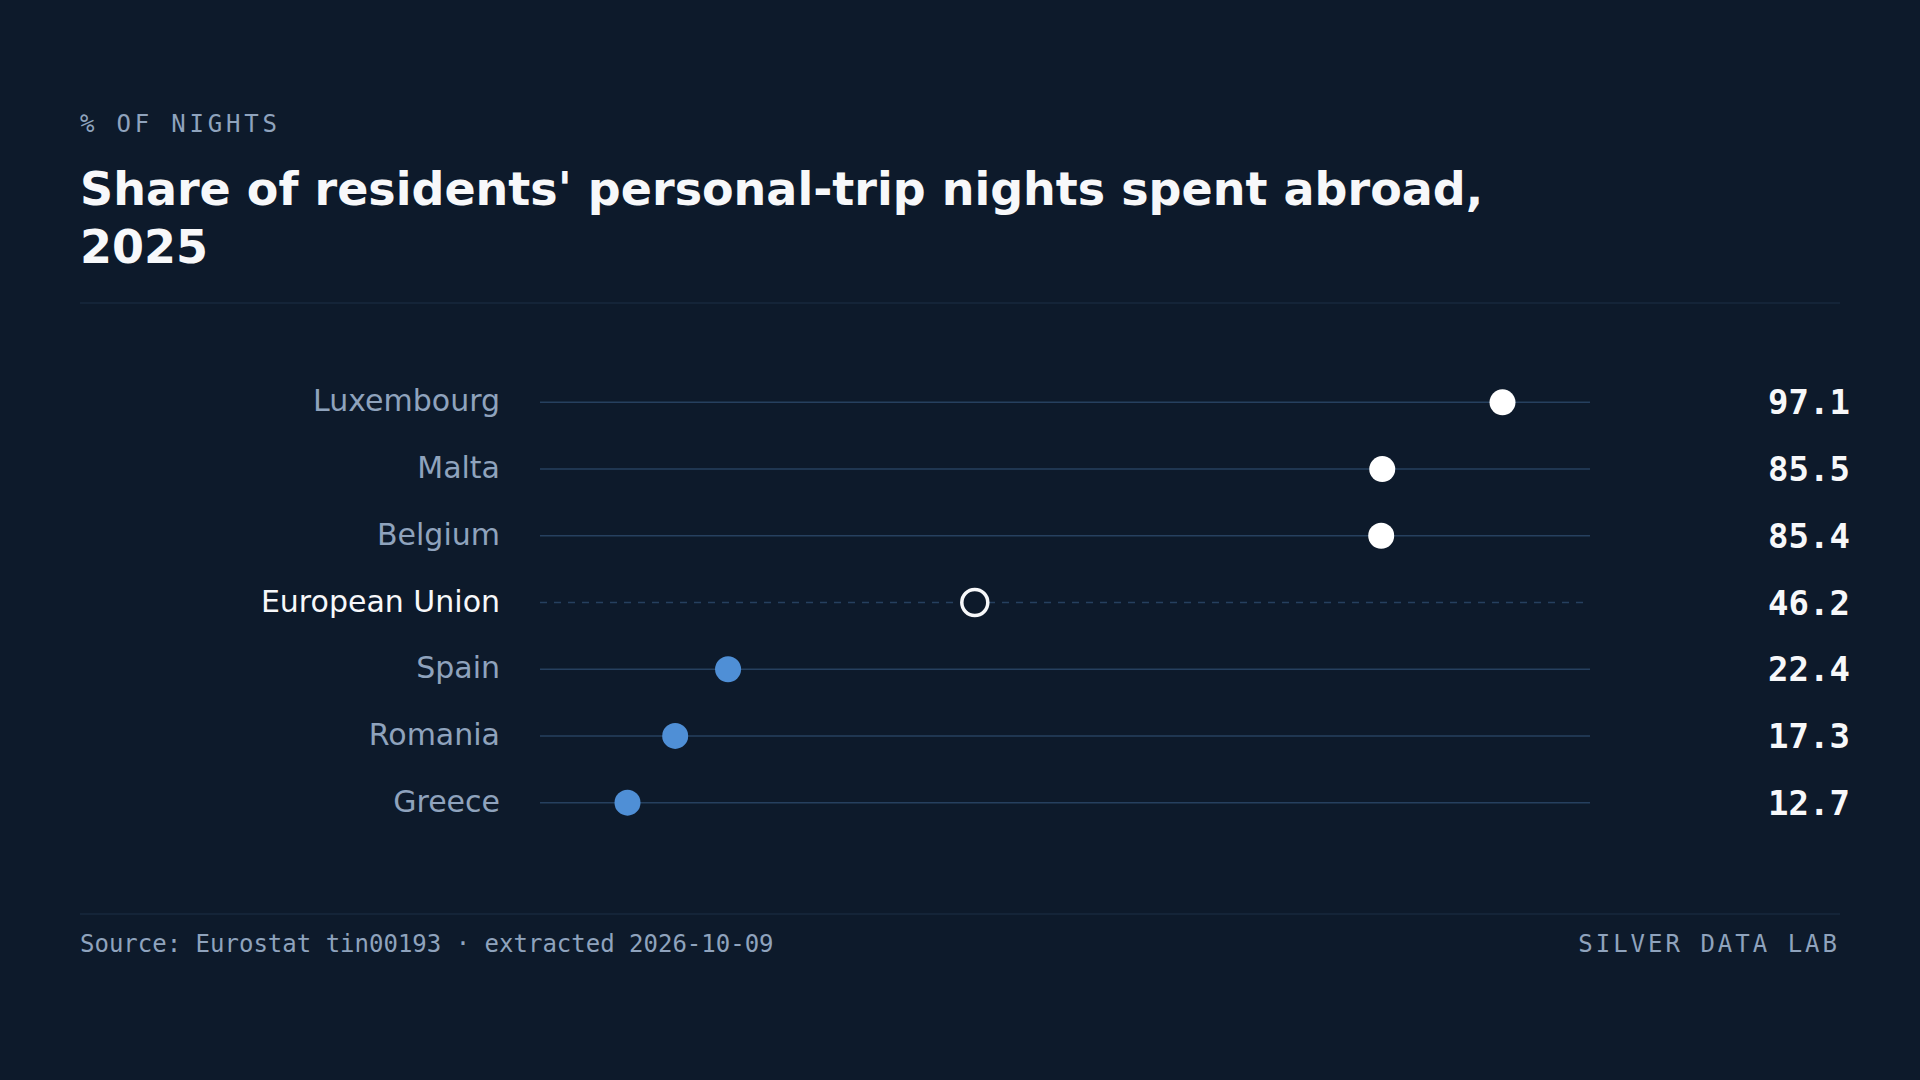
Luxembourg's Residents Spend Nearly All Their Holiday Nights Abroad
In 2025, 46.2% of the nights EU residents spent away from home on personal trips were spent in a country other than their own, against 42.3% in 2019. Both shares are derived by Silver Data Lab from Eurostat's counts of nights.