Italy Shops Online Less Than Any Large EU Economy
Silver Data Lab Research Desk · Statistical analysis · Published on 20 April 2026
- Data source
- Eurostat
- Reference period
- 2025
- Last updated
- 29 August 2026
Re-checked against the source on 11 August 2026. No value in its datasets has moved between the snapshots we hold. Every revision we have observed →
Key estimates
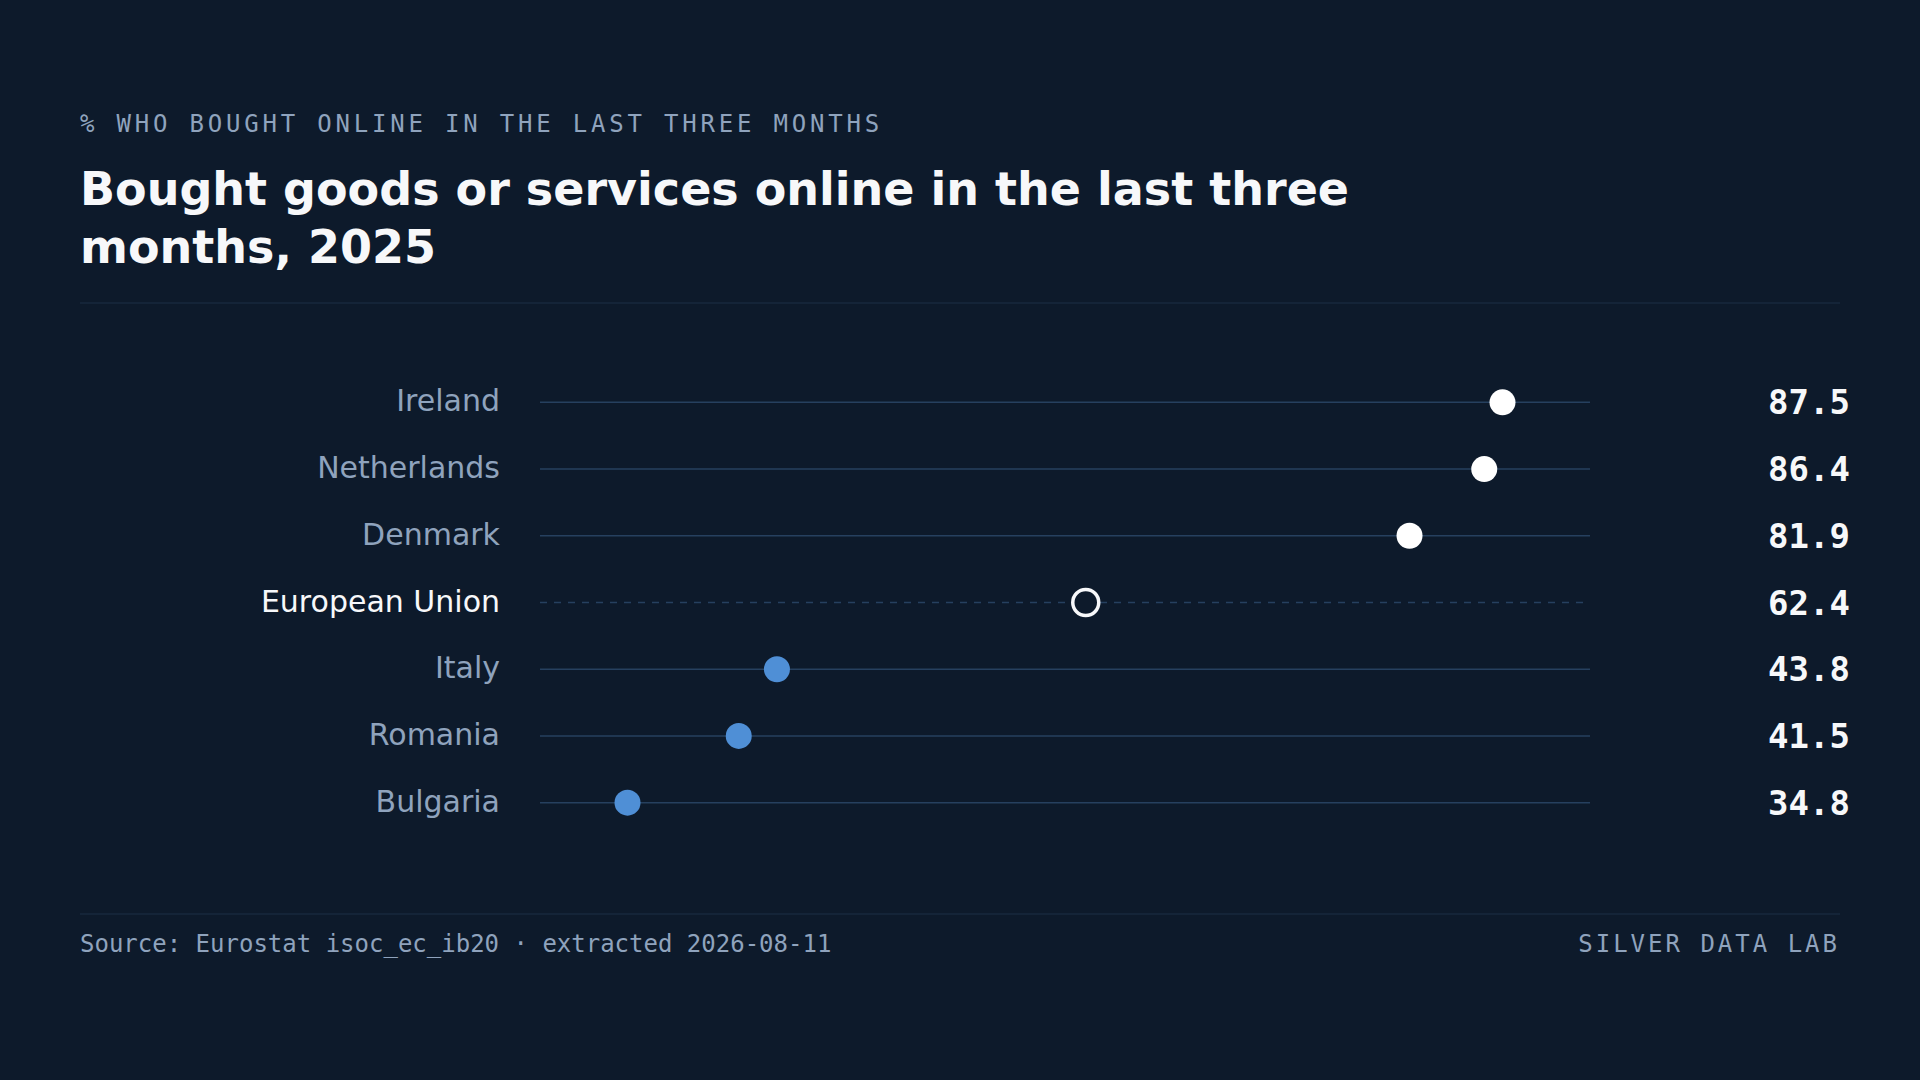
- 62.4% of people in the EU bought goods or services online in the three months before the 2025 survey.
- Ireland records 87.5%, the Netherlands 86.4% and Denmark 81.9%.
- Bulgaria records 34.8%, Romania 41.5% and Italy 43.8%.
- Italy is 18.6 points below the EU figure and the only one of the Union's four largest economies in the bottom five.
- Germany at 70.4% and France at 70.3% sit eight points above the EU average, which is where large western economies usually sit.
A well-behaved indicator with one badly behaved observation
Online purchasing is among the most predictable indicators in European statistics. Richer, more urbanised, more digitally skilled countries buy more online, and the ranking usually reproduces that ordering with little argument.
Across the EU, 62.4% of people bought something online in the three months before the 2025 survey. Ireland leads at 87.5%, the Netherlands follows at 86.4% and Denmark at 81.9%. Bulgaria is lowest at 34.8%, with Romania at 41.5%.
So far the ranking behaves. Then there is Italy.
The Italian outlier
Italy records 43.8%, third from bottom, between Romania and Portugal.
That position has no parallel among comparable economies. Germany records 70.4%, France 70.3% and Spain 59.6%. Italy sits 18.6 points below the EU figure and 26.6 points below Germany, and it is the only one of the Union's four largest economies anywhere near the bottom of this table.
Italy is not an outlier on income: its GDP per capita is 96 on an index where the EU is 100. It is an outlier here.
What the other indicators say about it
Italy records 54.3% on digital skills against an EU figure of 60.4%, 3.8% ICT specialists against 5.0%, and 33.5% knowledge-intensive employment against 37.5%.
Four indicators, measuring four different things, put Italy consistently below the Union average on the digital economy while its income sits close to it. That is a pattern rather than a reading, and it is the kind of consistency that survives revisions to any single series.
What this study does not claim
Why Italy buys less online than its income predicts is not answerable from purchasing data. Retail structure, payment habits, delivery logistics, the age profile of the population and trust in online transactions have all been proposed, and this extraction can test none of them.
What it establishes is narrower: the gap exists, it is large, it is not explained by income, and it appears in the same direction across several unrelated surveys.
Bought goods or services online in the last three months, 2025
| Country | % of individuals | Gap to EU averagepercentage points, derived |
|---|---|---|
| Ireland | 87.5 | +25.1 |
| Netherlands | 86.4 | +24.0 |
| Denmark | 81.9 | +19.5 |
| European Unionaggregate | 62.4 | — |
| Italy | 43.8 | −18.6 |
| Romania | 41.5 | −20.9 |
| Bulgaria | 34.8 | −27.6 |
This table as data: CSV · JSON
Every Member State for this indicator+
Members see every Member State for this indicator here, not only the rows the ranking prints. Become a Member
Embed this chart
Paste this code into a page. The frame carries the source and the extraction date, and links back to the study.
What these figures cannot tell you
- A three-month recall window
- The indicator counts people who bought online in the three months before the survey. It measures recent participation, not frequency or spending, and someone who makes one purchase a year is treated the same as someone who shops weekly.
- Survey data, self-reported
- Figures come from the EU survey on ICT usage in households, based on samples. Estimates carry sampling uncertainty and depend on respondents recalling purchases accurately.
- Purchases, not value
- A country with a low participation rate may still have a large e-commerce market by value if those who do shop online spend heavily. This indicator counts people, not euros.
- Cross-border purchases are included
- Buying from a retailer in another Member State counts the same as buying domestically, so the measure describes consumer behaviour rather than the size of a national e-commerce sector.
Frequently asked questions
- How many Europeans shop online?
- 62.4% bought goods or services online in the three months before the 2025 survey. National rates ran from 87.5% in Ireland to 34.8% in Bulgaria.
- Which EU country shops online the most?
- Ireland, at 87.5% in 2025, ahead of the Netherlands at 86.4% and Denmark at 81.9%.
- Why does Italy rank so low on online shopping?
- The gap is established here; its cause is not. Italy records 43.8% against an EU figure of 62.4%, despite a GDP per capita close to the EU average. Retail structure, payment habits and demographics have all been proposed as explanations, and purchasing data alone cannot test any of them.
- Which EU country shops online the least?
- Bulgaria, at 34.8% in 2025, followed by Romania at 41.5% and Italy at 43.8%.
Methodological note
The indicator is Eurostat's share of individuals who bought or ordered goods or services over the internet for private use in the three months preceding the survey, for the total adult population.
Values are for 2025, the most recent year with complete coverage of the 27 Member States at the extraction date.
The comparisons with Italy's digital skills, ICT specialist share, knowledge-intensive employment and GDP per capita draw on companion studies published on this site, each from its own extraction. They are presented as agreement between independent sources, not as a combined estimate.
Source data
The underlying series can be inspected and re-downloaded from the Eurostat data browser. The filters below are the ones applied.
Internet purchases by individuals (2020 onwards)
isoc_ec_ib20
- Filters applied:
- freq=A · ind_type=IND_TOTAL · indic_is=I_BUY3 · unit=PC_IND · time=2025
- Extracted:
- 2026-08-11
- Source last updated:
- 2026-04-17
Download the data
The data the study you have just read is built on, exactly as it was downloaded and archived.
Yours as a Member.
Data downloadable by Members
How to cite
Record the vintage as well as the study: the figures on this page are the ones extracted on the dates below.
Silver Data Lab Research Desk (2026). Italy Shops Online Less Than Any Large EU Economy. Silver Data Lab, published 20 April 2026, last updated 29 August 2026. https://www.silverdatalab.com/studies/online-shopping-in-the-eu
- Data: Eurostat, Internet purchases by individuals (2020 onwards) (isoc_ec_ib20), filters freq=A, ind_type=IND_TOTAL, indic_is=I_BUY3, unit=PC_IND, time=2025; extracted 2026-08-11; source last updated 2026-04-17. https://doi.org/10.2908/isoc_ec_ib20
Silver Data Lab's analysis is licensed CC BY 4.0. The statistics remain their publisher's and keep its terms of reuse.
Ask the research desk
A question about this study — a definition, a filter, a break in the series, what the figures can and cannot support — answered by the desk that made the extraction.
Members can write to the research desk
Studies where the same country leads or trails
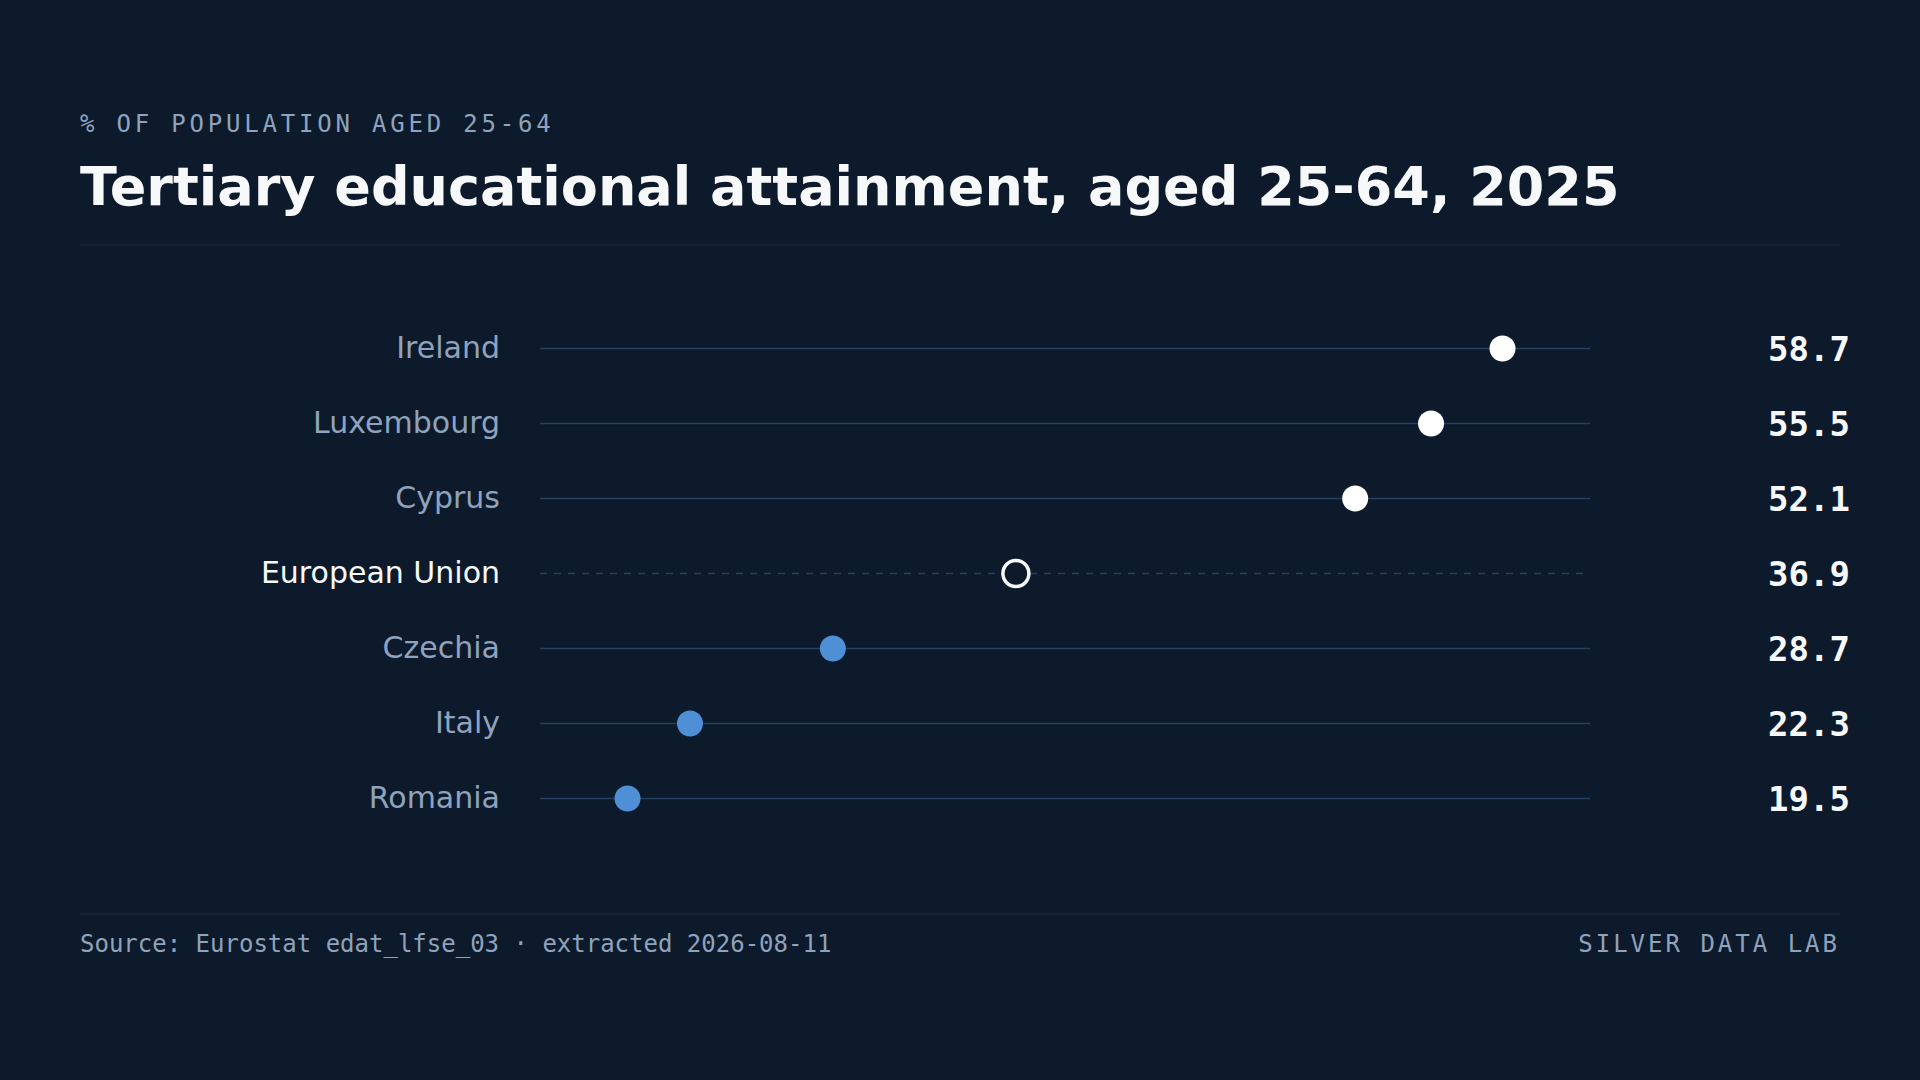
A Degree Is Three Times as Common Among Adults in Ireland as in Romania
36.9% of people aged 25 to 64 in the EU held a tertiary qualification in 2025.
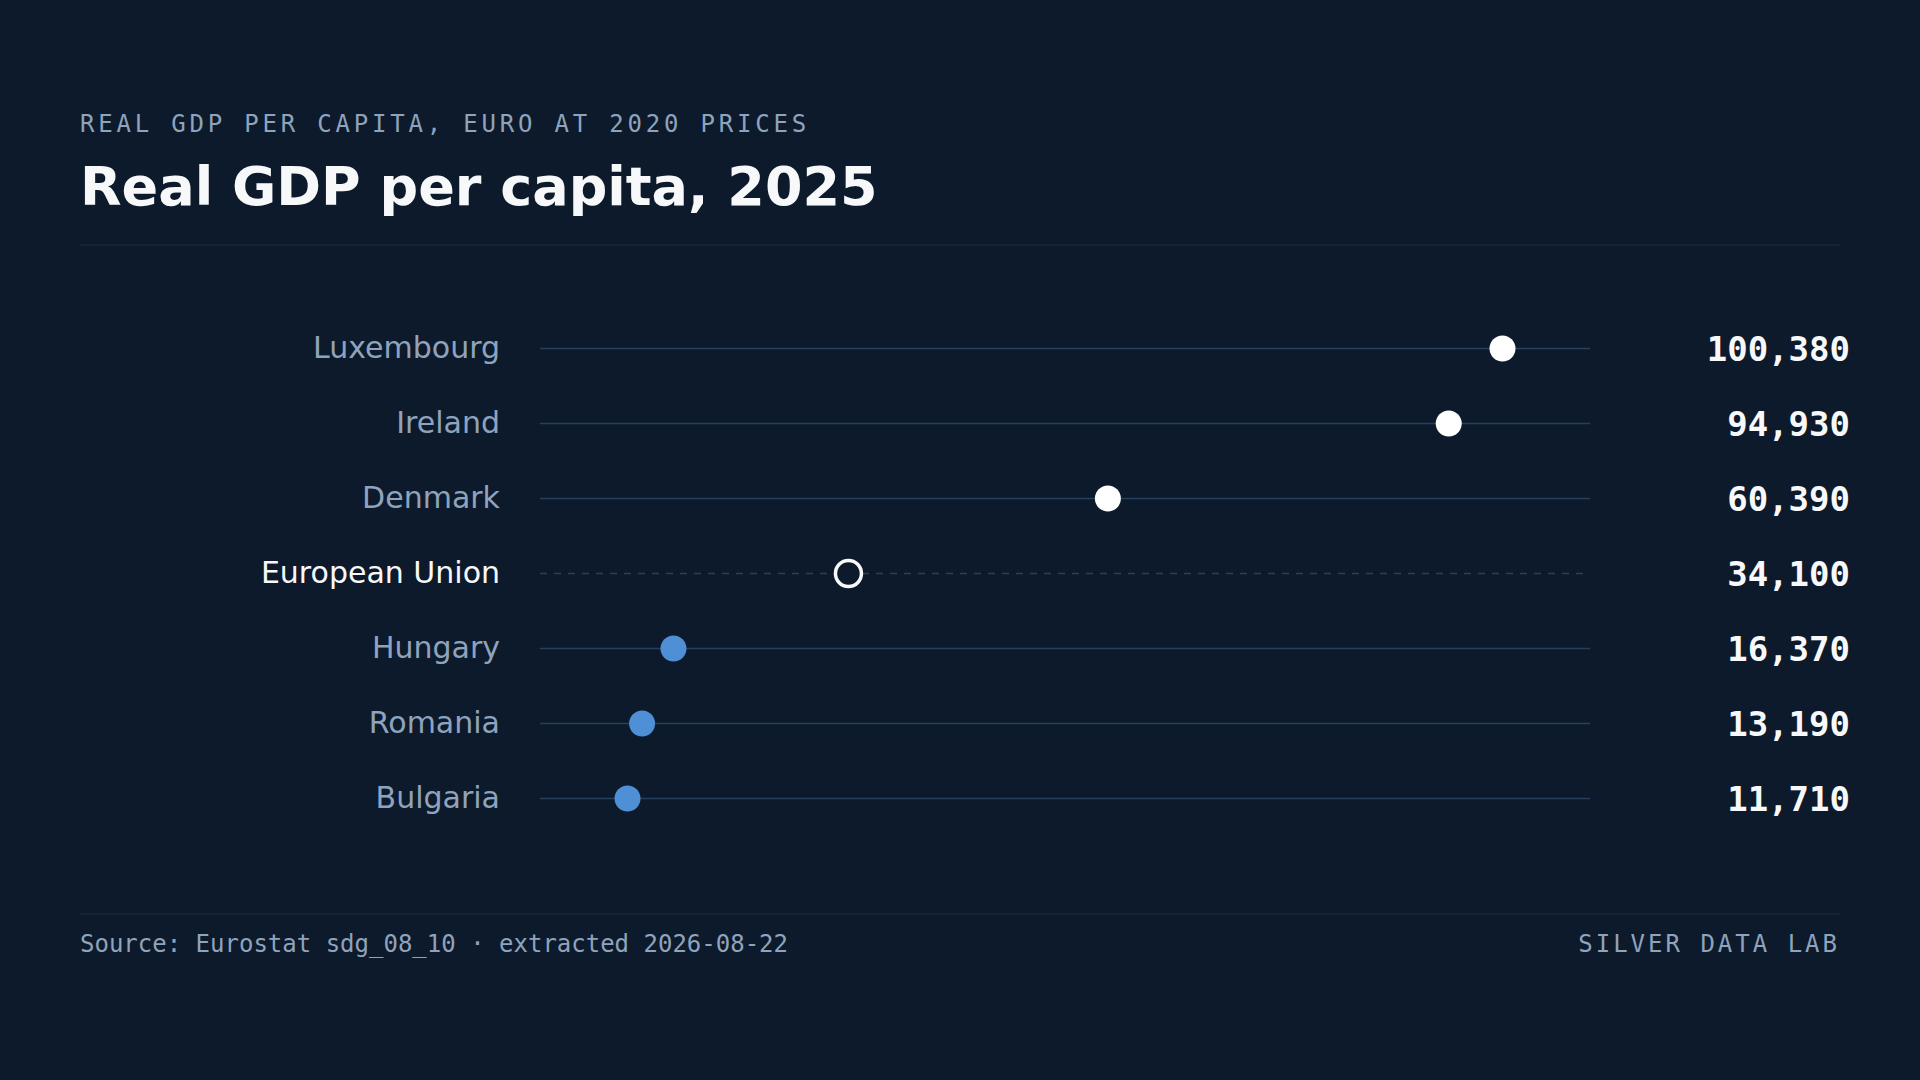
Bulgaria's GDP per Person Is About a Third of the EU Average
EU real GDP per capita was 34,250 euro in 2025, at 2020 prices.
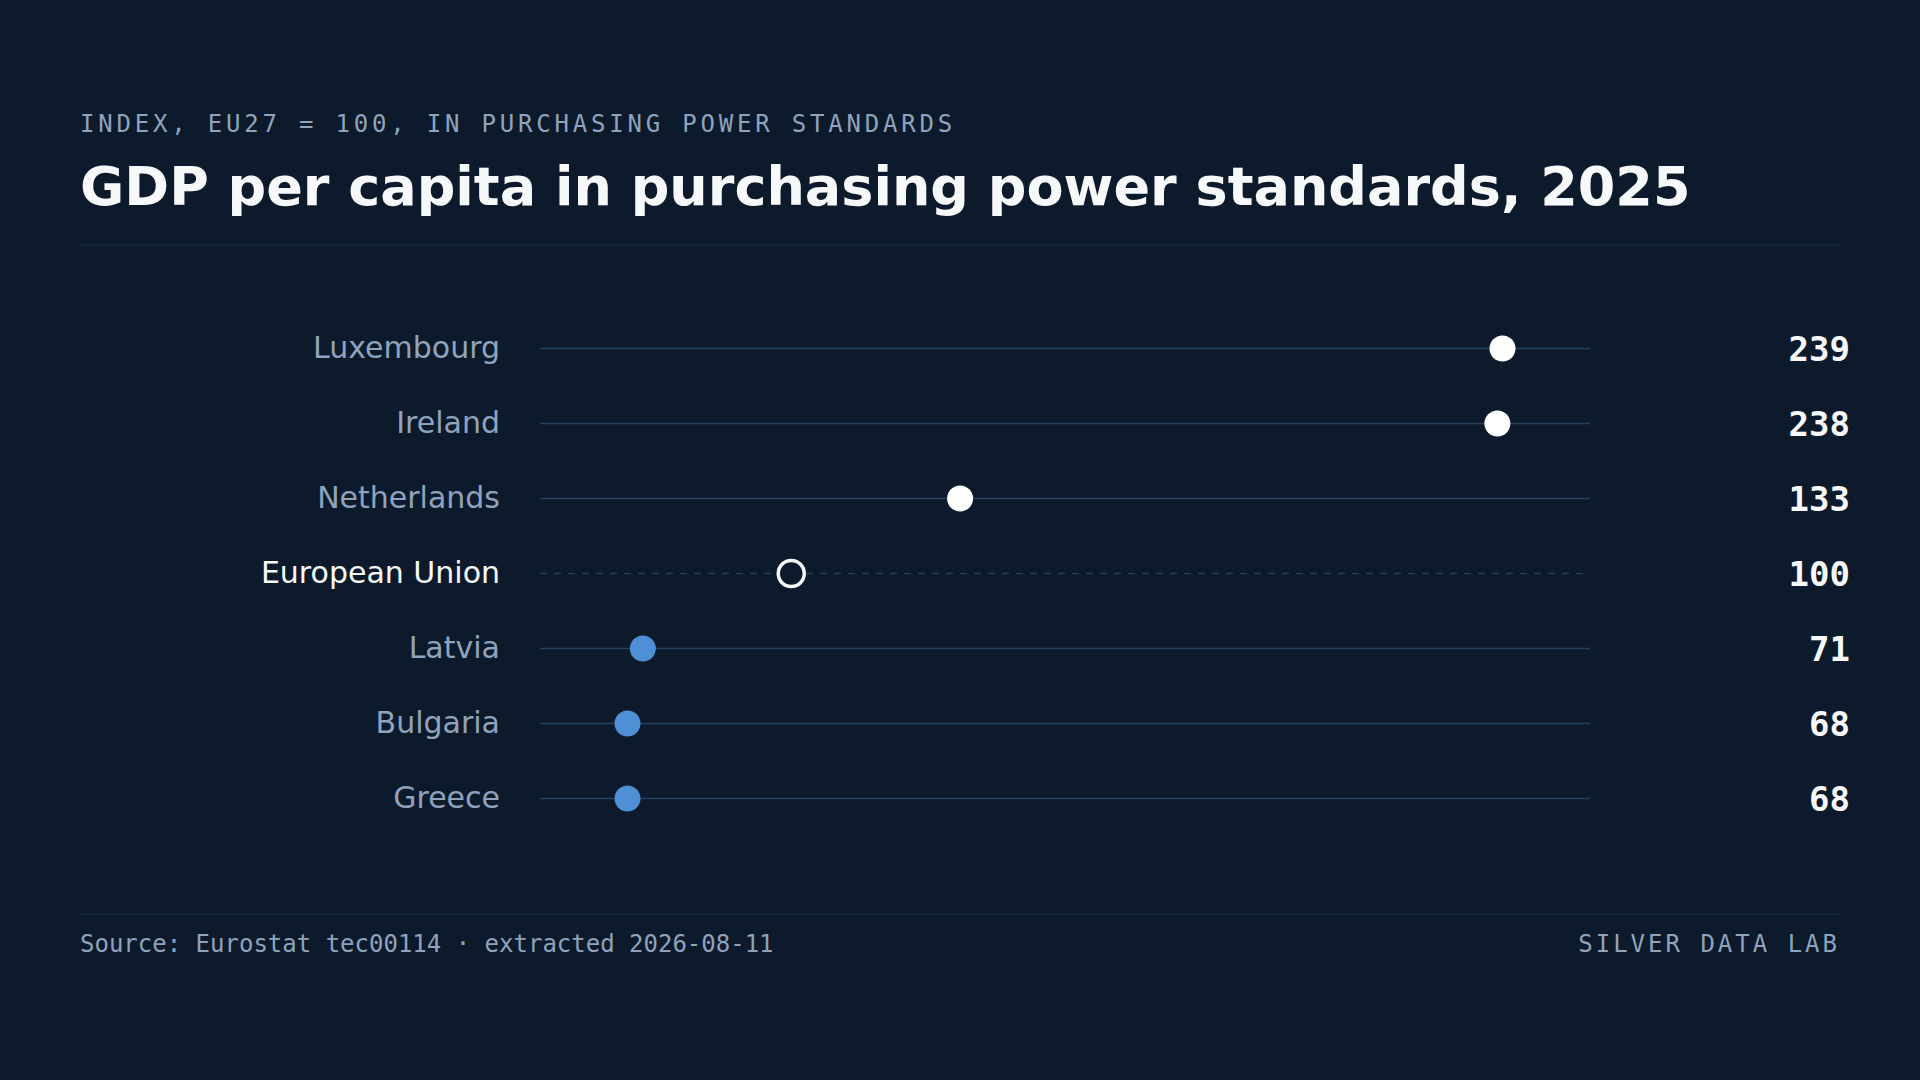
GDP per Head Makes Luxembourg and Ireland Look Richer Than They Are
Luxembourg records 239 and Ireland 238 against an EU average of 100 — more than double the Union's output per head.