In Ten Years EU Prices Rose but Mobile Phone Services Got 12% Cheaper
Silver Data Lab Research Desk · Statistical analysis · Published on 30 October 2026
- Data source
- Eurostat
- Reference period
- 2015-2025
- Last updated
- 30 October 2026
Re-checked against the source on 30 October 2026. No value in its datasets has moved between the snapshots we hold. Every revision we have observed →
Key estimates
- Between 2015 and 2025 consumer prices in the EU rose 32.9%, while the price of mobile phone services fell 12.0%.
- Mobile phone services became cheaper in 15 of the 27 Member States; the price fell 54.9% in the Netherlands, 41.1% in Austria and 35.9% in Denmark.
- In 26 Member States mobile prices fell or rose less than consumer prices as a whole. Finland is the exception: 37.2% for mobile services against 22.0% for all prices.
- Internet access rose less than prices overall in all 23 Member States whose index for it covers the whole period, and became cheaper in 11 of them.
- In 2025 alone the price of mobile services in the EU fell 3.0% while consumer prices rose 2.5%; the steepest fall was in France, at 15.8%.
How telecom prices are measured
Inflation in the EU is measured with one common instrument, the harmonised index of consumer prices, which follows what households pay for the same goods and services from one year to the next. Since the release of its January 2026 figures Eurostat has published that index under a revised classification of spending, which gives telecommunications four separate indices: fixed lines, mobile phone services, internet access, and bundles that sell several of these together. This study follows those four against the index of all prices, from 2015, the first year in which all 27 Member States publish a figure for mobile services, to 2025.
In practice, the index shows how the price of a particular type of mobile plan has changed. It does not show how much a household spends on its phone, because that also depends on how much the household uses it and what it decides to buy.
Phone and internet prices fell behind inflation
Across the EU, consumer prices as a whole rose 32.9% between 2015 and 2025. None of the four telecom indices came close. Fixed-line services rose 13.4% and bundled packages 9.2%, while internet access fell 3.6% and mobile phone services fell 12.0%.
On Eurostat's published rates, the mobile index for the EU has not risen in a single year of the period. It fell in ten of the eleven years from 2015 to 2025 and its rate was 0.0% in 2021. In 2022, when consumer prices rose 9.2%, the price of mobile services fell 1.0%; in 2025 it fell 3.0% against overall inflation of 2.5%.
Where mobile services became much cheaper
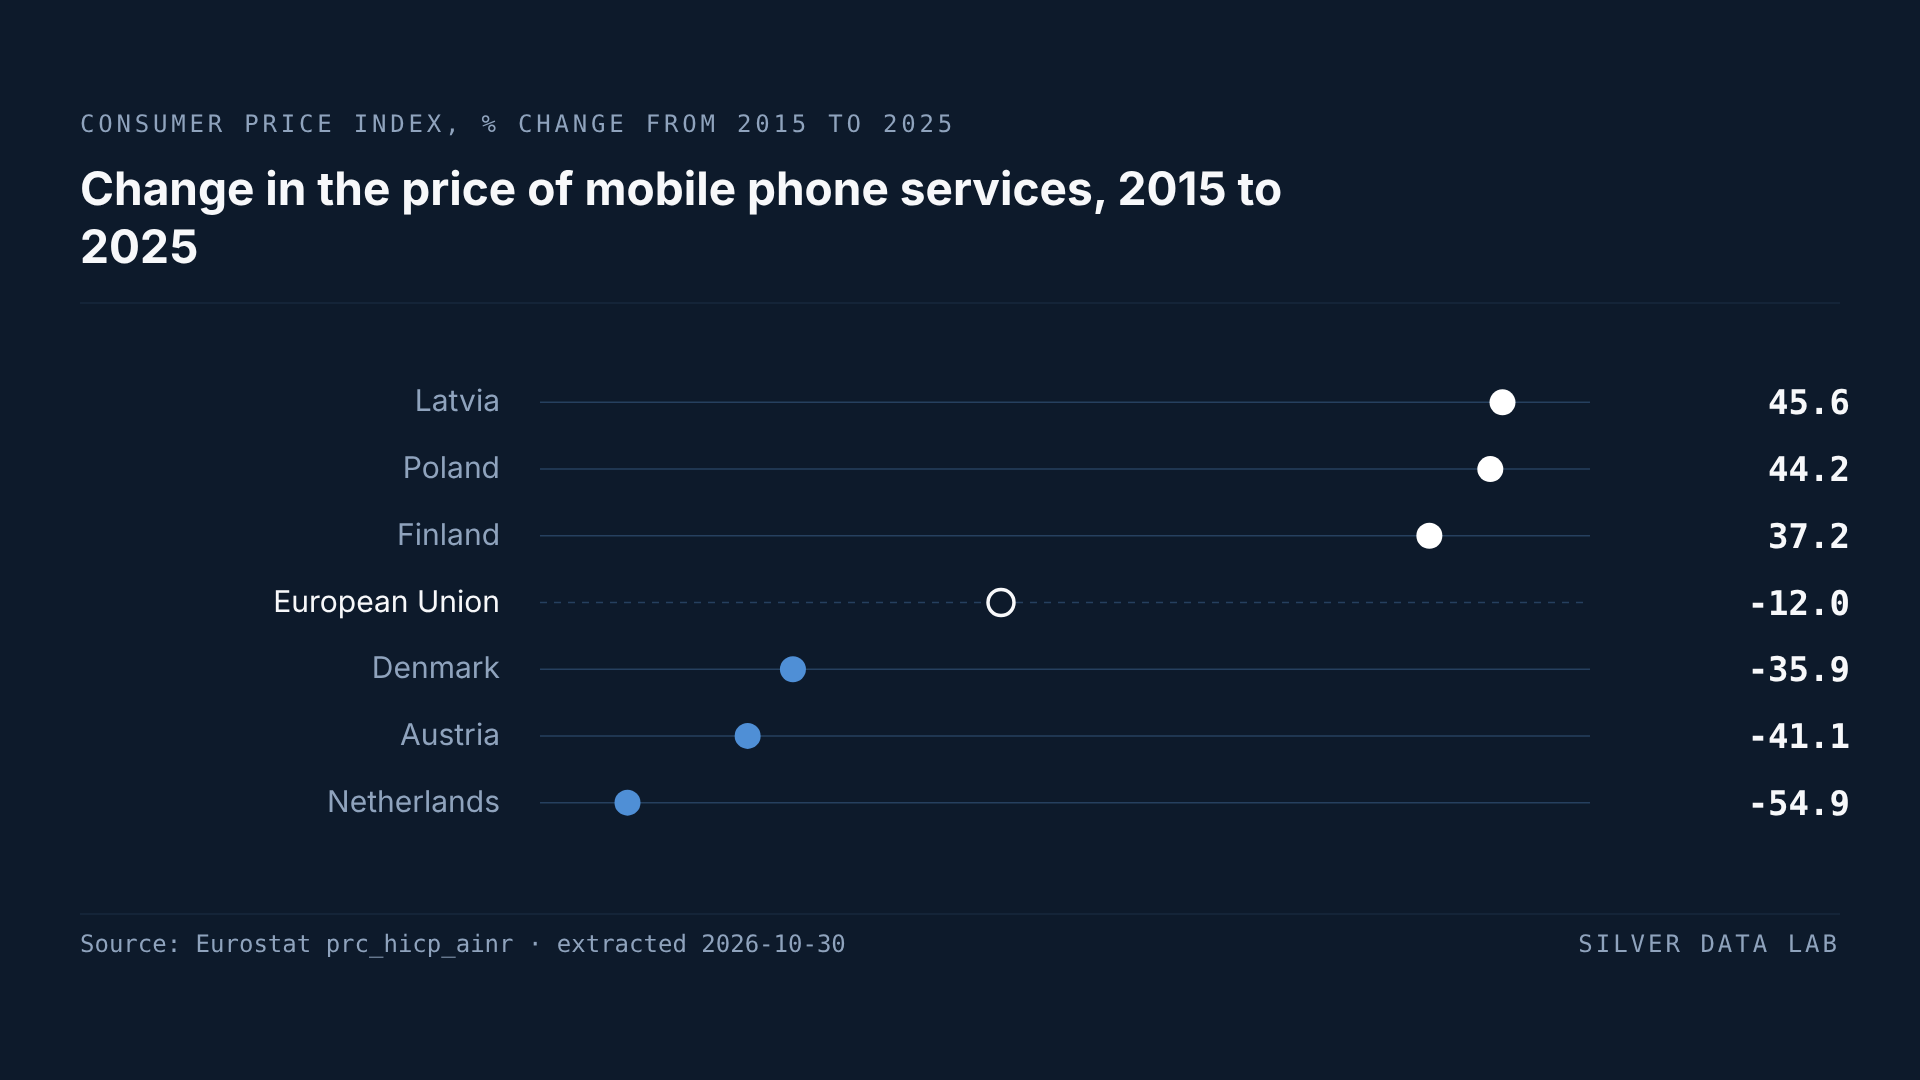
The price of mobile phone services fell in 15 Member States over the ten years. In the Netherlands it more than halved, falling 54.9%, and it dropped in every year from 2016 to 2025. Austria follows with a fall of 41.1%, then Denmark at 35.9%, France at 35.8% and Belgium at 34.3%.
Italy sits in the same group. Mobile services there cost 18.4% less in 2025 than in 2015 and internet access 15.3% less, while the price of fixed-line services rose 12.1% and prices as a whole 24.2%.
Where mobile prices rose
In the other 12 Member States the mobile index rose, but in 11 of them by less than prices as a whole. Latvia records the largest increase, 45.6%, and Poland 44.2%, yet overall prices there rose 50.9% and 53.7%. Slovakia's mobile services rose 31.3% against 49.2% for all prices.
Finland is the one Member State where mobile services became dearer relative to everything else. Their price rose 37.2% over the ten years while consumer prices rose 22.0%, and the Finnish mobile index went up in every year from 2016 to 2025. Its overall prices rose less than in all but three Member States, Cyprus, Denmark and Ireland.
Fixed lines and bundles
Fixed-line services are published for 22 Member States, and in 19 of them they fell or rose less than prices overall. The three exceptions are Belgium, where fixed services rose 58.3% against 35.5%, Latvia, at 57.6% against 50.9%, and Bulgaria, at 54.2% against 42.5%.
Bundles are harder to follow. Many Member States began publishing a separate index for them only after 2015, and three publish none for 2025, so a ten-year comparison is possible for 14 countries. In all 14 the price of bundles rose less than consumer prices, and in two of them, Croatia and Germany, it fell.
What the comparison does not show
The four indices measure prices. They do not show whether households pay less for their phones and their internet than they did, because what a household buys can change while an index holds it constant in order to measure price alone. Nor do they explain why the Netherlands and Finland moved so far apart: an index records what happened to a price, not why.
Change in the price of mobile phone services, 2015 to 2025
| Country | % change from 2015 (derived) | Gap to EU averagepercentage points, derived |
|---|---|---|
| Latvia | 45.6 | +57.6 |
| Poland | 44.2 | +56.2 |
| Finland | 37.2 | +49.2 |
| European Unionaggregate | -12.0 | — |
| Denmark | -35.9 | −23.9 |
| Austria | -41.1 | −29.1 |
| Netherlands | -54.9 | −42.9 |
This table as data: CSV · JSON
Every Member State for this indicator+
Members see every Member State for this indicator here, not only the rows the ranking prints. Become a Member
Embed this chart
Paste this code into a page. The frame carries the source and the extraction date, and links back to the study.
Change in the price of mobile phone services in 2025
| Country | annual average % change | Gap to EU averagepercentage points, derived |
|---|---|---|
| Poland | 8.6 | +11.6 |
| Croatia | 6.2 | +9.2 |
| Finland | 4.1 | +7.1 |
| European Unionaggregate | -3.0 | — |
| Belgium | -12.6 | −9.6 |
| Austria | -12.7 | −9.7 |
| France | -15.8 | −12.8 |
This table as data: CSV · JSON
Every Member State for this indicator+
Members see every Member State for this indicator here, not only the rows the ranking prints. Become a Member
Embed this chart
Paste this code into a page. The frame carries the source and the extraction date, and links back to the study.
What these figures cannot tell you
- The index tracks prices, not household spending
- The index follows the price of comparable services. A plan that now includes far more for the same monthly payment can register as a price fall in this measure with no change in what the household spends, and a household that has moved to a dearer plan can spend more while the index falls. What households spend on telecommunications is a different statistic and is not used here.
- Countries adjust for quality in different ways
- When a tariff changes what it includes, the national statistical office that compiles the index is required to adjust for it, separating the change in price from the change in the service. Eurostat's metadata for the index notes that differences among these quality-adjustment procedures between countries could make results less comparable, and the differences between countries in this study should be read with that in mind.
- A series compiled under the 2026 classification
- Eurostat applied the revised classification of spending to the whole series when it introduced it with the January 2026 data. The figures here for 2015 to 2025 are therefore the reclassified series and may not match telecom figures published before 2026 under the old classification.
- Not every country publishes every index
- Mobile services are published for all 27 Member States from 2015. Fixed-line services are missing for Ireland, Malta, the Netherlands, Austria and Finland in 2025, internet access for Estonia, Spain and Malta, with the Dutch series interrupted from 2020 to 2024, and bundles for Czechia, Finland and Sweden, with many other countries starting their bundle series after 2015. The rankings therefore rest on mobile services alone.
- Annual averages
- Each year's figure is the average of its twelve monthly indices, so a change over the period compares the average level of 2025 with the average level of 2015, not a single month with another.
Frequently asked questions
- Have phone and internet prices kept up with inflation in the EU?
- No. Between 2015 and 2025 consumer prices in the EU rose 32.9%. Over the same years fixed-line services rose 13.4% and bundles 9.2%, while internet access fell 3.6% and mobile phone services fell 12.0%.
- Where did the price of mobile phone services fall most?
- In the Netherlands, where their price fell 54.9% between 2015 and 2025. Austria follows with 41.1% and Denmark with 35.9%. In all, mobile services became cheaper in 15 of the 27 Member States.
- Is there an EU country where mobile prices rose faster than inflation?
- One: Finland, where the price of mobile services rose 37.2% between 2015 and 2025 while consumer prices rose 22.0%. In Latvia and Poland mobile prices rose more, by 45.6% and 44.2%, but overall prices there rose more still.
- What happened in Italy?
- Mobile phone services cost 18.4% less in 2025 than in 2015 and internet access 15.3% less, while fixed-line services rose 12.1% and consumer prices as a whole 24.2%.
- Does a fall in the price index mean a lower phone bill?
- Not necessarily. The index measures the price of comparable services, so a plan that offers more for the same money can count as a fall. What a household pays also depends on how much it uses and which plan it chooses.
Methodological note
The measure is the harmonised index of consumer prices in Eurostat's ECOICOP version 2 annual table: the annual average index, with 2025 = 100, and the annual average rate of change, for all items (TOTAL) and for four telecommunication services, fixed communication (CP0831), mobile communication (CP0832), internet access provision and online storage (CP0833) and bundled telecommunication services (CP0834). Values cover the 27 Member States and the EU aggregate; no value used carries a Eurostat flag.
The yearly rates of change quoted for single years, including the whole second ranking, are published by Eurostat. Silver Data Lab derived the changes between 2015 and 2025, each one the 2025 annual average index divided by the 2015 annual average index of the same series and geography, minus one, as a percentage; the comparison of each telecom index with the all-items index of the same country; the counts of Member States in which an index fell, rose, or rose less than all prices; the years in which an index rose or fell, read from the published rates; and the ranks. Nothing else is computed.
Source data
The underlying series can be inspected and re-downloaded from the Eurostat data browser. The filters below are the ones applied.
HICP - ECOICOP ver.2 - indices and rates of change, annual data
prc_hicp_ainr
- Filters applied:
- freq=A · unit=INX_A_AVG, RCH_A_AVG · coicop18=TOTAL, CP0831, CP0832, CP0833, CP0834
- Extracted:
- 2026-10-30
- Source last updated:
- 2026-09-17
Download the data
The data the study you have just read is built on, exactly as it was downloaded and archived.
Yours as a Member.
Data downloadable by Members
How to cite
Record the vintage as well as the study: the figures on this page are the ones extracted on the dates below.
Silver Data Lab Research Desk (2026). In Ten Years EU Prices Rose but Mobile Phone Services Got 12% Cheaper. Silver Data Lab, published 30 October 2026, last updated 30 October 2026. https://www.silverdatalab.com/studies/phone-and-internet-prices-in-the-eu
- Data: Eurostat, HICP - ECOICOP ver.2 - indices and rates of change, annual data (prc_hicp_ainr), filters freq=A, unit=INX_A_AVG, RCH_A_AVG, coicop18=TOTAL, CP0831, CP0832, CP0833, CP0834; extracted 2026-10-30; source last updated 2026-09-17. https://doi.org/10.2908/prc_hicp_ainr
Silver Data Lab's analysis is licensed CC BY 4.0. The statistics remain their publisher's and keep its terms of reuse.
Ask the research desk
A question about this study — a definition, a filter, a break in the series, what the figures can and cannot support — answered by the desk that made the extraction.
Members can write to the research desk
Studies where the same country leads or trails
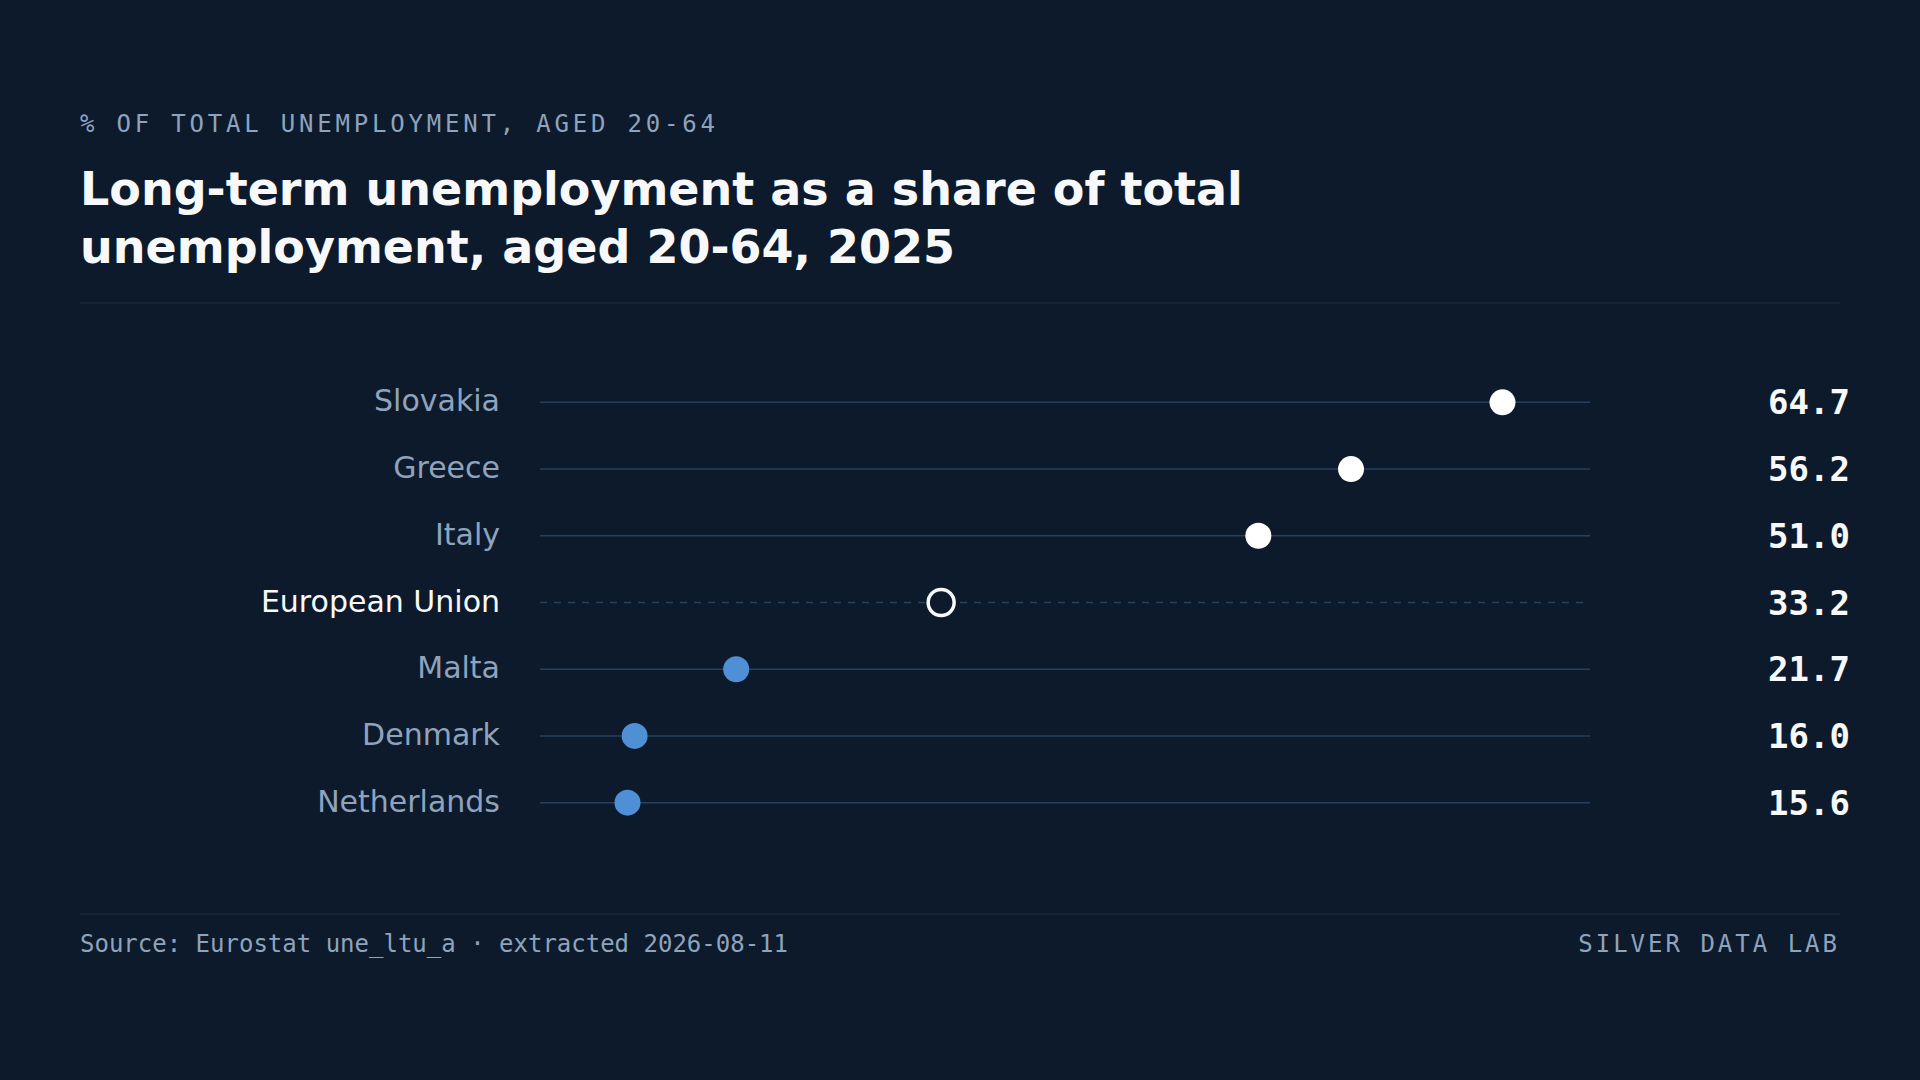
A Third of the EU's Unemployed Have Been Out of Work for a Year or More
33.2% of unemployed people aged 20 to 64 in the EU had been out of work for twelve months or more in 2025 — 4.0 million people.
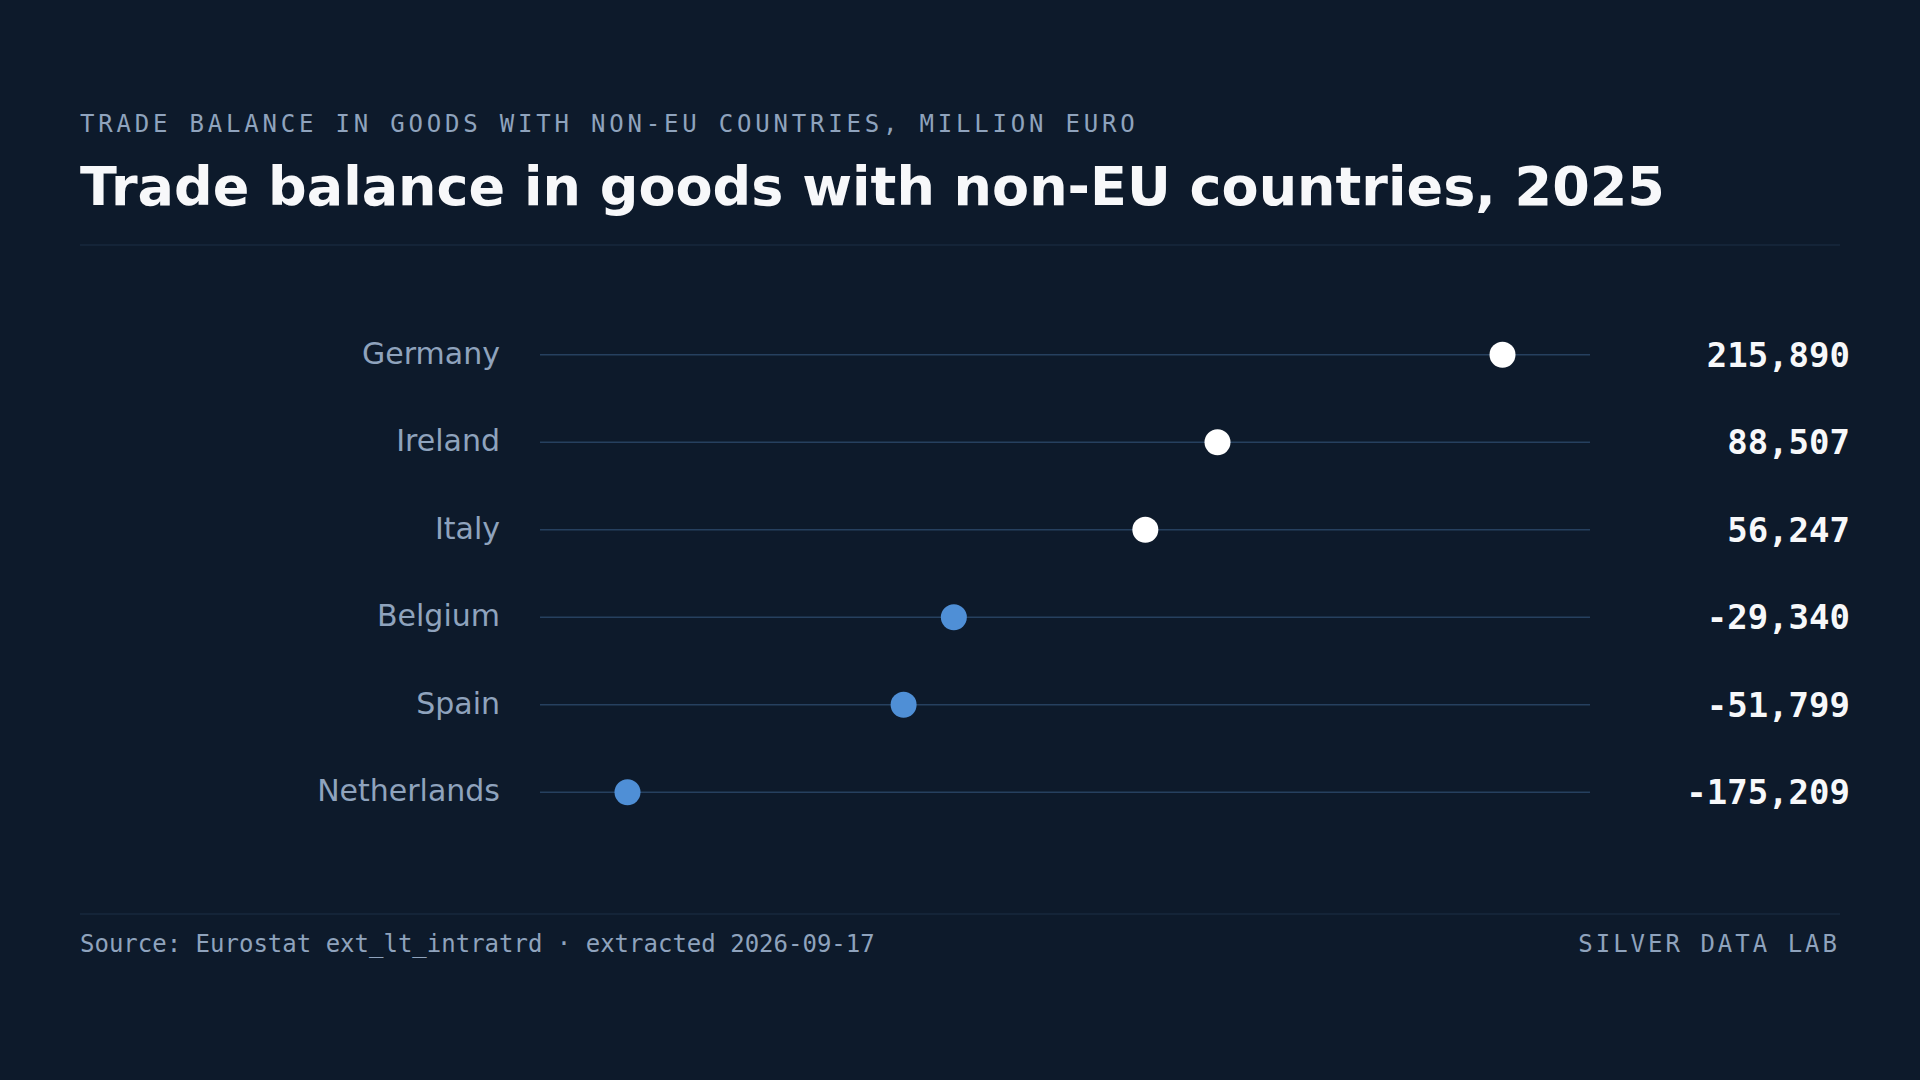
Germany Has the EU's Biggest Trade Surplus in Goods With Non-EU Countries
EU Member States together ran a goods trade surplus of 106.2 billion euro with countries outside the Union in 2025.
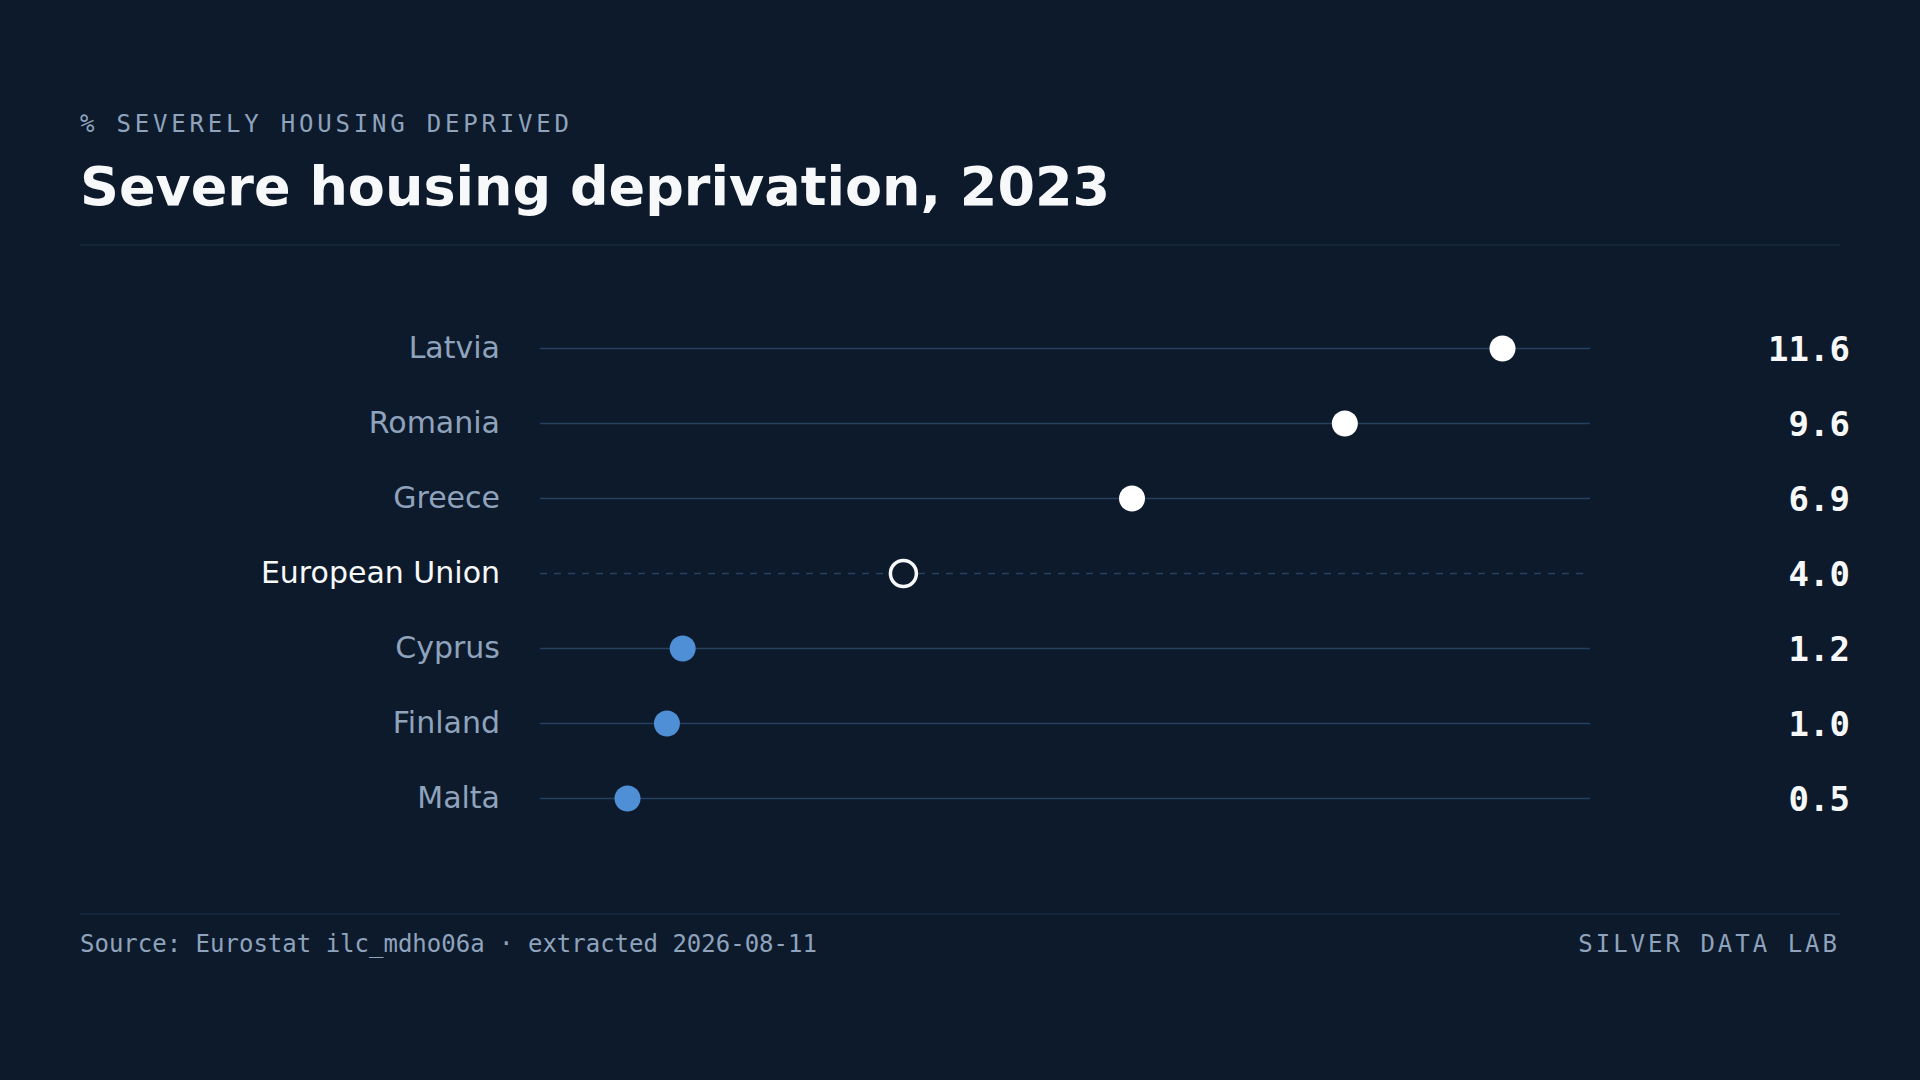
More Than One Latvian in Nine Lives in a Crowded, Run-Down Home
4.0% of the EU population lived in severely deprived housing in 2023.