France Has Both the EU's Poorest Region and One of Its Richest
Silver Data Lab Research Desk · Statistical analysis · Published on 13 February 2026
This study is open to members only
Its sources, filters and extraction date are declared above, as they are for every study. Sign in to read the analysis in full.
- Data source
- Eurostat
- Reference period
- 2024
- Last updated
- 22 October 2026
Re-checked against the source on 20 October 2026. No value in its datasets has moved between the snapshots we hold. Every revision we have observed →
Key estimates
- The published EU figure for GDP per capita was 39,900 purchasing power standards in 2024, and this study ranks the Union's 244 NUTS 2 regions against it.
- Eastern and Midland in Ireland records 107,200, or 269% of the EU average.
- Mayotte records 12,000, or 30%.
- Nineteen regions are above 150% of the EU average and thirteen below 50%.
- France contains the poorest region in the Union and, in Île de France, one of the richest — a spread of 5.3 to one, the widest inside any Member State.
What national averages hide
A national GDP figure averages a country's regions together. Europe's statistical grid divides the Union into 244 regions — the level statisticians call NUTS 2 — and the distance between them is far wider than the distance between Member States.
The EU average in 2024 was 39,900 purchasing power standards per inhabitant. The regional figures run from 107,200 to 12,000: a ratio of nearly nine to one. The same dataset also publishes a value for each country, and between the highest and lowest Member State the ratio is 3.7 to one — less than half as wide.
The top, and the caution attached to it
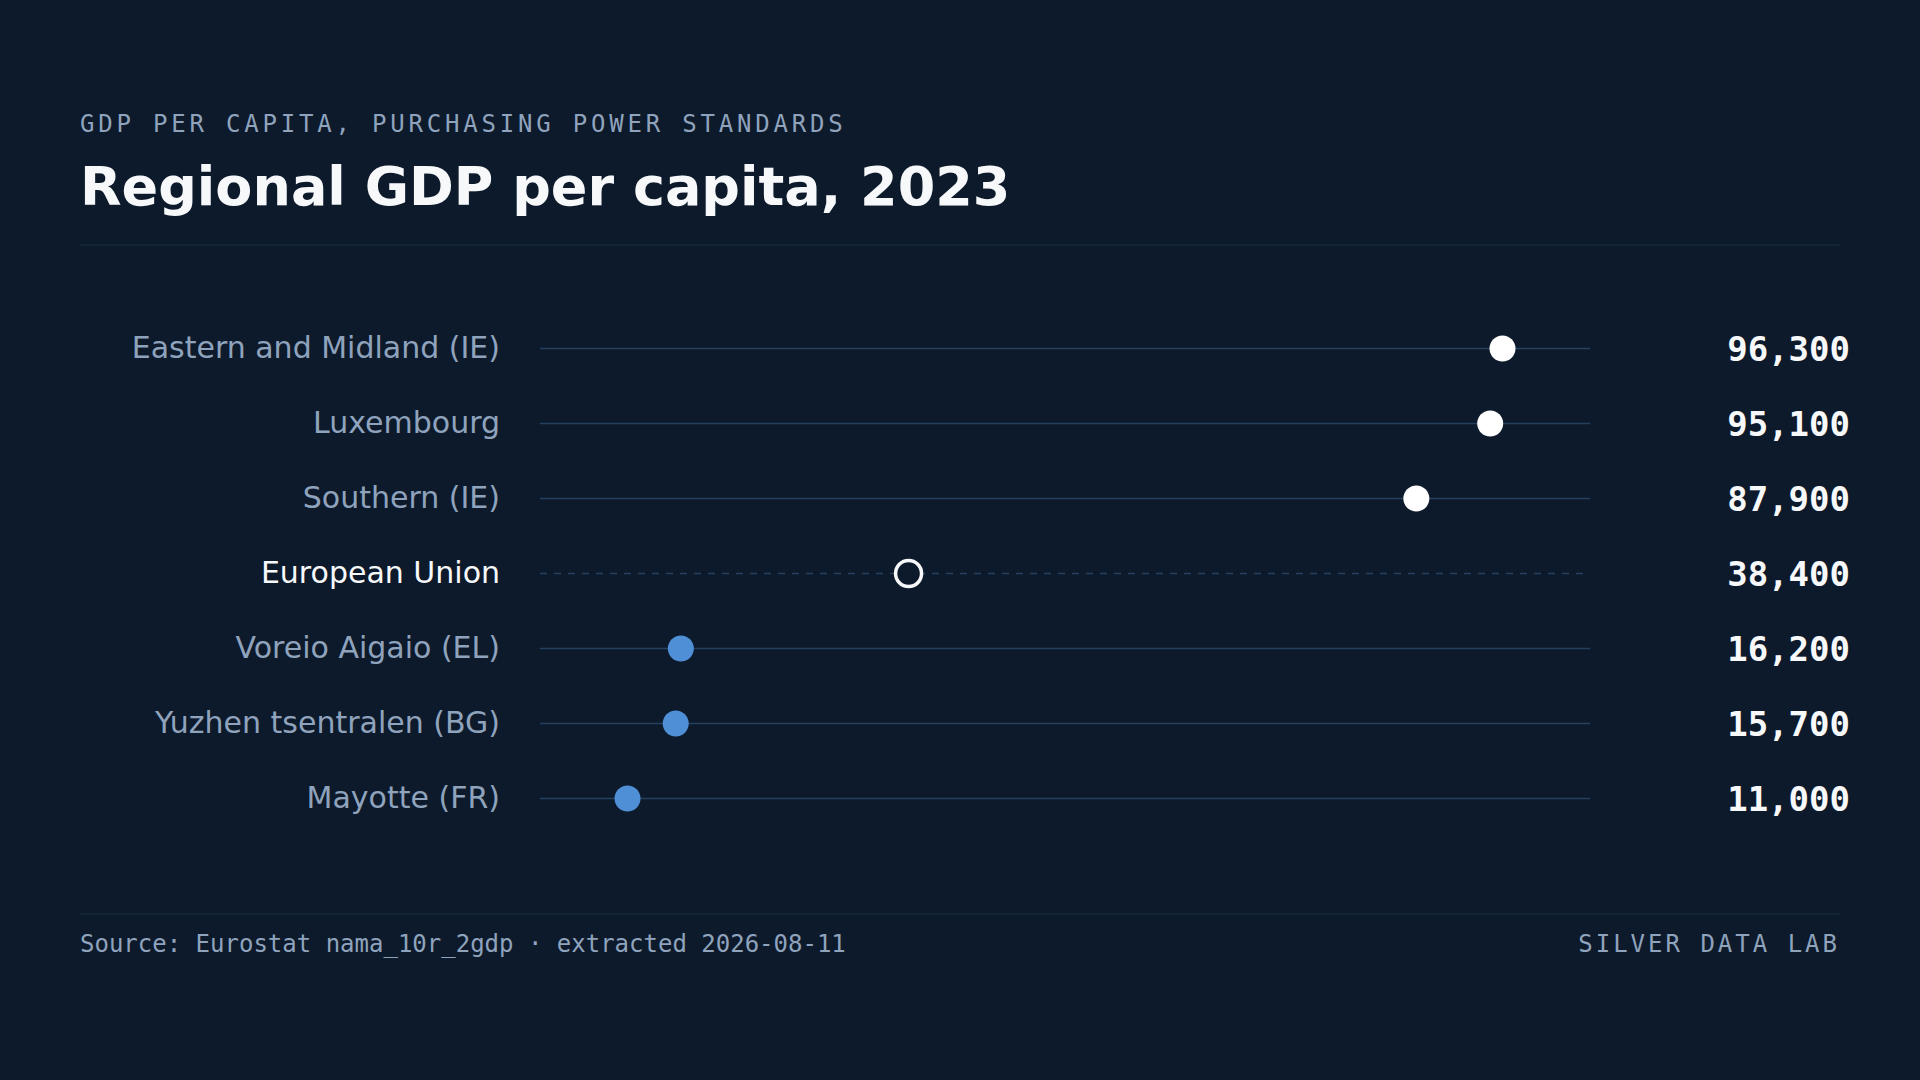
Eastern and Midland in Ireland records 107,200, Luxembourg 97,700 and Southern in Ireland 86,500.
The Irish regions carry the same distortion as the Irish national figure. Output booked by foreign-owned firms enters Irish GDP, and both Irish regions are affected. Neither number describes what people in them earn, and the companion study on national GDP per capita sets out the mechanism.
Behind those, Hamburg records 78,300, Praha 76,600, Brussels 76,000 and Bucureşti-Ilfov 75,000.
The commuting distortion
Hamburg, Praha, Brussels, Bucureşti-Ilfov, Hovedstaden around Copenhagen, Budapest: the top of this ranking is a list of capital and major-city regions.
Part of that is real — capitals concentrate high-value activity — and part of it is measurement. Regional GDP counts output where it is produced. Population is counted where people live. Anyone who commutes into a capital adds to its output and to the population of the region they sleep in.
For a small, tightly drawn capital region with a large commuter belt, this inflates GDP per capita substantially and deflates it in the surrounding region. Brussels records 76,000 against neighbouring Prov. Vlaams-Brabant at 50,900; starker still is Bucureşti-Ilfov at 75,000 against Sud-Muntenia around it at 21,800.
This is the same measurement issue that produces the capital-city paradox in regional employment data, and it means a capital region's position on this ranking should never be read as the income of the people living there.
The gaps inside countries
The widest divergences are internal.
France contains Île de France at 64,000 and Mayotte, a French department in the Indian Ocean, at 12,000 — a ratio of 5.3 to one inside a single Member State, and wider than the gap between the richest and poorest EU countries. The two lowest regions in the Union are both French: Mayotte, and Guyane at 16,300.
Romania follows: Bucureşti-Ilfov at 75,000 against Nord-Est at 19,300, a ratio of 3.9. Then Hungary at 3.6 with Budapest against Észak-Magyarország, and Czechia at 3.1 with Praha against Severozápad.
At the other end, Finland's internal ratio is 1.4, Austria's 1.7 and Sweden's 1.8. These are countries where where you live matters comparatively little for the output around you.
The pattern is that central and eastern Member States have one region far ahead of the rest, usually the capital, and the Nordic countries do not. Convergence between EU countries and convergence within them are different processes. A single year cannot show whether the second is following the first; what it does show is how much is left to close.
Regional GDP per capita, 2024
| Country | purchasing power standards per inhabitant | Gap to EU averagederived |
|---|---|---|
| Eastern and Midland (IE) | 107,200e | +67,300.0 |
| Luxembourg | 97,700 | +57,800.0 |
| Southern (IE) | 86,500e | +46,600.0 |
| European Unionaggregate | 39,900 | — |
| Severozapaden (BG) | 16,700 | −23,200.0 |
| Guyane (FR) | 16,300p | −23,600.0 |
| Mayotte (FR) | 12,000p | −27,900.0 |
Flags carried by the source on these values: e estimated · p provisional
This table as data: CSV · JSON
Every Member State for this indicator+
Members see every Member State for this indicator here, not only the rows the ranking prints. Become a Member
What these figures cannot tell you
- Produced here, lives there
- GDP is measured where output occurs and divided by resident population. Commuters inflate capital regions and deflate their surroundings, which affects every capital in this ranking and makes regional GDP per capita a poor proxy for regional income.
- Ireland is distorted by multinational accounting
- Output booked by foreign-owned firms enters Irish GDP and therefore Irish regional figures. Both Irish regions in the top three are affected, and neither describes local earnings.
- Non-EU regions are in the source and excluded here
- The dataset covers candidate countries and EFTA states. Turkish and Serbian regions occupy several of the lowest positions in the raw data; this study reports EU regions only, so those are not shown.
- 2024, not 2025
- Regional accounts are compiled with a longer lag than national ones. These figures are a year behind the national GDP study on this site and are not directly comparable with it.
- Purchasing power standards are national, not regional
- The unit adjusts for price differences between countries, not within them: the same national price level is applied to every region of a Member State, so a capital and a rural region are converted at the same rate although costs differ between them. The comparisons this study makes are mostly within countries, which is exactly where that adjustment is absent.
- France's spread hangs on one overseas department
- The 5.3 ratio that makes France the widest Member State here is Île de France over Mayotte: the numerator is a mainland region and only the denominator is overseas. Guyane, the next lowest French region, plays no part in it — setting Mayotte aside and keeping Guyane gives 3.9. Across the twenty-two regions of mainland France and Corsica the ratio is 2.2, below Italy's 2.8 and Germany's 2.4. France is the widest on the published figures and among the narrower on the mainland alone, and both are true.
- Most of these values are not final
- Eurostat flags 142 of the 244 EU regional values as provisional and a further 33 as estimated, leaving 69 unflagged. The Irish regions at the top of the ranking are estimated, and Mayotte and Guyane at the bottom are provisional. The shape of the distribution is not in doubt, but individual regions can move when the accounts are finalised.
Frequently asked questions
- Which is the richest region in the EU?
- Eastern and Midland in Ireland, at 107,200 purchasing power standards per inhabitant in 2024 — 269% of the EU average. Like the Irish national figure, it is inflated by output booked by foreign-owned firms and does not describe local earnings.
- Which is the poorest region in the EU?
- Mayotte, a French overseas region, at 12,000 purchasing power standards per inhabitant — 30% of the EU average. Guyane, also French, is next at 16,300; the lowest mainland region is Severozapaden in Bulgaria at 16,700.
- Are regional gaps wider within countries or between them?
- Within. France contains both Île de France at 64,000 and Mayotte at 12,000, a ratio of 5.3 to one inside one Member State — wider than the 3.7 between the richest and poorest EU countries. Romania, Hungary and Czechia follow, while Finland's internal ratio is only 1.4.
- Why do capital regions score so high?
- Partly because they concentrate high-value activity, and partly because of measurement. GDP is counted where output is produced while population is counted where people live, so commuters raise a capital's GDP per capita and lower that of the regions they commute from.
Methodological note
Eurostat publishes regional gross domestic product by NUTS 2 region in purchasing power standards per inhabitant, which adjusts for price level differences between countries.
Values are for 2024, the most recent year in the dataset at the extraction date, covering 244 EU NUTS 2 regions. The dataset also contains regions of candidate and EFTA countries; those are excluded here, and the EU average shown is the published EU27 figure. Eurostat's own observation flags are read from the extraction alongside its values, and most of the 2024 regional figures carry one.
The regional indices against the EU average, the counts above 150% and below 50%, and the within-country ratios between each Member State's highest and lowest region are computed by Silver Data Lab and labelled as derived. Within-country ratios are calculated only for Member States with at least three NUTS 2 regions; Finland is the narrowest under that rule. The count below half the EU average is sensitive to rounding, and the page states it knowing that: values are published to the nearest 100 purchasing power standards, and two Hungarian regions sit 50 on either side of the threshold, one counted and one not.
The national spread quoted for comparison comes from this study's own extraction rather than another's: the same dataset publishes a value for each Member State beside the regional ones, so the ratio between the highest and lowest country is computed from the file declared below, at the same reference year and in the same unit.
Source data
The underlying series can be inspected and re-downloaded from the Eurostat data browser. The filters below are the ones applied.
GDP at current market prices by NUTS 2 region
nama_10r_2gdp
- Filters applied:
- freq=A · unit=PPS_EU27_2020_HAB · time=2024
- Extracted:
- 2026-10-20
- Source last updated:
- 2026-02-10
Download the data
The data the study you have just read is built on, exactly as it was downloaded and archived.
Yours as a Member.
Data downloadable by Members
How to cite
Record the vintage as well as the study: the figures on this page are the ones extracted on the dates below.
Silver Data Lab Research Desk (2026). France Has Both the EU's Poorest Region and One of Its Richest. Silver Data Lab, published 13 February 2026, last updated 22 October 2026. https://www.silverdatalab.com/studies/regional-gdp-in-the-eu
- Data: Eurostat, GDP at current market prices by NUTS 2 region (nama_10r_2gdp), filters freq=A, unit=PPS_EU27_2020_HAB, time=2024; extracted 2026-10-20; source last updated 2026-02-10. https://doi.org/10.2908/nama_10r_2gdp
Silver Data Lab's analysis is licensed CC BY 4.0. The statistics remain their publisher's and keep its terms of reuse.
Ask the research desk
A question about this study — a definition, a filter, a break in the series, what the figures can and cannot support — answered by the desk that made the extraction.
Members can write to the research desk