Shoppers in Eight EU Countries Buy Less Than They Did Four Years Ago
Silver Data Lab Research Desk · Statistical analysis · Published on 11 August 2026
This study is open to members only
Its sources, filters and extraction date are declared above, as they are for every study. Sign in to read the analysis in full.
- Data source
- Eurostat
- Reference period
- 2025
- Last updated
- 11 October 2026
Re-checked against the source on 25 October 2026. 12 values in its datasets moved between snapshots, 2 of them figures stated on this page. Every revision we have observed →
Key estimates
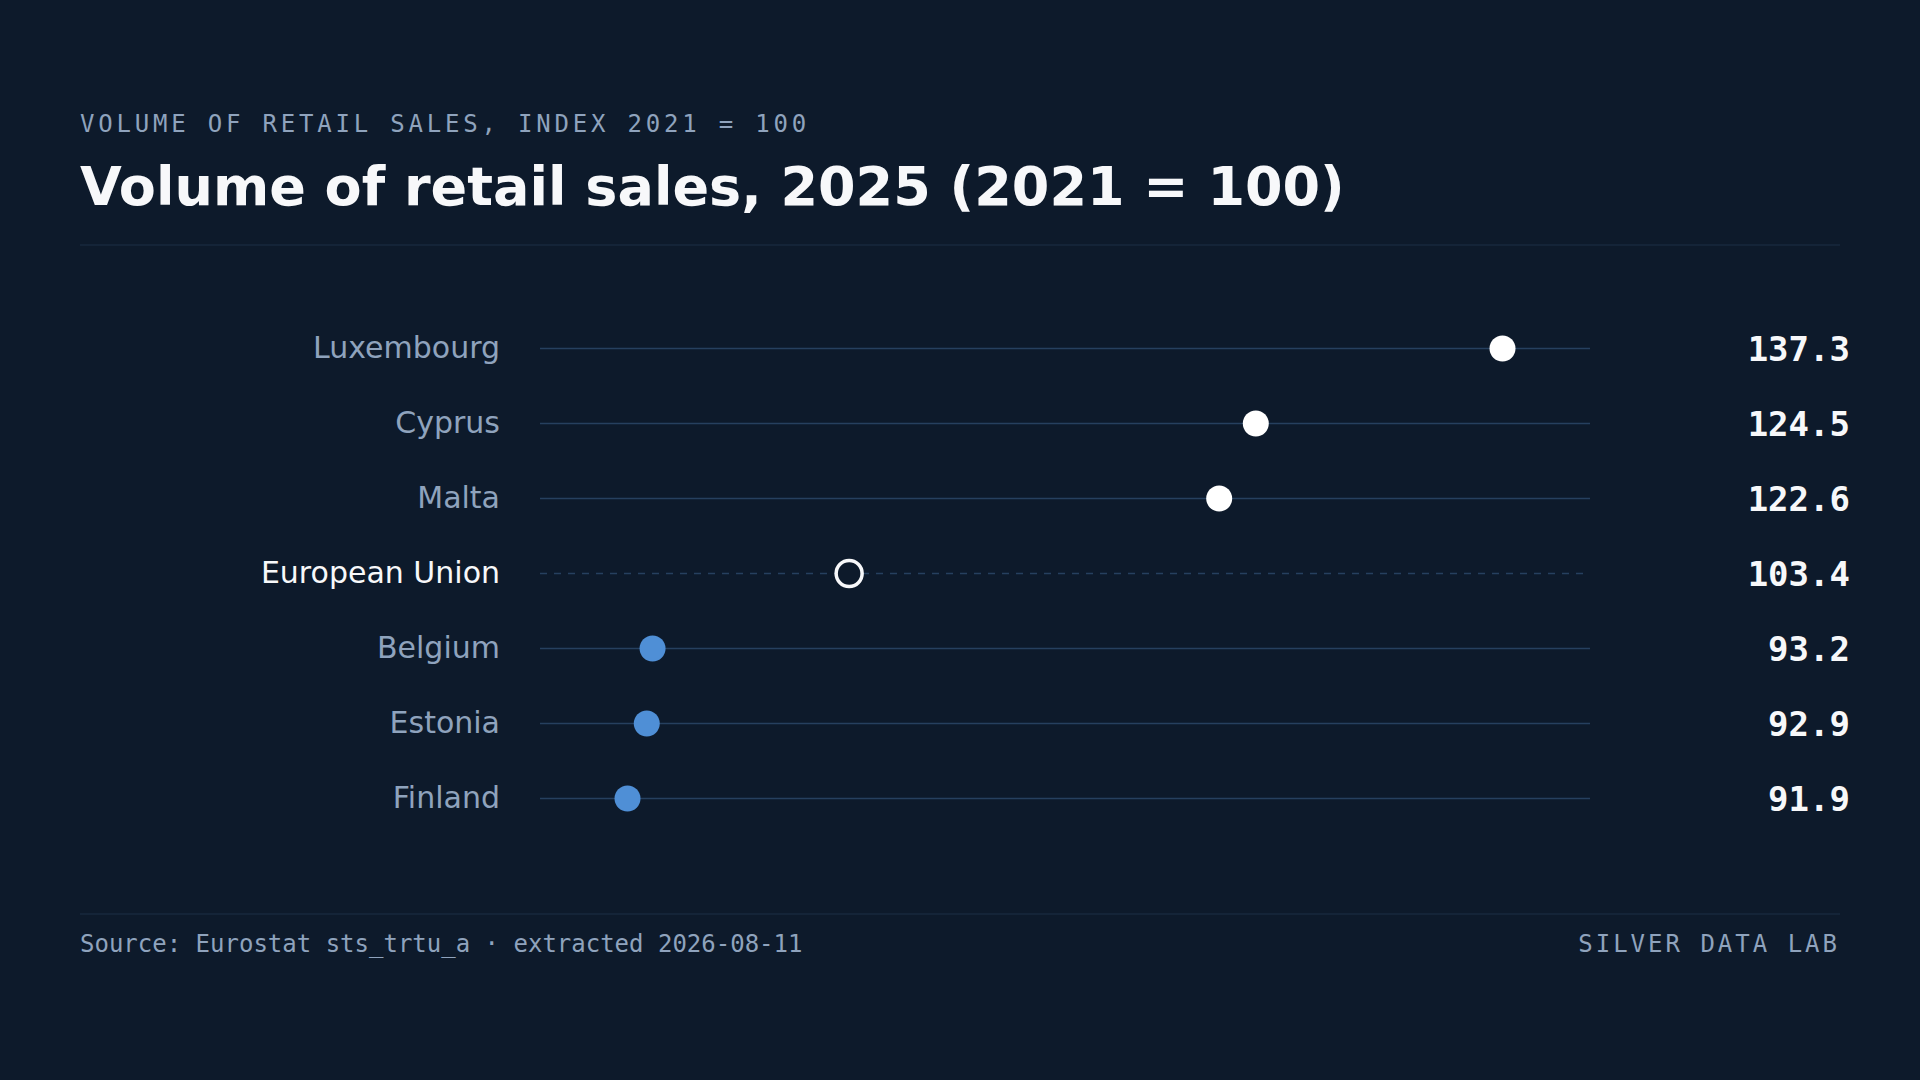
- EU retail sales volumes in 2025 stood at 103.4 against a 2021 base of 100 — 3.4% higher after four years.
- Finland is at 91.9, Estonia 92.9 and Belgium 93.2: retail volumes below their 2021 level.
- Eight Member States are below 100, meaning households bought less at retail in 2025 than four years earlier.
- Bulgaria at 120.9 and Romania at 115.8 grew fastest among the larger eastern economies.
- Germany at 100.6 is effectively flat across the whole four-year period.
What a volume index measures
Retail turnover can rise while people buy less, if prices rise faster than sales. The volume index removes that: it is adjusted for price changes, so it tracks the quantity of goods sold rather than the money spent on them.
Against a 2021 base of 100, EU retail volumes in 2025 stood at 103.4. Four years of growth totalling 3.4%.
The countries that went backwards
Eight Member States are below 100. Finland records 91.9, Estonia 92.9, Belgium 93.2, Sweden 96.5, Austria 97.1, Denmark 97.2, Italy 97.6 and Czechia 99.3.
In each of those countries, households bought less at retail in 2025 than they did in 2021. Finland and Estonia are roughly 8% below where they started.
The grouping is not poor. Denmark, Sweden, Austria and Belgium are among the Union's higher-income Member States, and all four are below their 2021 level. Nor is it one region: Italy is in the eight and Czechia is too. This is not a ranking of prosperity, and it is not a map.
The countries that grew
Luxembourg records 137.3, Cyprus 124.5 and Malta 123.9, all small economies where retail figures can move sharply for reasons that have little to do with domestic households — cross-border shopping in Luxembourg's case.
Bulgaria at 120.9, Croatia at 116.6, Romania at 115.8 and Portugal at 115.2 are the substantial cases. All four are large enough that the growth reflects domestic consumption, and all four are among the Union's lower-income Member States.
Germany, and what the EU figure hides
Germany records 100.6. Over four years, German retail volumes are essentially unchanged.
Because Germany is the Union's largest retail market, that flat line pulls the EU aggregate down, and 103.4 describes no country in particular rather than a common experience. The spread runs from 91.9 to 137.3 and it does not fall along a geographical line: Portugal at 115.2 and Spain at 111.2 grew strongly while Italy at 97.6 and Greece at 100.3 did not, and Bulgaria at 120.9 and Poland at 110.3 grew strongly while Estonia at 92.9 and Czechia at 99.3 did not. Neither the south nor the east moved as a bloc.
The period this covers ran through the energy price shock of 2022 and the inflation that followed it. A volume index strips the price effect out of the measurement, but not out of the behaviour — households facing higher energy and housing costs have less left for everything else, and this is what that looks like four years on.
Volume of retail sales, 2025 (2021 = 100)
| Country | index, 2021 = 100 | Gap to EU averagederived |
|---|---|---|
| Luxembourg | 137.3 | +33.9 |
| Cyprus | 124.5 | +21.1 |
| Malta | 123.9 | +20.5 |
| European Unionaggregate | 103.4 | — |
| Belgium | 93.2p | −10.2 |
| Estonia | 92.9 | −10.5 |
| Finland | 91.9 | −11.5 |
Flags carried by the source on these values: p provisional
This table as data: CSV · JSON
Every Member State for this indicator+
Members see every Member State for this indicator here, not only the rows the ranking prints. Become a Member
What these figures cannot tell you
- An index, not a level
- All countries start at 100 in 2021, so this measures change and not how much retail activity a country has. A Member State can grow fastest here and still have the smallest retail sector per head.
- The 2021 base is not a neutral year
- 2021 was affected by pandemic restrictions, which were lifted at different times in different Member States. A country whose 2021 retail activity was unusually suppressed will show stronger growth from that base for reasons unrelated to later conditions.
- Retail is not all consumption
- NACE division 47 covers retail trade excluding motor vehicles. Spending on services, which is where much of consumption has shifted, is not included, so a falling retail volume does not necessarily mean households are consuming less overall.
- Small economies move for external reasons
- In Luxembourg, Cyprus and Malta, cross-border shopping and visitor spending are large relative to the domestic retail market, so their figures are less informative about resident households than the larger Member States are.
Frequently asked questions
- Are Europeans buying more than before?
- On average slightly. EU retail sales volumes in 2025 were 3.4% above their 2021 level. That aggregate conceals a wide split: eight Member States were below their 2021 level and several others more than 15% above it.
- Which EU countries are buying less than in 2021?
- Eight: Finland at 91.9 on a 2021 base of 100, Estonia at 92.9, Belgium at 93.2, Sweden at 96.5, Austria at 97.1, Denmark at 97.2, Italy at 97.6 and Czechia at 99.3.
- Which EU country has the fastest retail growth?
- Luxembourg at 137.3, though cross-border shopping makes that figure unrepresentative of resident households. Among larger economies Bulgaria leads at 120.9, followed by Croatia at 116.6, Romania at 115.8 and Portugal at 115.2.
- Does this account for inflation?
- Yes. It is a volume index, adjusted for price changes, so it measures how much was bought rather than how much was spent. The same table measures retail turnover in cash terms, and on that reading the EU index for 2025 is 121.7 rather than 103.4: takings rose 21.7% while the quantity sold rose 3.4%, and the difference is price.
Methodological note
Eurostat publishes the volume of sales in retail trade as a calendar-adjusted index. This study uses NACE division 47, retail trade except of motor vehicles and motorcycles, on the 2021 = 100 base as published.
Because the index is a volume measure, it is adjusted for price changes and tracks quantity sold rather than turnover.
The same table also publishes retail turnover in cash terms on the same base. That series is extracted separately and is used at one point only, to say how much of the increase in takings is price rather than quantity; every other figure in this study is the volume index.
Values are for 2025 and cover all 27 Member States. The count of Member States below 100, the statement that the spread does not follow a geographical line, and the comparison between the volume and turnover indices are derived by Silver Data Lab from the published index values.
Source data
This study draws on 2 datasets from Eurostat. Each can be inspected and re-downloaded from its catalogue, and the filters below are the ones applied.
Turnover and volume of sales in wholesale and retail trade
sts_trtu_a
- Filters applied:
- freq=A · indic_bt=VOL_SLS · nace_r2=G47 · s_adj=CA · unit=I21 · time=2025
- Extracted:
- 2026-10-25
- Source last updated:
- 2026-10-24
Turnover and volume of sales in wholesale and retail trade
sts_trtu_a
- Filters applied:
- freq=A · indic_bt=NETTUR · nace_r2=G47 · s_adj=CA · unit=I21 · time=2025
- Extracted:
- 2026-10-25
- Source last updated:
- 2026-10-24
Download the data
The data the study you have just read is built on, exactly as it was downloaded and archived.
Yours as a Member.
Data downloadable by Members
How to cite
Record the vintage as well as the study: the figures on this page are the ones extracted on the dates below.
Silver Data Lab Research Desk (2026). Shoppers in Eight EU Countries Buy Less Than They Did Four Years Ago. Silver Data Lab, published 11 August 2026, last updated 11 October 2026. https://www.silverdatalab.com/studies/retail-sales-in-the-eu
- Data: Eurostat, Turnover and volume of sales in wholesale and retail trade (sts_trtu_a), filters freq=A, indic_bt=VOL_SLS, nace_r2=G47, s_adj=CA, unit=I21, time=2025; extracted 2026-10-25; source last updated 2026-10-24. https://doi.org/10.2908/sts_trtu_a
- Data: Eurostat, Turnover and volume of sales in wholesale and retail trade (sts_trtu_a), filters freq=A, indic_bt=NETTUR, nace_r2=G47, s_adj=CA, unit=I21, time=2025; extracted 2026-10-25; source last updated 2026-10-24. https://doi.org/10.2908/sts_trtu_a
Silver Data Lab's analysis is licensed CC BY 4.0. The statistics remain their publisher's and keep its terms of reuse.
Ask the research desk
A question about this study — a definition, a filter, a break in the series, what the figures can and cannot support — answered by the desk that made the extraction.
Members can write to the research desk
Studies where the same country leads or trails
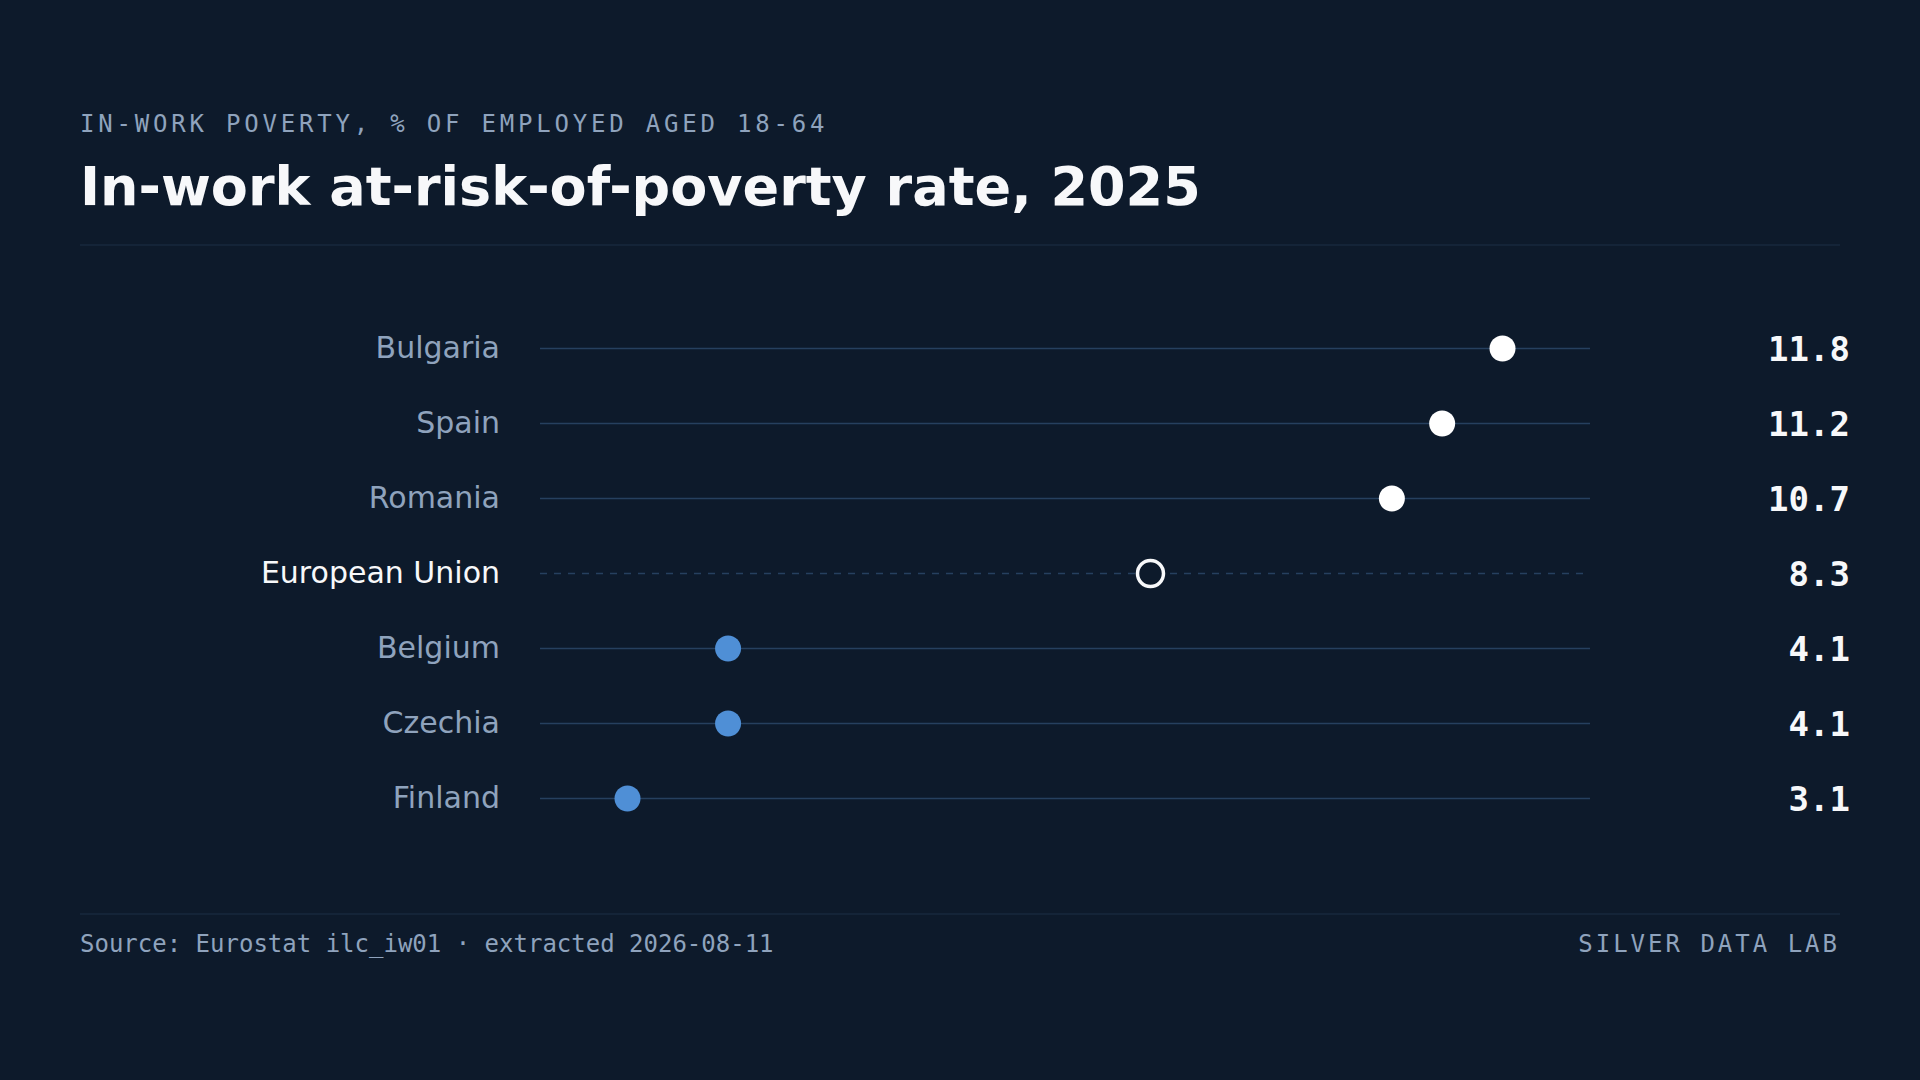
11.8% of Bulgarians With a Job Are Poor, the Highest Share in the EU
8.3% of employed people aged 18 to 64 in the EU lived below the at-risk-of-poverty line in 2025.
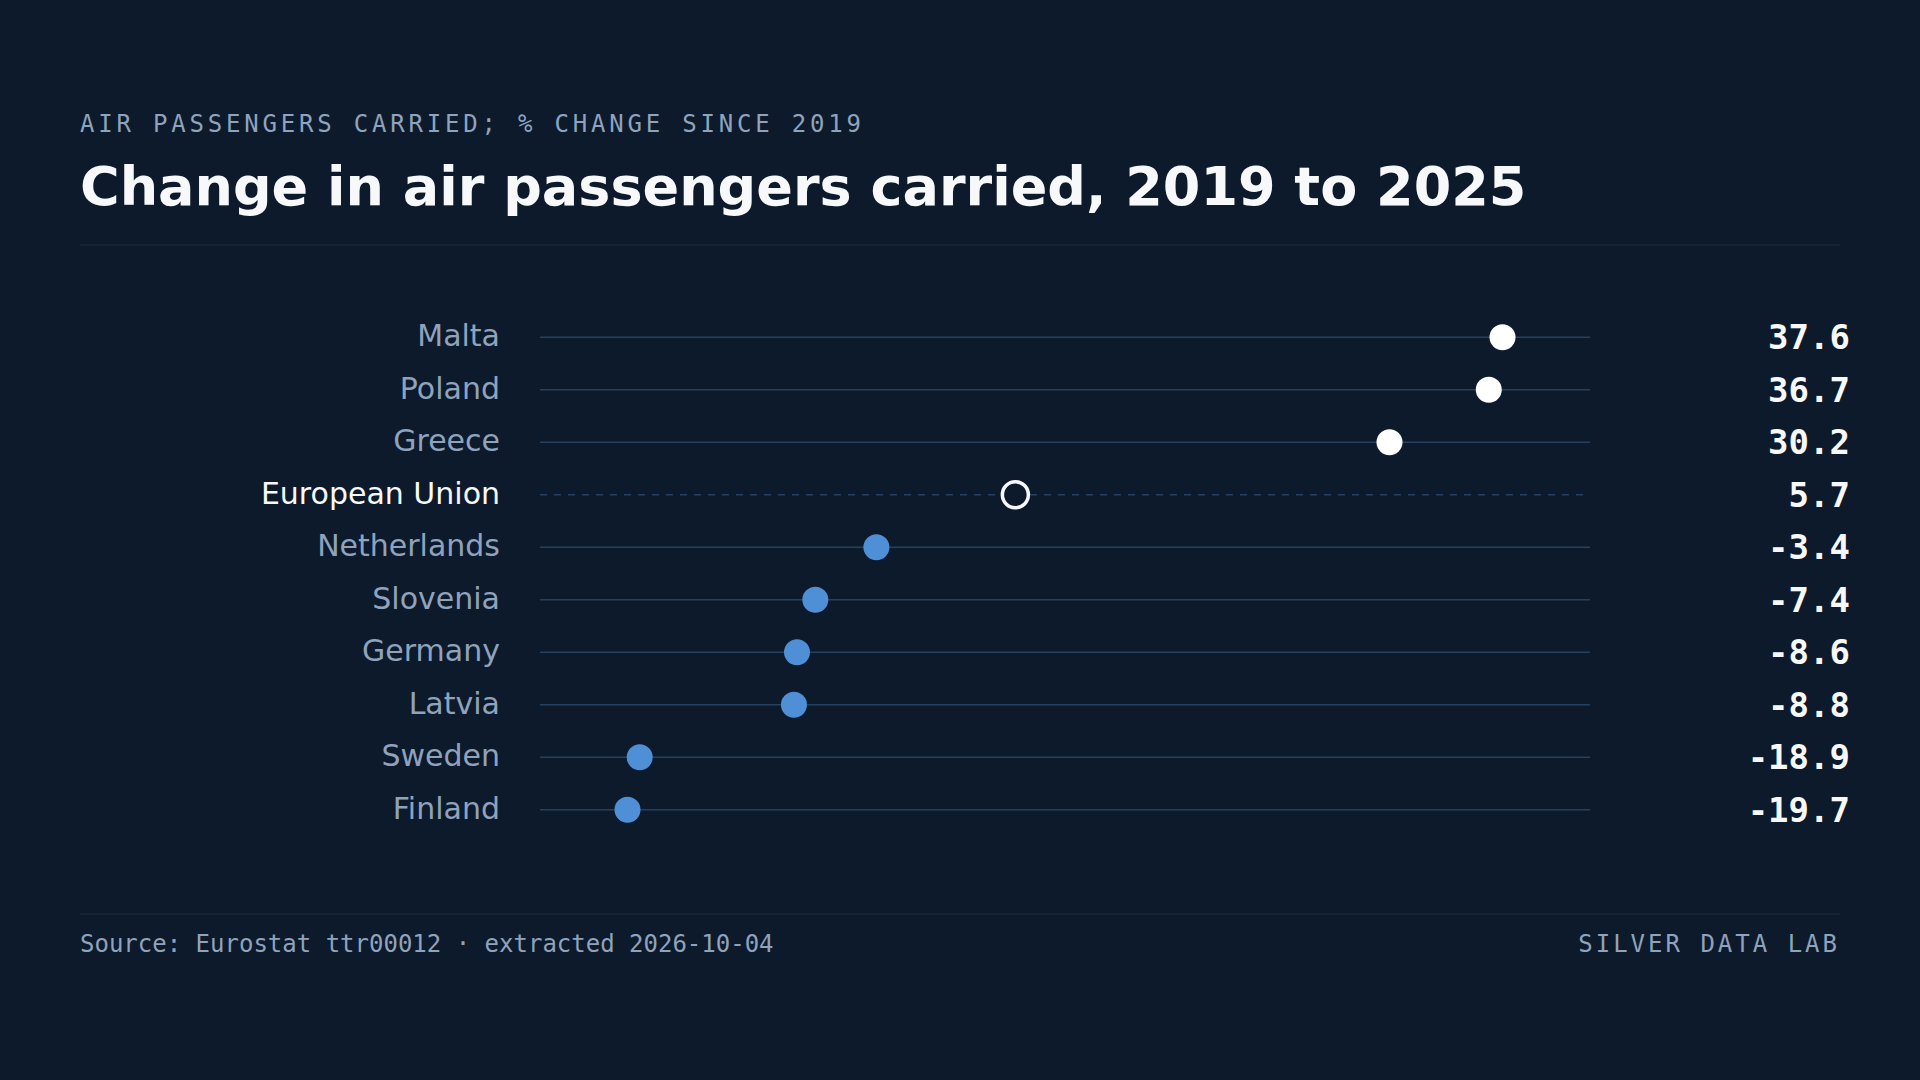
Air Travel in the EU Is Back Above Its Pre-Pandemic Level
Air passengers carried in the EU reached 1,093.6 million in 2025, 5.7% more than in 2019; the total first passed its 2019 level in 2024, by 0.7%.
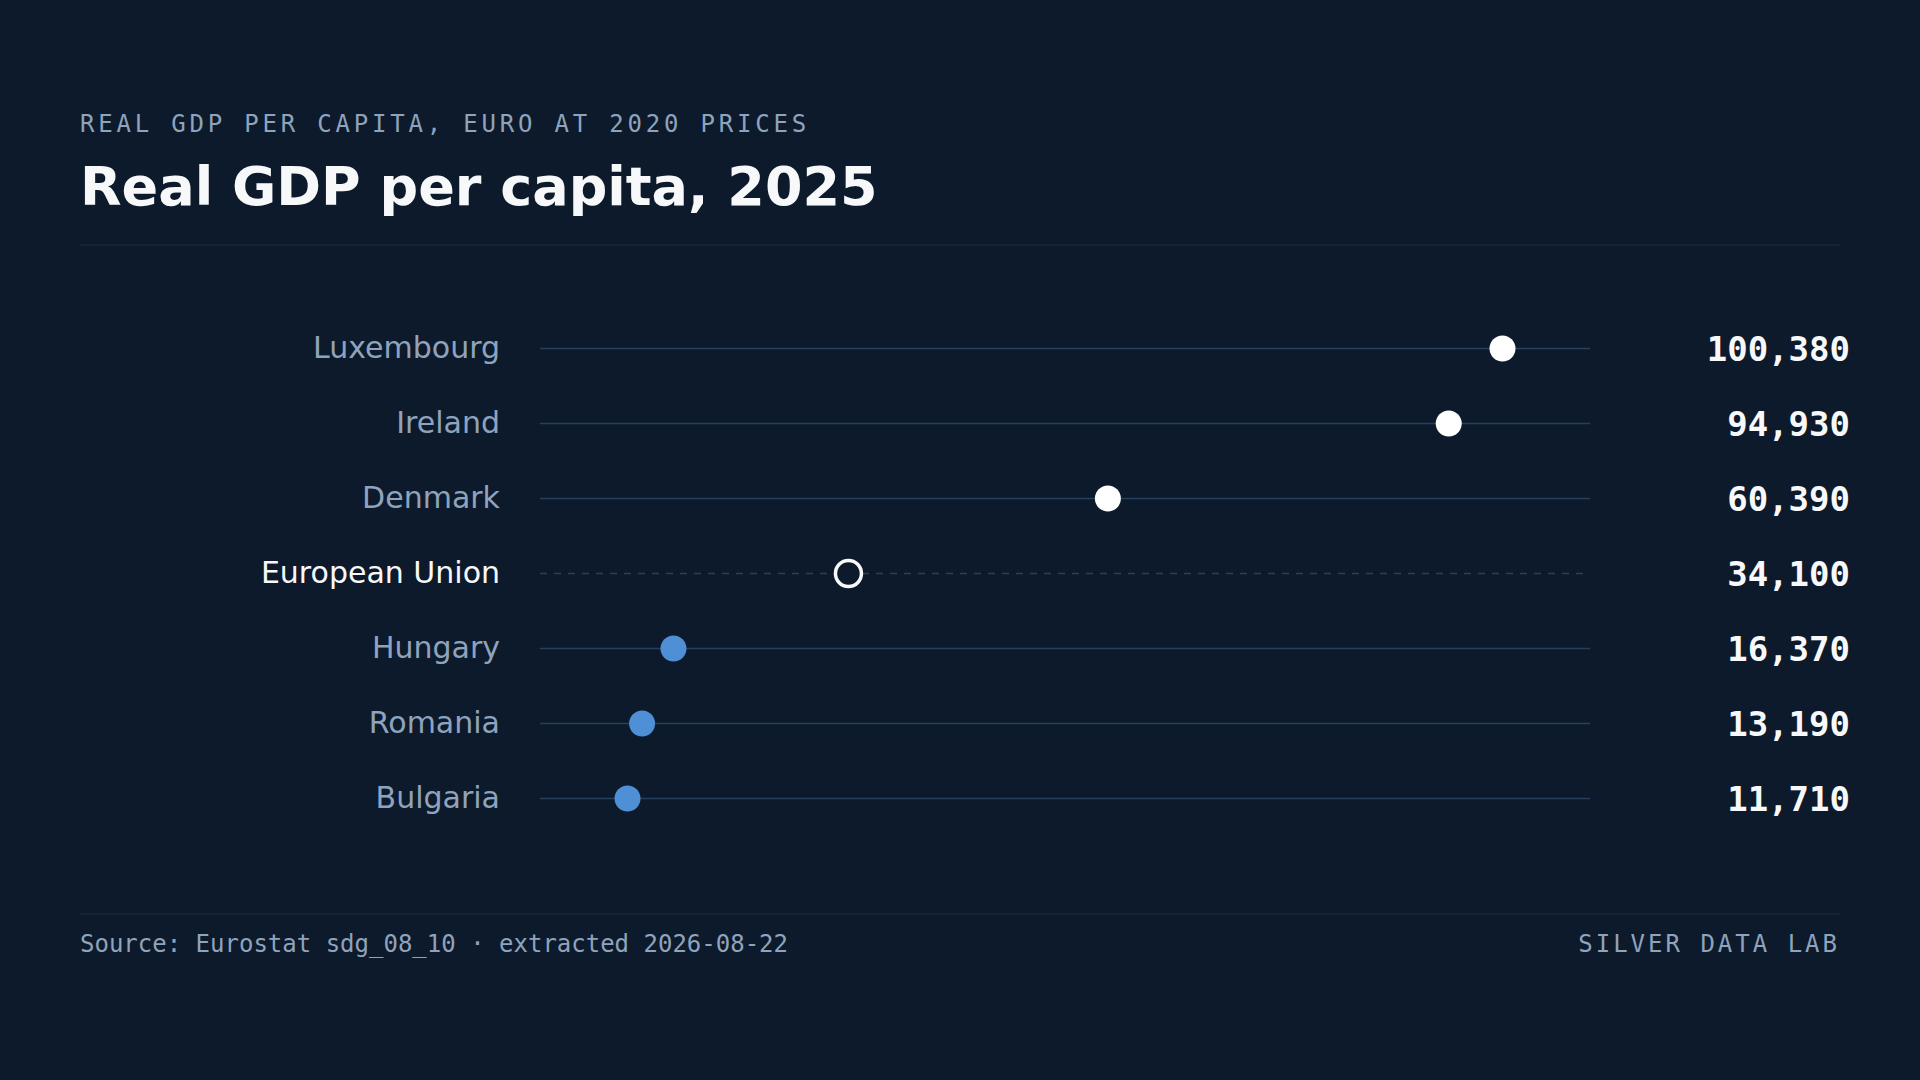
Bulgaria's GDP per Person Is About a Third of the EU Average
EU real GDP per capita was 34,250 euro in 2025, at 2020 prices.