The Thirteen OECD Countries That Tax Labour Most Are All in the EU
Silver Data Lab Research Desk · Statistical analysis · Published on 27 August 2026
- Data source
- OECD
- Reference period
- 2025
- Last updated
- 15 October 2026
Re-checked against the source on 27 August 2026. No value in its datasets has moved between the snapshots we hold. Every revision we have observed →
Key estimates
- The tax wedge — the share of total labour costs taken by income tax, social contributions and employer payroll taxes — was 41.7% for a single average-wage worker across the 22 EU members of the OECD in 2025, against an OECD average of 35.1%.
- The thirteen highest tax wedges in the OECD all belong to EU Member States. The first non-EU country, Türkiye at 40.3%, appears in fourteenth place.
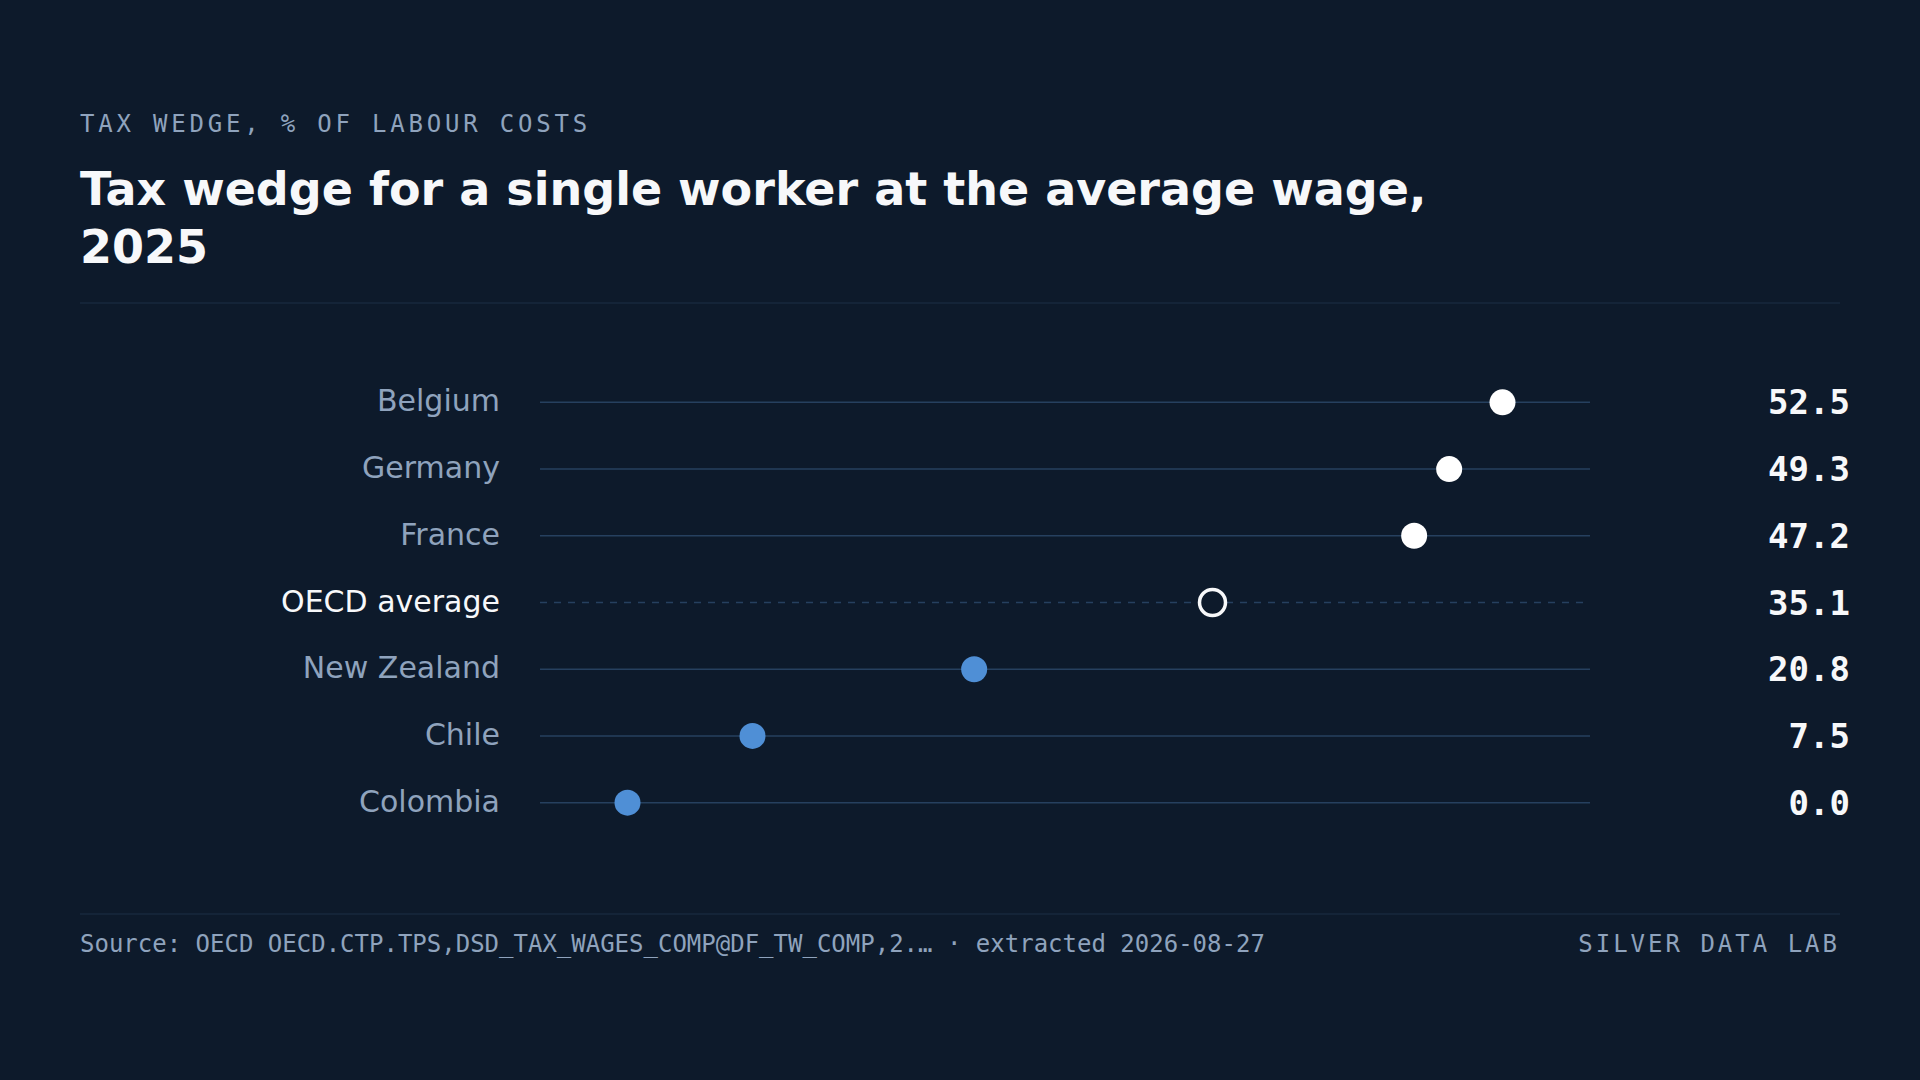
- Belgium records 52.5%, the highest in the OECD: more than half of what a Belgian job costs its employer never reaches the worker.
- 20 of the 22 EU members are above the OECD average. Poland at 35.0% and Ireland at 32.6% are the two below it.
- New Zealand records 20.8%, Chile 7.5% and Colombia 0.0% — a bottom of the table made entirely of non-EU countries, where two of the values say as much about definitions as about taxes.
What stands between a labour cost and a take-home wage
The tax wedge measures the distance between what a job costs an employer and what the worker takes home: income tax, the employee's social contributions, and the employer's social contributions and payroll taxes, expressed as a share of the total labour cost. The OECD computes it every year for a single worker without children earning exactly the average wage, which makes it one of the few tax indicators defined identically across the industrialised world.
In 2025 that wedge was 41.7% across the 22 EU Member States that belong to the OECD, against an OECD average of 35.1%.
Thirteen European positions before anyone else
The average understates how one-sided the ranking is. The thirteen highest tax wedges in the OECD all belong to EU Member States: Belgium, Germany, France, Austria, Italy, Slovenia, the Slovak Republic, Estonia, Finland, Spain, Czechia, Hungary and Sweden, in that order. The first country from outside the Union, Türkiye at 40.3%, appears in fourteenth place.
This is not a claim about Europe as a whole — five Member States are not in the OECD and are absent here — but within the club that measures itself this way, the pattern has no exceptions at the top.
Belgium
Belgium records 52.5%, the highest in the OECD. Of every euro a Belgian employer spends on an average single worker, more than half goes in taxes and contributions on that job before anything reaches the worker.
It is also a figure in slow decline: in 2000 the Belgian wedge stood at 57.1%. A fall of 4.6 points over a quarter of a century has still left it at the top of the table.
The two exceptions, and Denmark
Poland at 35.0% and Ireland at 32.6% are the only EU members below the OECD average — 20 of the 22 sit above it.
Denmark at 35.8% barely clears it, and Denmark is the reminder of what this indicator does and does not measure. Danish taxation overall is among the highest in the world, but Denmark funds its state almost entirely through general income taxation rather than social contributions levied on jobs, and part of that burden falls outside a measure built around the cost of labour. A high-tax country and a high-wedge country are not the same thing: the wedge measures how labour specifically is taxed.
The bottom of the table is a lesson in definitions
New Zealand records 20.8%, Chile 7.5% and Colombia 0.0%. No EU country is anywhere near them, but two of these values need their definition attached before they mean anything.
New Zealand levies no separate social security contributions at all: pensions and health are funded from general revenue, so its wedge is essentially pure income tax. In Chile and Colombia, compulsory pension and health contributions go to private funds, and the OECD's definition counts only payments to general government as taxes — so those contributions, mandatory as they are, do not appear in the wedge. Colombia's zero also reflects that a worker at the average wage owes no income tax there. All three figures are correct as published, and none of them means that labour in those countries costs nothing beyond the wage.
A gap that is old and closing slowly
The EU's position is not new. In 2000 the wedge averaged 44.3% across the 22 EU members and 36.1% across the OECD: both have fallen since, the EU average by more. The gap has narrowed from 8.1 points to 6.6 — a quarter of a century of tax reform has changed the numbers and left the ordering intact.
The endpoints hide a recent reversal. The EU average reached its lowest point since 2000 in 2021, at 41.3%, and has not fallen in any year since; the OECD average has risen with it, from 34.5% in 2021 to the 35.1% it reads now, and by more, which is why the gap above is narrower than it was four years ago. In 2025 the wedge rose in 24 of the 38 OECD countries, fell in 11 and was unchanged in 3, and it rose in 14 of the 22 EU members. The long decline and the turn of the last four years are both in the same series.
Tax wedge for a single worker at the average wage, 2025
| Country | % of labour costs | Gap to OECD averagepercentage points, derived |
|---|---|---|
| Belgium | 52.5 | +17.4 |
| Germany | 49.3 | +14.2 |
| France | 47.2 | +12.1 |
| OECD averageaggregate | 35.1 | — |
| New Zealand | 20.8 | −14.3 |
| Chile | 7.5 | −27.6 |
| Colombia | 0.0 | −35.1 |
This table as data: CSV · JSON
Every Member State for this indicator+
Members see every Member State for this indicator here, not only the rows the ranking prints. Become a Member
Embed this chart
Paste this code into a page. The frame carries the source and the extraction date, and links back to the study.
What these figures cannot tell you
- One household type, one earnings level
- The figure describes a single worker without children earning exactly 100% of the average wage. Families with children face different wedges once cash benefits are counted, and the ranking can reorder at other earnings levels. This household type is the OECD's headline case, not the only one it publishes.
- Not the overall tax burden
- The wedge covers taxes and contributions attached to labour. Consumption taxes, capital taxation and property taxes are outside it, so a country can tax heavily overall while showing a modest wedge — Denmark and New Zealand both illustrate the gap between the two ideas.
- Only payments to general government count
- Under the Taxing Wages definition, compulsory contributions paid to private funds are not taxes. Chile's 7.5% and Colombia's 0.0% are correct on that definition and would look very different under one that counted all mandatory payments.
- Five EU Member States are outside the OECD
- Bulgaria, Croatia, Cyprus, Malta and Romania are not OECD members, so they are absent from this ranking and from the EU average used here, which the OECD publishes for its 22 EU members.
Frequently asked questions
- What is the tax wedge?
- The share of total labour costs taken by income tax, social security contributions and employer payroll taxes — the distance between what a job costs the employer and what the worker takes home. For a single worker at the average wage it was 41.7% across the EU members of the OECD in 2025, against an OECD average of 35.1%.
- Which country taxes labour most?
- Belgium, where the tax wedge reaches 52.5% of labour costs — the highest in the OECD. The thirteen highest wedges in the OECD all belong to EU Member States; the first non-EU country is Türkiye, in fourteenth place at 40.3%.
- Why is Colombia's tax wedge zero?
- Because a worker at the average wage owes no income tax in Colombia, and the compulsory pension and health contributions go to private funds, which the OECD's definition counts as non-tax payments. The 0.0% is correct as published and does not mean Colombian labour carries no mandatory costs.
- Has the EU always taxed labour more than the rest of the OECD?
- For as long as this series runs. In 2000 the average wedge was 44.3% across the 22 EU members of the OECD and 36.1% across the OECD as a whole. Both have fallen since, the EU average by more, narrowing the gap from 8.1 points to 6.6 — without changing the ordering.
Methodological note
The tax wedge is the OECD's Taxing Wages comparative indicator: income tax plus employee and employer social security contributions and employer payroll taxes, net of cash benefits, as a percentage of total labour costs, computed for a single person without children earning 100% of the average wage.
Values are for 2025, the most recent year published, extracted from the OECD SDMX API on 2026-08-27 and archived. The EU and OECD averages are the source's own published aggregates — the EU figure covering the 22 Member States that belong to the OECD — not averages computed here.
The count of EU members above the OECD average, the rank of the first non-EU country, the series minimum of 2021, the year-on-year counts for 2025, and the changes since 2000 are derived by Silver Data Lab from the published series and are labelled as derived. The two averages are subtracted before rounding, which is why the 2000 gap reads 8.1 points rather than the 8.2 a reader would get from the rounded 44.3% and 36.1% quoted above. The OECD's API exposes no last-update date, so the source is dated to the extraction against which every figure was verified.
Source data
The underlying series can be inspected and re-downloaded from the OECD Data Explorer. The filters below are the ones applied.
Labour taxation – OECD comparative country indicators (Taxing Wages)
OECD.CTP.TPS,DSD_TAX_WAGES_COMP@DF_TW_COMP,2.1/.AV_TW..S_C0.AW100._Z.A
- Filters applied:
- measure=AV_TW · household_type=S_C0 · income_principal=AW100 · income_spouse=_Z · freq=A · startPeriod=2000
- Extracted:
- 2026-08-27
- Source last updated:
- 2026-08-27
Download the data
The data the study you have just read is built on, exactly as it was downloaded and archived.
Yours as a Member.
Data downloadable by Members
How to cite
Record the vintage as well as the study: the figures on this page are the ones extracted on the dates below.
Silver Data Lab Research Desk (2026). The Thirteen OECD Countries That Tax Labour Most Are All in the EU. Silver Data Lab, published 27 August 2026, last updated 15 October 2026. https://www.silverdatalab.com/studies/tax-wedge-in-the-eu
- Data: OECD, Labour taxation – OECD comparative country indicators (Taxing Wages) (OECD.CTP.TPS,DSD_TAX_WAGES_COMP@DF_TW_COMP,2.1/.AV_TW..S_C0.AW100._Z.A), filters measure=AV_TW, household_type=S_C0, income_principal=AW100, income_spouse=_Z, freq=A, startPeriod=2000; extracted 2026-08-27; source last updated 2026-08-27. https://data-explorer.oecd.org/vis?df[ds]=dsDisseminateFinalDMZ&df[id]=DSD_TAX_WAGES_COMP%40DF_TW_COMP&df[ag]=OECD.CTP.TPS&df[vs]=2.1
Silver Data Lab's analysis is licensed CC BY 4.0. The statistics remain their publisher's and keep its terms of reuse.
Ask the research desk
A question about this study — a definition, a filter, a break in the series, what the figures can and cannot support — answered by the desk that made the extraction.
Members can write to the research desk