Latvian Businesses Pay the Euro Area's Highest Rates on New Loans
Silver Data Lab Research Desk · Statistical analysis · Published on 04 August 2026
This study is open to members only
Its sources, filters and extraction date are declared above, as they are for every study. Sign in to read the analysis in full.
- Data source
- European Central Bank
- Reference period
- August 2026
- Last updated
- 11 October 2026
Re-checked against the source on 02 October 2026. No value in its datasets has moved between the snapshots we hold. Every revision we have observed →
Key estimates
- A business borrowing in Latvia pays 5.79% on a new loan; one borrowing in Luxembourg pays 2.95%.
- That is a gap of 284 basis points between two countries using the same currency, under the same policy rate.
- The euro area average is 3.63%. Fifteen of the nineteen countries with data sit above it and four below.
- Lithuania at 5.01% and Estonia at 4.62% are the next most expensive after Latvia.
- The four largest economies — Italy 3.71%, France 3.67%, Germany 3.59% and Spain 3.57% — all sit within 8 basis points of the average.
- Which countries file a figure changes from month to month, and the spread moves with it: on the seventeen countries that reported in both July and August, it narrowed from 224 to 206 basis points while the headline widened.
The same money at different prices
The ECB sets one policy rate for the whole euro area. What a firm actually pays to borrow is set by its bank, and banks price differently depending on where they are.
In August 2026 a non-financial company taking out a new loan paid 5.79% in Latvia and 2.95% in Luxembourg. Both firms borrow euros. Both sit inside a single monetary union, facing in that month the same ECB deposit rate of 2.25% — the level in force from June 2026 until the increase of 16 September. The difference between them is 284 basis points, and it is not explained by the currency, the policy rate, or the exchange rate, because all three are identical.
Where the expensive money is
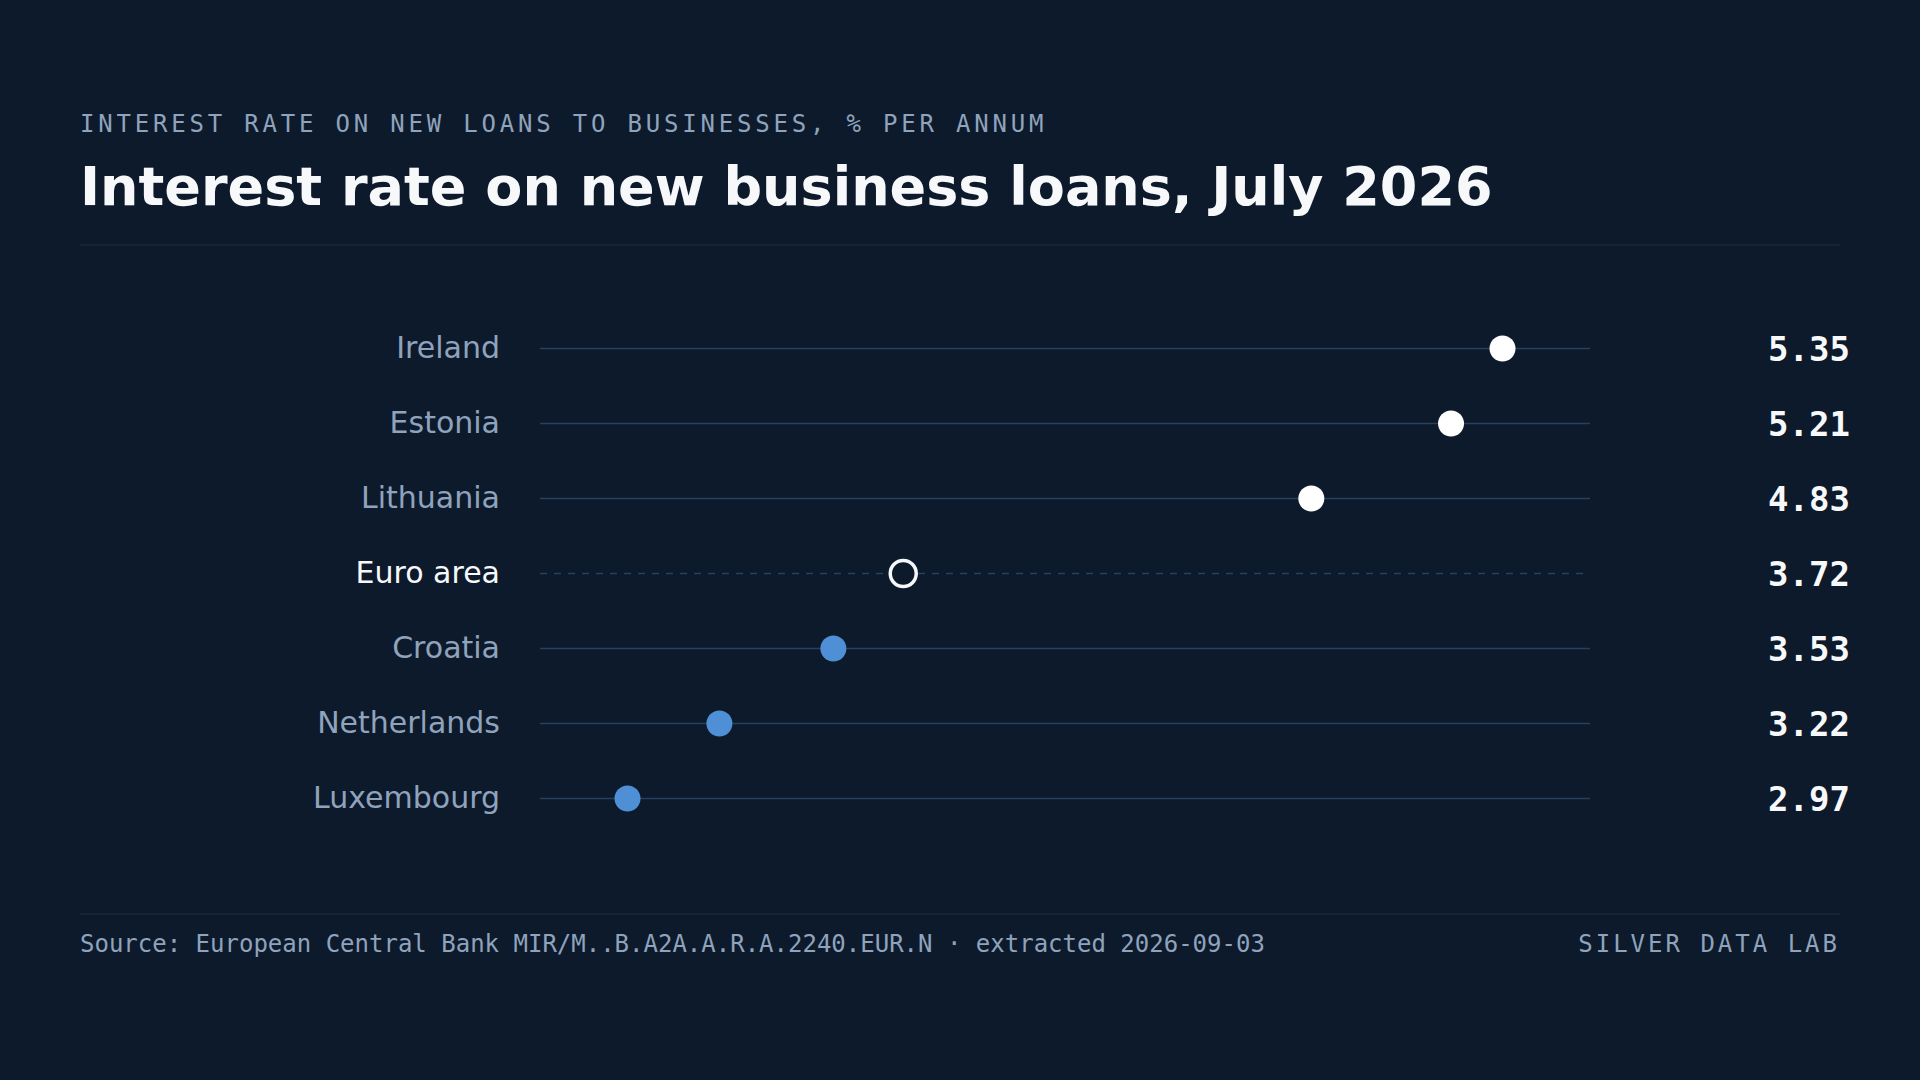
Latvia is the most expensive, followed by Lithuania at 5.01% and Estonia at 4.62%. The three Baltic states take the top three places, and Malta and Slovakia follow at 4.60% each.
What the dearest markets have in common is size. They are small banking markets, and a small market supports fewer lenders. Where a borrower has three banks to approach rather than thirty, the price of credit reflects that.
The cheapest money is in Luxembourg at 2.95%, the Netherlands at 3.00% and Spain at 3.57%. Luxembourg is a small market too, which is enough to show that size alone does not order this ranking.
The large economies cluster
Italy records 3.71%, France 3.67%, Germany 3.59% and Spain 3.57%.
All four sit within 8 basis points of the 3.63% average, in a distribution 284 basis points wide. This is arithmetic rather than coincidence: the euro area average is weighted by lending volume, and these four countries account for most of the lending. The average describes them because they largely are the average.
It follows that the average is a poor guide to what a firm outside those four economies pays. A Lithuanian company is 138 basis points above the figure usually quoted as the euro area cost of borrowing.
Reading the spread means reading the sample
The distance between the most and least expensive country was 214 basis points in June 2022, before the tightening cycle began, 289 at the September 2023 peak in ECB rates and 259 in June 2024. In August 2026 it is 284.
Those figures do not form a clean series, because the countries behind them are not the same countries. Not every euro-area member files a rate every month: nineteen do here, and Finland and Greece do not. Luxembourg is the case that usually decides the lower end, because it has been the cheapest country in the euro area in twenty-three of the twenty-four months it has reported over the last three years. Across those same months the spread has a median of 250 basis points where Luxembourg appears and 193 where it does not.
This month the upper end decides it instead. Latvia and Malta filed in August after reporting nothing in July, and Latvia came in at 5.79%, higher than any rate in the series this year. That single arrival widens the headline spread from 224 basis points in July to 284. Restricted to the seventeen countries that filed in both months, the spread went the other way: 224 down to 206.
Both numbers are correct and they point in opposite directions, which is the whole caution. What the series supports is the level rather than the direction. A firm in Latvia paid 284 basis points more in August than one in Luxembourg, and both borrow the same currency at the same policy rate.
What this study does not establish
It records what firms pay, not why. Bank concentration, credit risk, collateral practice, the mix of loan sizes and maturities behind each national average, and the health of local bank balance sheets all plausibly contribute, and this data cannot separate them.
The measurement is what matters here: a single monetary policy does not produce a single price for credit, and in every month of the last four years the distance between the cheapest and dearest euro-area country has been at least 130 basis points.
Interest rate on new business loans, August 2026
| Country | % per annum | Gap to Euro areapercentage points, derived |
|---|---|---|
| Latvia | 5.79 | +2.2 |
| Lithuania | 5.01 | +1.4 |
| Estonia | 4.62 | +1.0 |
| Euro areaaggregate | 3.63 | — |
| Spain | 3.57 | −0.1 |
| Netherlands | 3.00 | −0.6 |
| Luxembourg | 2.95 | −0.7 |
This table as data: CSV · JSON
Every Member State for this indicator+
Members see every Member State for this indicator here, not only the rows the ranking prints. Become a Member
What these figures cannot tell you
- Two euro-area countries are missing
- Finland and Greece report no value for August 2026 in this series, so nineteen of the twenty-one euro-area countries are covered. The extremes and the spread are computed across those nineteen only.
- The reporting countries change from month to month
- Which members file a rate varies by month, and the spread is the distance between two of them. Luxembourg has been the cheapest euro-area country in almost every recent month it has reported, so a month in which it files and one in which it does not are not directly comparable. Spreads quoted here for different months rest on different country sets, and the like-for-like comparison in the text is computed by Silver Data Lab rather than published. August is the clearest case the series has produced: Latvia and Malta both returned to it, and the headline spread and the like-for-like spread moved in opposite directions as a result.
- A national average hides its composition
- Each country figure is an average across new loans of every size and maturity. A country whose lending skews towards small, short, unsecured loans will show a higher rate than one whose lending skews towards large secured facilities, without any bank charging a different price for the same product.
- This is new business, not the outstanding stock
- The series covers loans agreed in the reference month. It says nothing about what firms pay on loans taken out earlier, which for fixed-rate borrowing may differ substantially from current market conditions.
- The average is volume-weighted
- The euro area figure of 3.63% weights each country by lending volume, so it is dominated by the largest economies. It is not the average of the twenty-one national rates, and no country need be at it.
- Prices, not causes
- The data records the rates charged. It does not attribute them to bank concentration, credit risk, collateral or any other factor, and no causal claim is made here.
Frequently asked questions
- Why do businesses pay different interest rates in different euro-area countries?
- Because the ECB sets the policy rate but commercial banks set lending rates. In August 2026 the spread between the most expensive country, Latvia at 5.79%, and the cheapest, Luxembourg at 2.95%, was 284 basis points. This study records the difference; it does not attribute it to any single cause.
- Where is business credit most expensive in the euro area?
- Latvia, at 5.79% on new loans to companies in August 2026, followed by Lithuania at 5.01% and Estonia at 4.62%.
- What is the average business lending rate in the euro area?
- 3.63% in August 2026. That figure is weighted by lending volume, so it is dominated by the largest economies — Germany, France, Italy and Spain all sit within 8 basis points of it — and is a poor guide to what a firm in a smaller member state pays.
- Is the gap between countries getting wider or narrower?
- The series does not answer that cleanly, because the countries reporting change from month to month. The spread was 214 basis points in June 2022, 289 in September 2023 when ECB rates peaked, 259 in June 2024, 224 in July 2026 and 284 in August 2026 — but which countries file changes underneath those numbers. On the seventeen countries reporting in both July and August 2026, the spread moved the opposite way, from 224 down to 206 basis points.
- Which countries are missing from this comparison?
- Finland and Greece, which report no value for August 2026 in this series. Nineteen of the twenty-one euro-area countries are covered.
Methodological note
The ECB publishes MFI interest rate statistics through the ECB Data Portal. This study uses the rate on new business loans to non-financial corporations, all maturities and all loan sizes, as published, for August 2026 — the most recent month available at extraction.
Every euro-area country reporting a value for that month is included; Finland and Greece report none.
The 284 basis point spread, the counts above and below the average, the observation that the four largest economies all sit within 8 basis points of it, and the historical spreads for June 2022, September 2023 and June 2024 are derived by Silver Data Lab from the published series by taking the difference between the highest and lowest national rate in each month. The euro area aggregate is the published figure, not a computed one.
The comparison between months is derived the same way and rests on the same series: how often Luxembourg has been the cheapest reporting country, the median spread in months with and without it, and the spread restricted to the seventeen countries filing in both July and August 2026. None of those figures is published by the source.
The ECB policy rate quoted for context is the deposit facility rate from the companion study on this site, at the level in force in the reference month rather than the current one: the rate has since moved, and a study reporting a past month should not be dated by a later decision.
Source data
The underlying series can be inspected and re-downloaded from the ECB Data Portal. The filters below are the ones applied.
MFI interest rates on new loans to non-financial corporations
MIR/M..B.A2A.A.R.A.2240.EUR.N
- Filters applied:
- freq=M · ref_area=all euro-area countries and U2 aggregate · bs_rep_sector=B · bs_item=A2A (loans other than revolving loans and overdrafts) · maturity=A (total) · data_type_mir=R (annualised agreed rate) · amount_cat=A (total) · bs_count_sector=2240 (non-financial corporations) · currency=EUR · ir_bus_cov=N (new business)
- Extracted:
- 2026-10-02
- Source last updated:
- 2026-08-01
Download the data
The data the study you have just read is built on, exactly as it was downloaded and archived.
Yours as a Member.
Data downloadable by Members
How to cite
Record the vintage as well as the study: the figures on this page are the ones extracted on the dates below.
Silver Data Lab Research Desk (2026). Latvian Businesses Pay the Euro Area's Highest Rates on New Loans. Silver Data Lab, published 04 August 2026, last updated 11 October 2026. https://www.silverdatalab.com/studies/business-lending-rates-in-the-euro-area
- Data: European Central Bank, MFI interest rates on new loans to non-financial corporations (MIR/M..B.A2A.A.R.A.2240.EUR.N), filters freq=M, ref_area=all euro-area countries and U2 aggregate, bs_rep_sector=B, bs_item=A2A (loans other than revolving loans and overdrafts), maturity=A (total), data_type_mir=R (annualised agreed rate), amount_cat=A (total), bs_count_sector=2240 (non-financial corporations), currency=EUR, ir_bus_cov=N (new business); extracted 2026-10-02; source last updated 2026-08-01. https://data.ecb.europa.eu/data/datasets/MIR
Silver Data Lab's analysis is licensed CC BY 4.0. The statistics remain their publisher's and keep its terms of reuse.
Ask the research desk
A question about this study — a definition, a filter, a break in the series, what the figures can and cannot support — answered by the desk that made the extraction.
Members can write to the research desk
Studies where the same country leads or trails
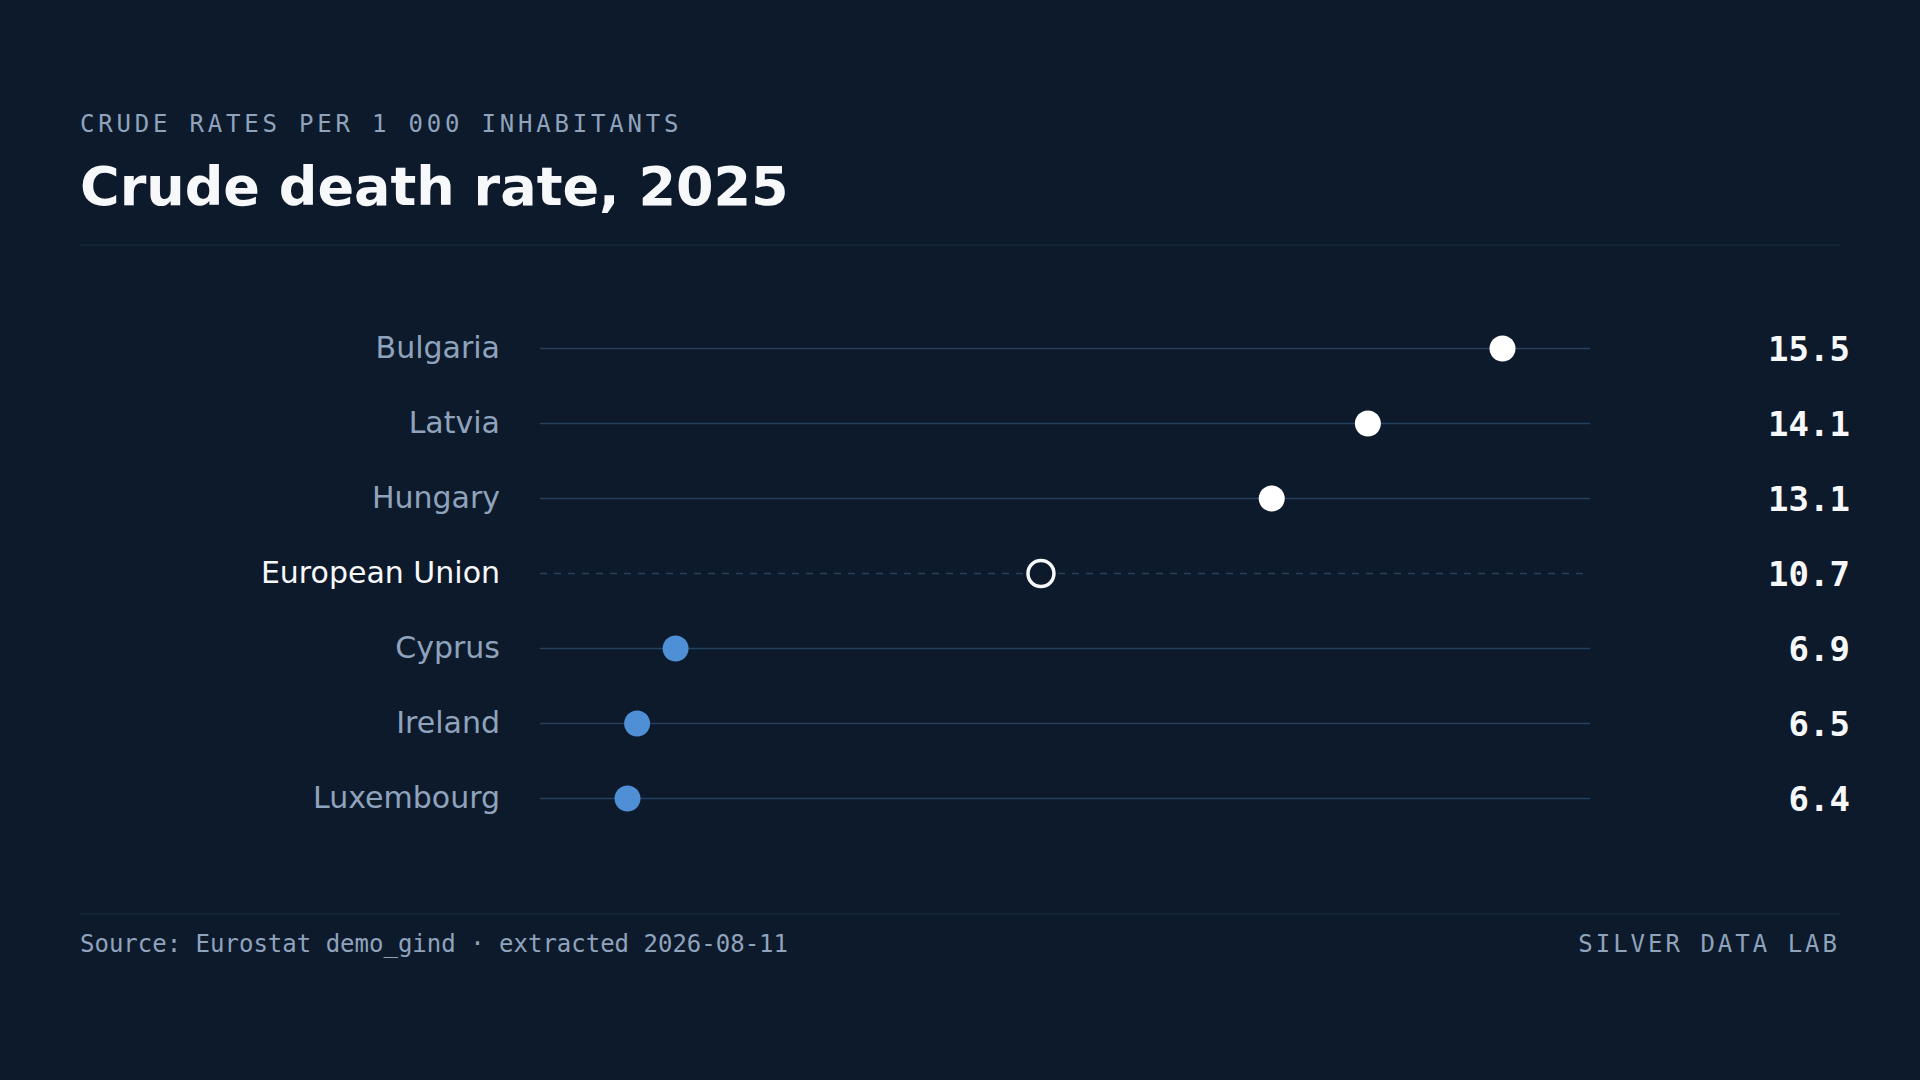
Deaths Outnumber Births in Twenty-One EU Countries
The EU recorded 7.7 births and 10.7 deaths per thousand inhabitants in 2025: a natural change of −3.0.
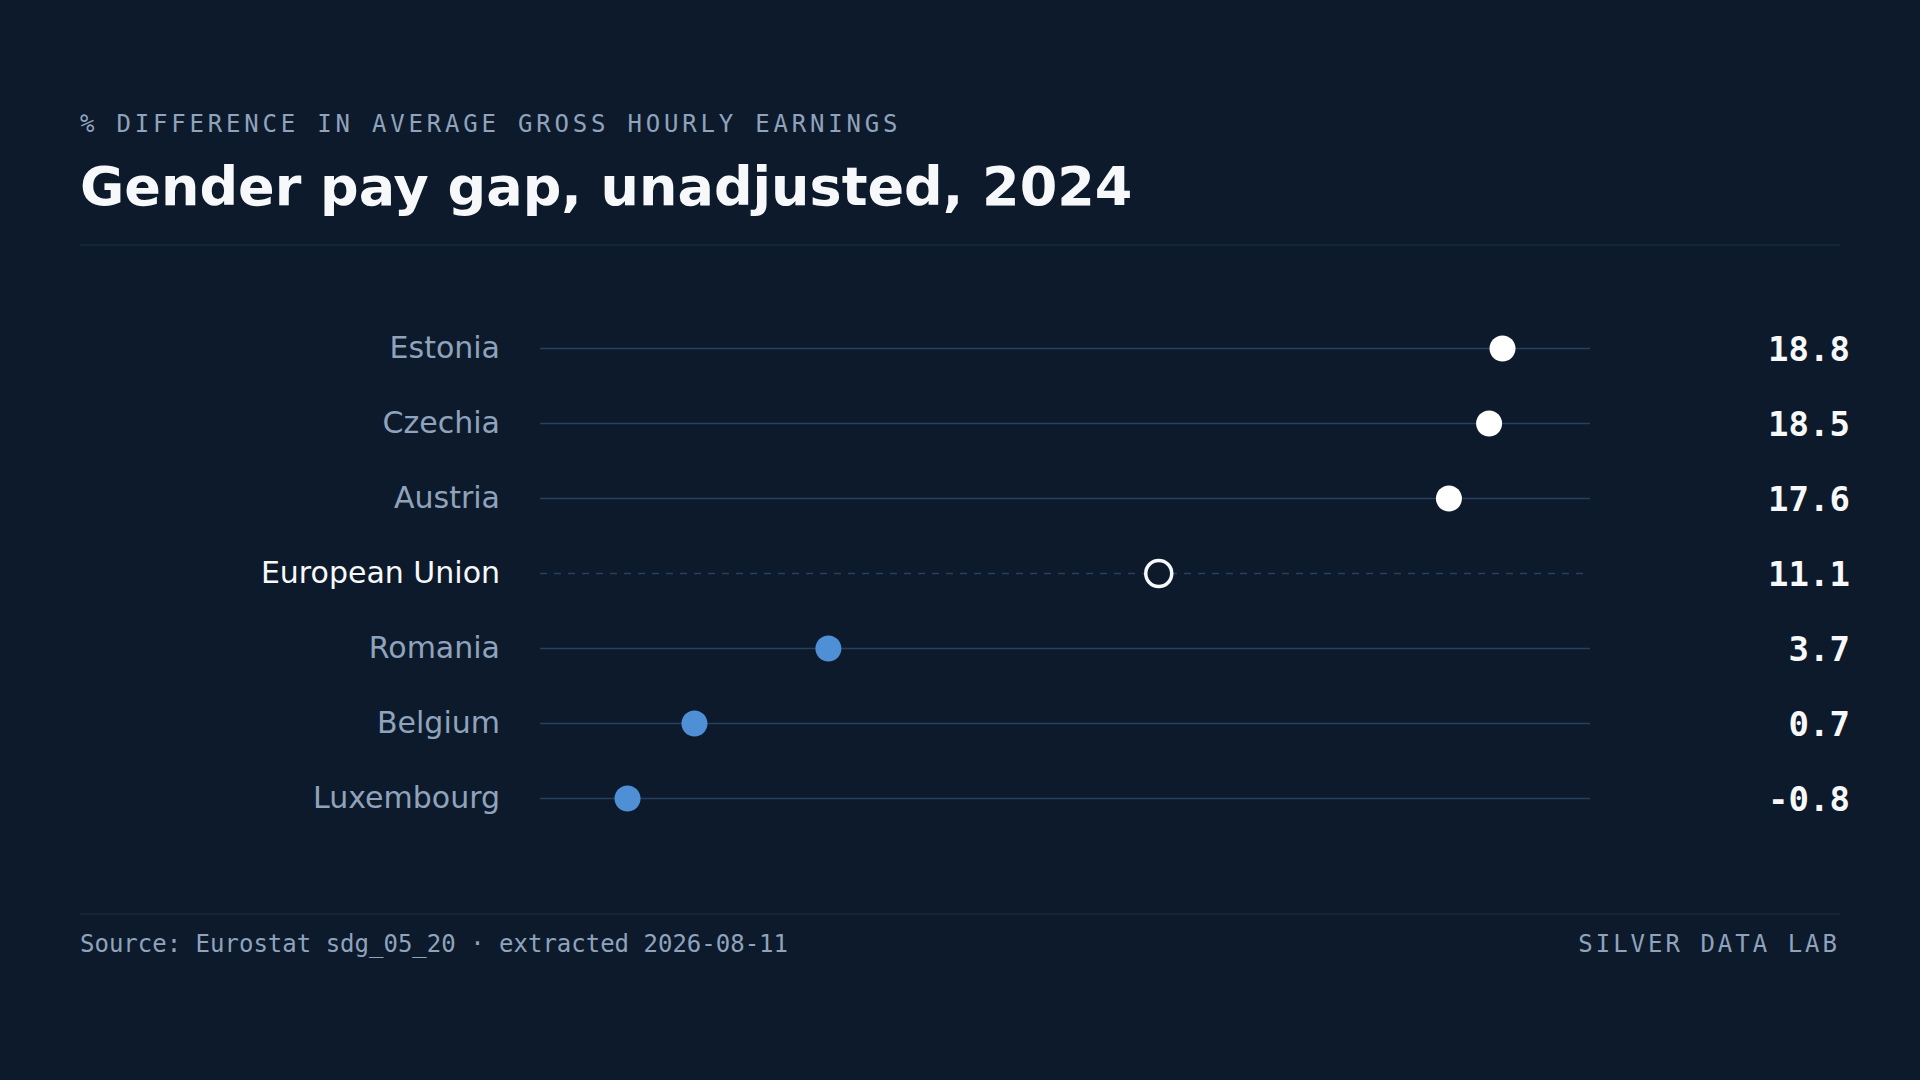
In Luxembourg, Women Are Paid More Than Men
Women in the EU earned 11.1% less per hour than men in 2024, before any adjustment for occupation or hours.
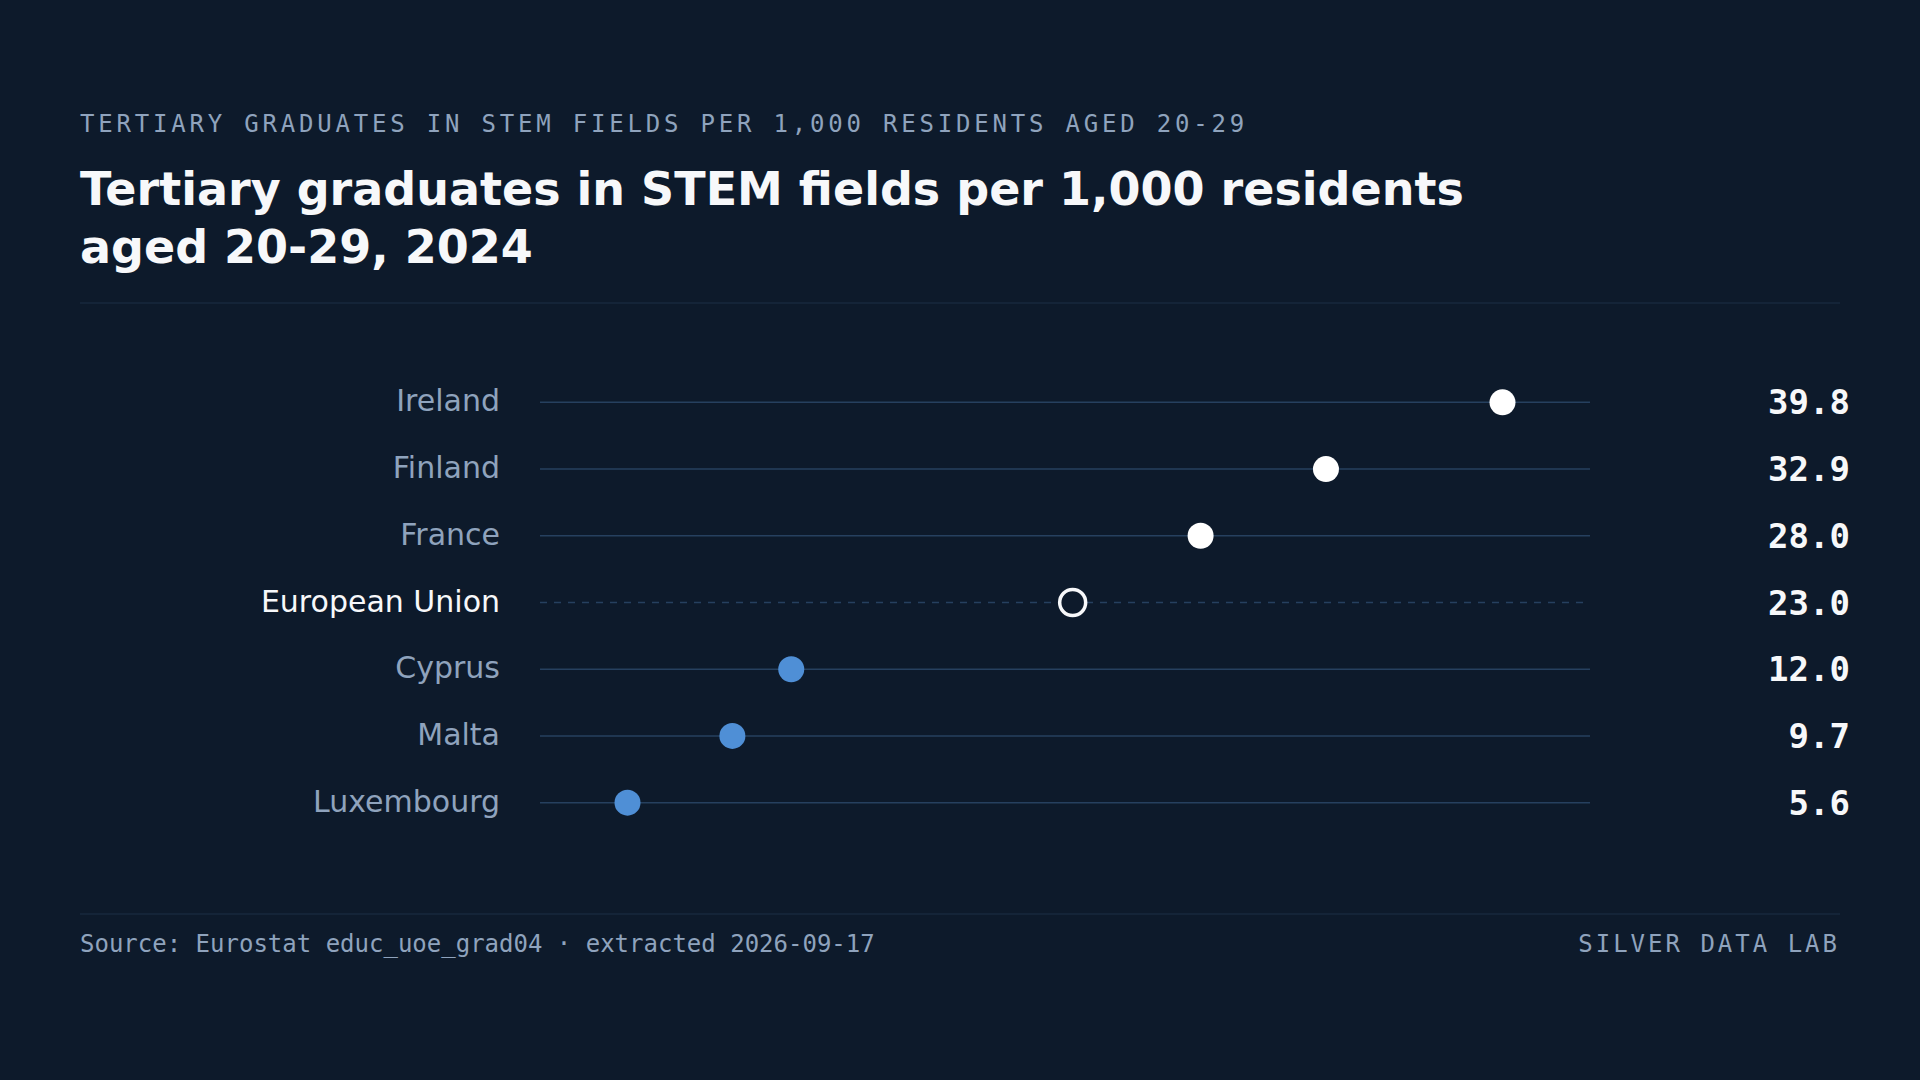
In No EU Country Do Women Graduate in STEM as Often as Men
In 2024 the EU produced 23.0 tertiary graduates in science, mathematics, computing, engineering, manufacturing and construction for every 1,000 residents aged 20 to 29.