Extreme Weather Costs Slovenia Five Times the EU Average per Person
Silver Data Lab Research Desk · Statistical analysis · Published on 30 October 2025
- Data source
- Eurostat
- Reference period
- 2023
- Last updated
- 11 October 2026
Re-checked against the source on 11 August 2026. No value in its datasets has moved between the snapshots we hold. Every revision we have observed →
Key estimates
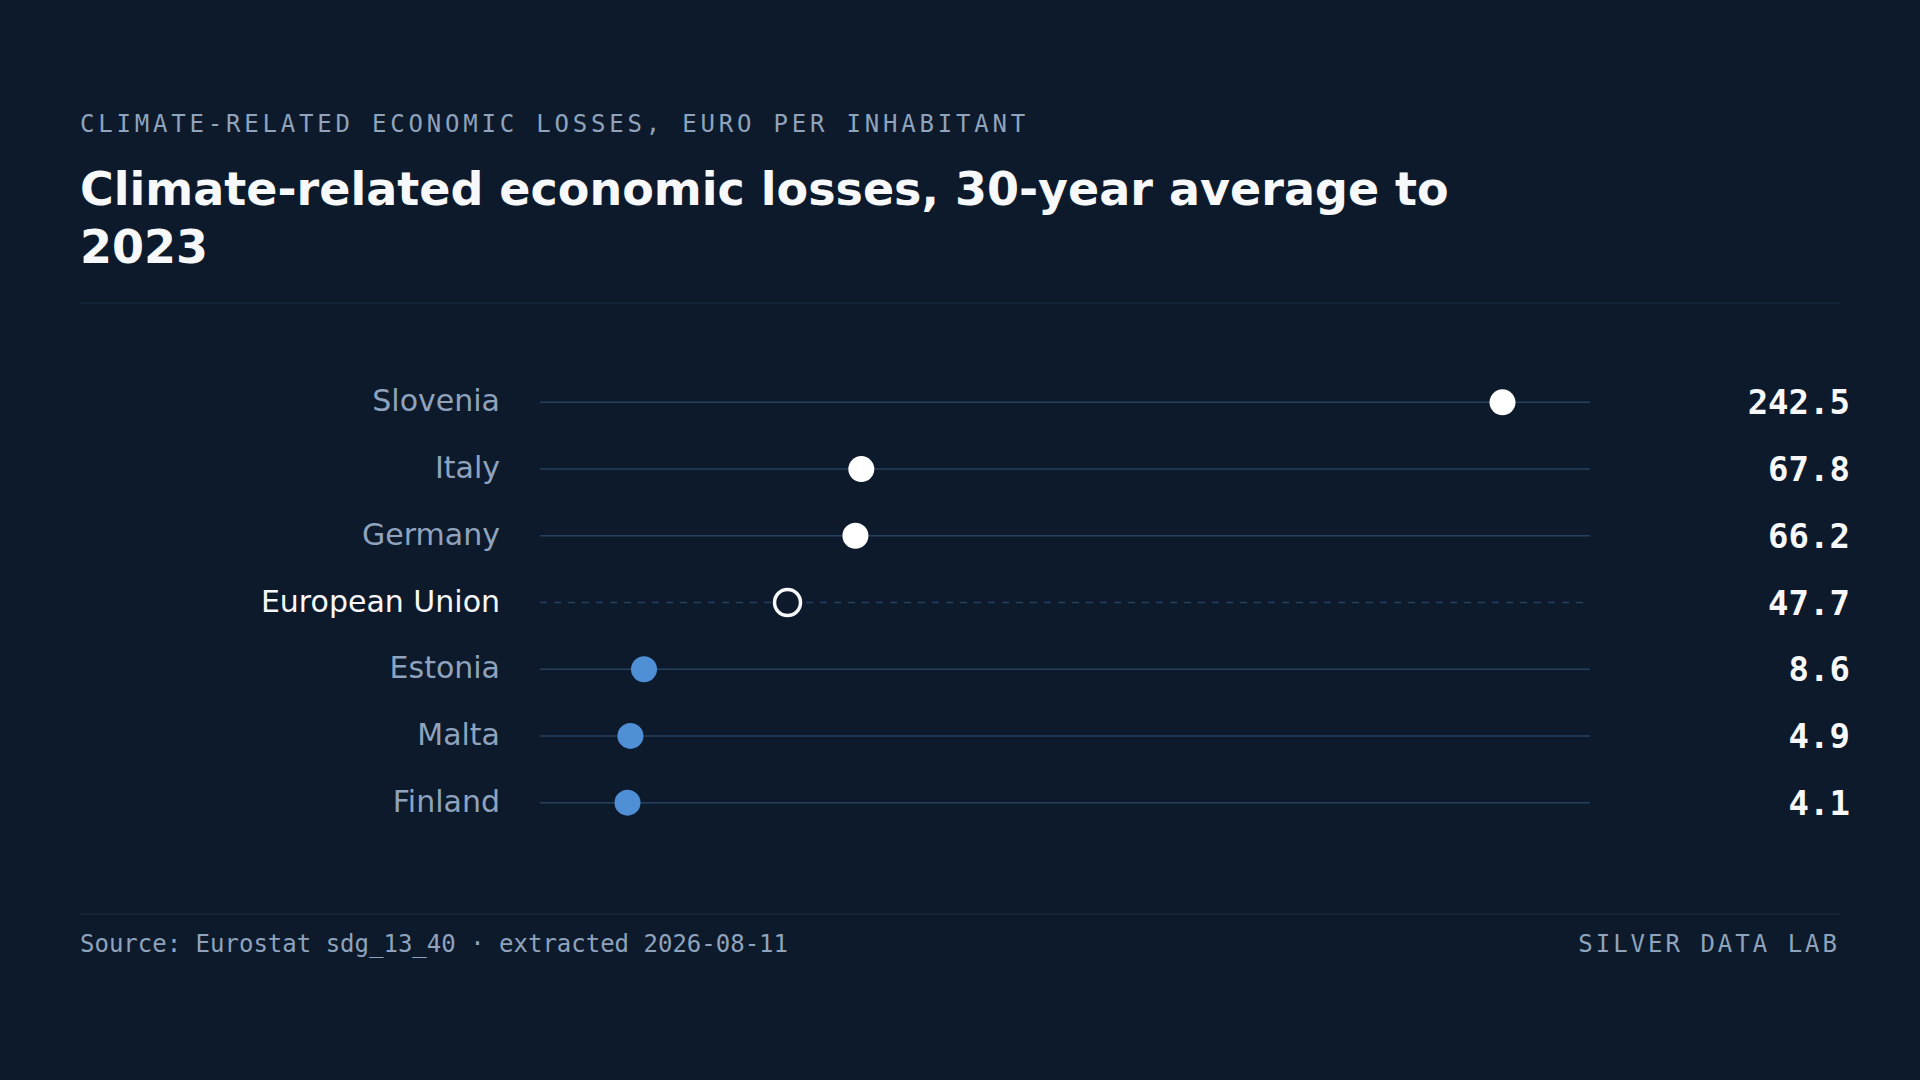
- Climate-related disasters cost the EU 47.7 euro per inhabitant a year, averaged over the thirty years to 2023.
- Slovenia records 242.5 euro per inhabitant — more than three times the next highest Member State.
- Italy records 67.8 euro, Germany 66.2 and Austria 60.3.
- Finland records 4.1 euro, Malta 4.9 and Estonia 8.6.
- Only one Member State exceeds 100 euro per inhabitant, and twenty of twenty-seven are below the EU average.
Counting what the weather costs
Eurostat compiles the economic losses attributed to climate-related events — floods, storms, droughts, heatwaves, wildfires and cold spells — and expresses them per inhabitant at constant prices, averaged over thirty years.
The averaging is the important design choice. Climate losses do not arrive evenly: a country can go a decade with almost nothing and then record its entire century's damage in one August. A thirty-year average is an attempt to describe exposure rather than luck.
On that basis the EU figure is 47.7 euro per inhabitant per year.
Slovenia
Slovenia records 242.5 euro per inhabitant, more than three times Italy in second place and more than five times the EU average.
This is the largest outlier on any indicator this site has published, and it is not a data artefact. Slovenia is a small country — two million people — with mountainous terrain, steep river catchments and settlement concentrated in valleys. The August 2023 floods affected a large share of its territory and caused damage estimated at a substantial fraction of annual national output.
When damage of that scale lands on two million people, the per-inhabitant figure moves in a way it cannot in Germany or Italy. Slovenia's position reflects both genuine exposure and the arithmetic of a small denominator.
The large economies
Italy records 67.8 euro per inhabitant, Germany 66.2 and Austria 60.3. France, Greece and Spain follow.
These are the Member States that combine substantial exposure — Alpine flooding, Mediterranean drought and wildfire, North Sea and river flooding — with dense, high-value built environments. Loss figures measure the value of what was damaged, so the same storm costs more where there is more to destroy.
That is worth stating plainly, because it means this ranking is partly a ranking of wealth. A flood across an equivalent area of Bulgaria destroys less measured value than a flood across an equivalent area of Germany, and records a smaller loss.
The low end
Finland records 4.1 euro per inhabitant, Malta 4.9 and Estonia 8.6, with Sweden at 12.1.
The northern Member States sit low on this measure for reasons that will not necessarily persist. Their exposure to the specific hazards that have dominated the last thirty years — river flooding in dense valleys, Mediterranean wildfire and drought — has been limited, which is a statement about the past rather than a forecast.
What the indicator cannot do
A thirty-year average to 2023 is dominated by events that have already happened, and it is measured in euro of damage rather than in physical hazard. It is a record of loss, not a projection of risk, and the two diverge wherever exposure is changing faster than the average can absorb.
Climate-related economic losses, 30-year average to 2023
| Country | euro per inhabitant, constant prices | Gap to EU averagederived |
|---|---|---|
| Slovenia | 242.5 | +194.8 |
| Italy | 67.8 | +20.1 |
| Germany | 66.2 | +18.5 |
| European Unionaggregate | 47.7 | — |
| Estonia | 8.6 | −39.1 |
| Malta | 4.9 | −42.8 |
| Finland | 4.1 | −43.6 |
This table as data: CSV · JSON
Every Member State for this indicator+
Members see every Member State for this indicator here, not only the rows the ranking prints. Become a Member
Embed this chart
Paste this code into a page. The frame carries the source and the extraction date, and links back to the study.
What these figures cannot tell you
- Losses measure value destroyed, not hazard
- The same physical event produces a larger loss where property values are higher. This ranking therefore reflects wealth and building density alongside climatic exposure, and understates hazard in the Union's poorer Member States.
- Small countries are volatile even over thirty years
- A single major event can dominate a small Member State's thirty-year average. Slovenia's figure rests heavily on the August 2023 floods, and the per-inhabitant measure amplifies any event that lands on a small population.
- Attribution to climate is a classification, not a finding
- Events are classified as climate-related according to their type. That classification does not establish that any individual event was caused or intensified by climate change, and this study makes no such claim.
- Insured and uninsured losses are compiled differently
- Loss estimates draw on insurance and public sources whose coverage differs between Member States and over time. Comparability is better at the scale of the gaps described here than between countries a few euro apart.
Frequently asked questions
- How much do climate disasters cost the EU?
- 47.7 euro per inhabitant per year, averaged over the thirty years to 2023, measured at constant prices. The figure covers floods, storms, droughts, heatwaves, wildfires and cold spells.
- Which EU country has the highest climate losses?
- Slovenia, at 242.5 euro per inhabitant — more than three times Italy in second place. Slovenia's mountainous terrain, valley settlement and the August 2023 floods combine with a population of two million to produce the highest per-person figure in the Union.
- Which EU country has the lowest climate losses?
- Finland at 4.1 euro per inhabitant, followed by Malta at 4.9 and Estonia at 8.6. Their limited exposure to the hazards that have dominated the last thirty years is a statement about the past rather than a forecast.
- Why is this a thirty-year average?
- Because climate losses arrive in bursts. A country can record almost nothing for a decade and then its worst damage on record in a single month. Averaging over thirty years is an attempt to measure exposure rather than whether a given year happened to contain a disaster.
Methodological note
Eurostat publishes climate-related economic losses as a thirty-year moving average in euro per inhabitant at constant prices, covering meteorological, hydrological and climatological events.
Values are for the average of the thirty years ending in 2023 and cover all 27 Member States.
The count of Member States above and below the EU figure, the ratio between Slovenia and the EU average, and the characterisation of the ranking as partly reflecting property values are derived by Silver Data Lab from the published values.
Source data
The underlying series can be inspected and re-downloaded from the Eurostat data browser. The filters below are the ones applied.
Climate related economic losses
sdg_13_40
- Filters applied:
- freq=A · statinfo=AVG_30Y · unit=EUR_HAB_KP · stk_flow=LOSS · time=2023
- Extracted:
- 2026-08-11
- Source last updated:
- 2025-10-27
Download the data
The data the study you have just read is built on, exactly as it was downloaded and archived.
Yours as a Member.
Data downloadable by Members
How to cite
Record the vintage as well as the study: the figures on this page are the ones extracted on the dates below.
Silver Data Lab Research Desk (2025). Extreme Weather Costs Slovenia Five Times the EU Average per Person. Silver Data Lab, published 30 October 2025, last updated 11 October 2026. https://www.silverdatalab.com/studies/climate-related-economic-losses-in-the-eu
- Data: Eurostat, Climate related economic losses (sdg_13_40), filters freq=A, statinfo=AVG_30Y, unit=EUR_HAB_KP, stk_flow=LOSS, time=2023; extracted 2026-08-11; source last updated 2025-10-27. https://doi.org/10.2908/sdg_13_40
Silver Data Lab's analysis is licensed CC BY 4.0. The statistics remain their publisher's and keep its terms of reuse.
Ask the research desk
A question about this study — a definition, a filter, a break in the series, what the figures can and cannot support — answered by the desk that made the extraction.
Members can write to the research desk
Studies where the same country leads or trails
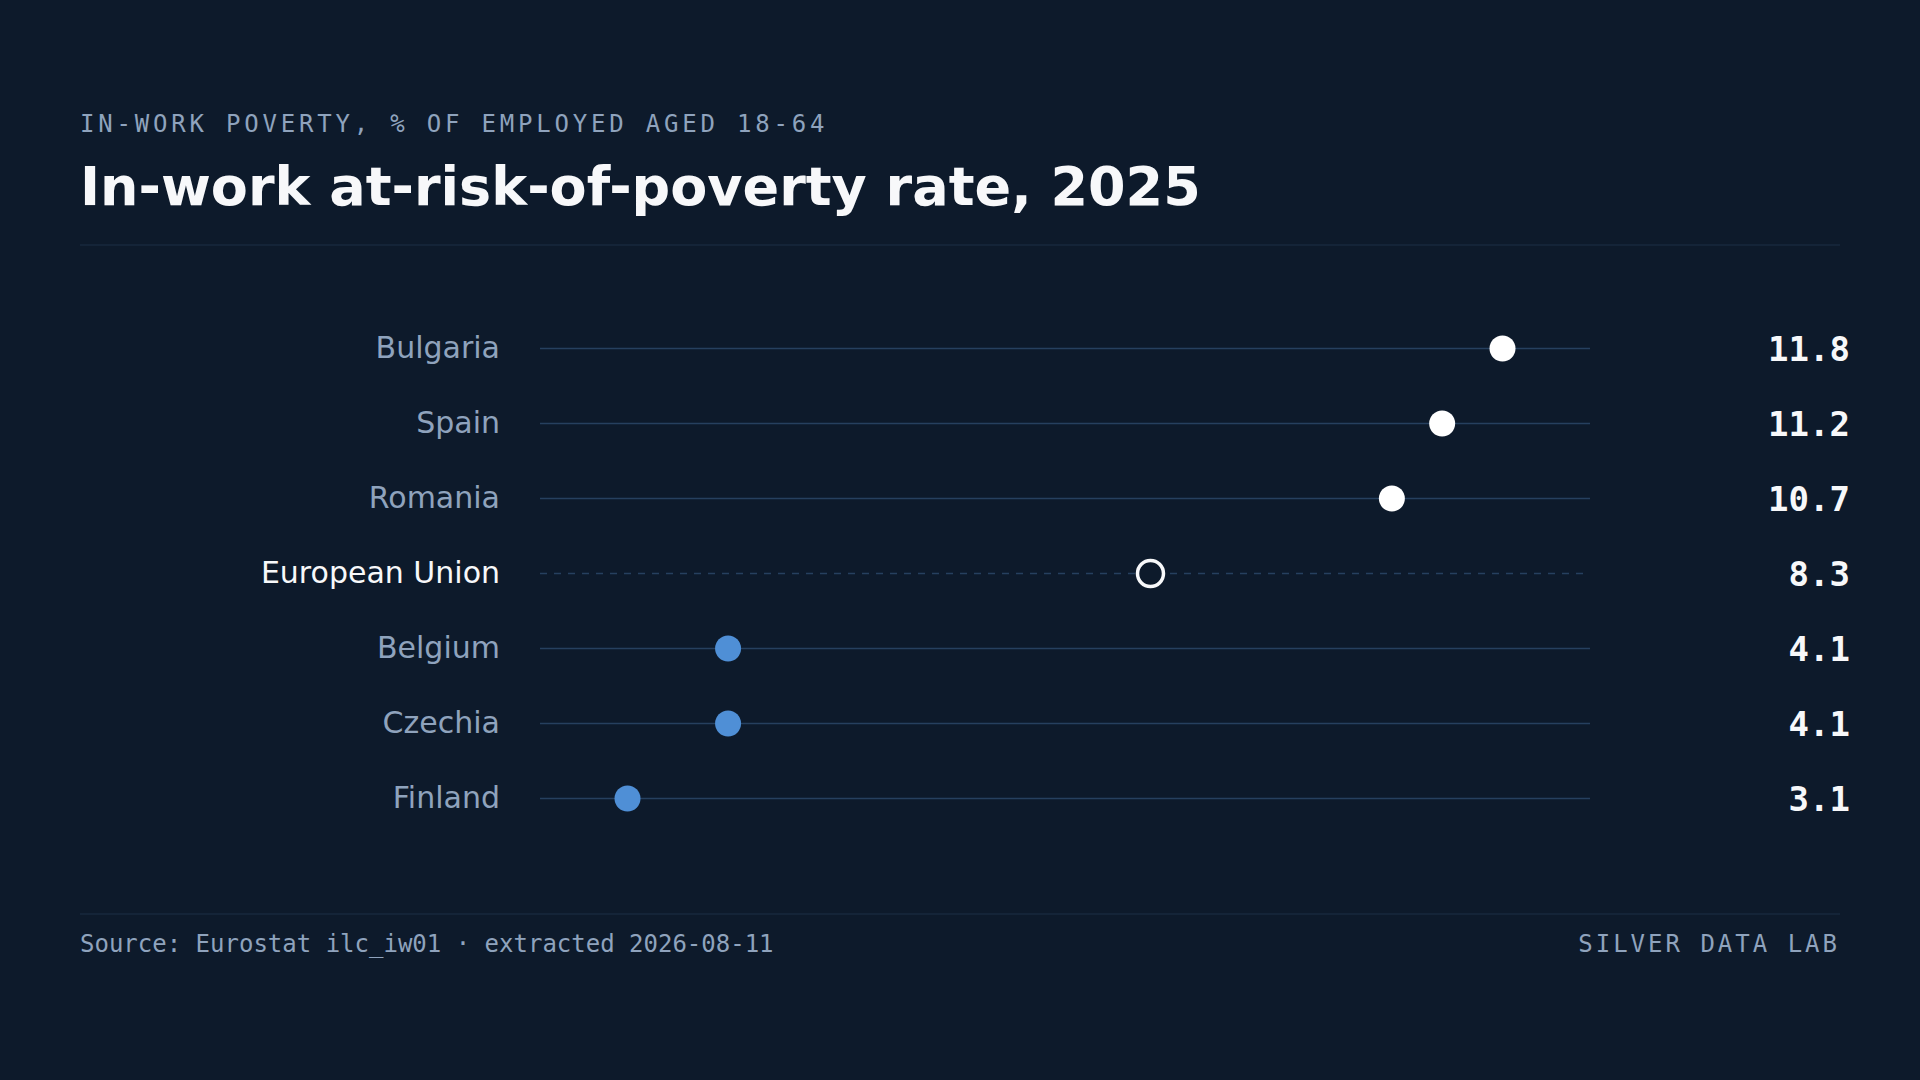
11.8% of Bulgarians With a Job Are Poor, the Highest Share in the EU
8.3% of employed people aged 18 to 64 in the EU lived below the at-risk-of-poverty line in 2025.
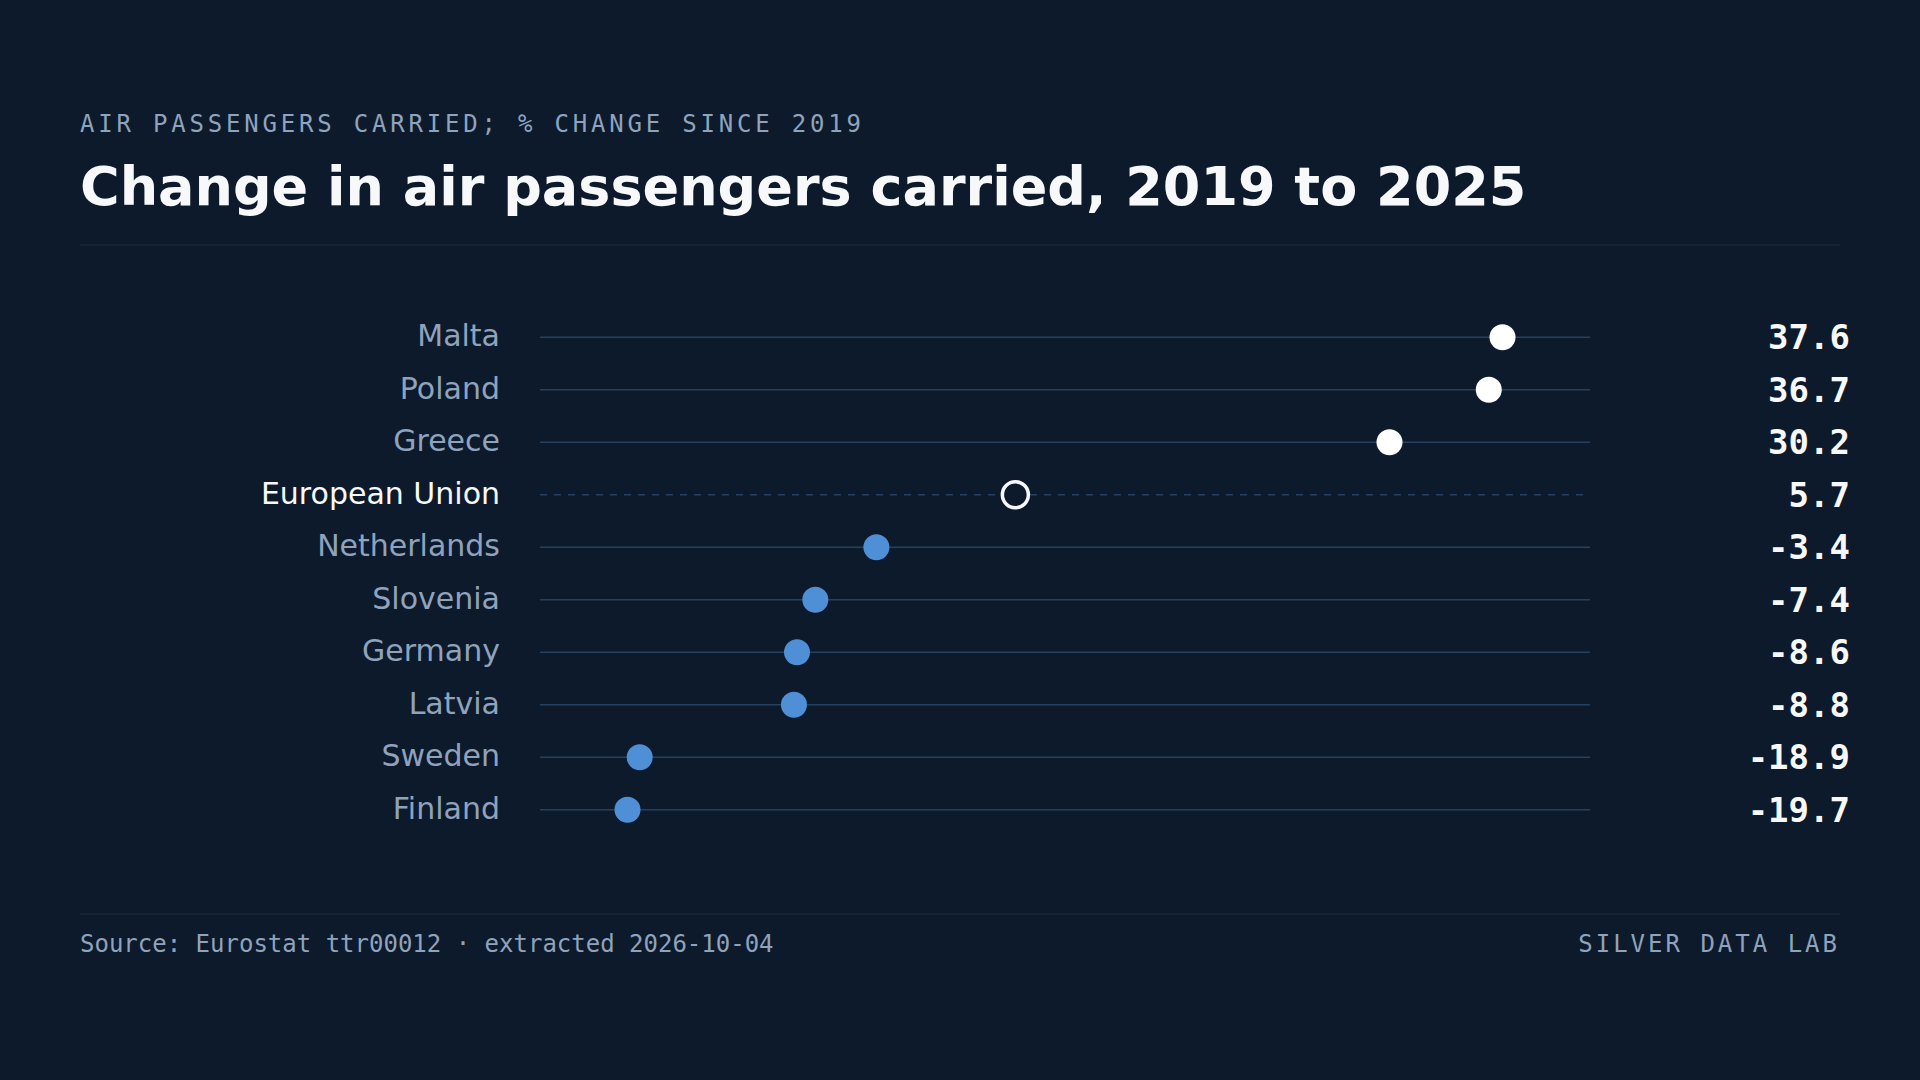
Air Travel in the EU Is Back Above Its Pre-Pandemic Level
Air passengers carried in the EU reached 1,093.6 million in 2025, 5.7% more than in 2019; the total first passed its 2019 level in 2024, by 0.7%.
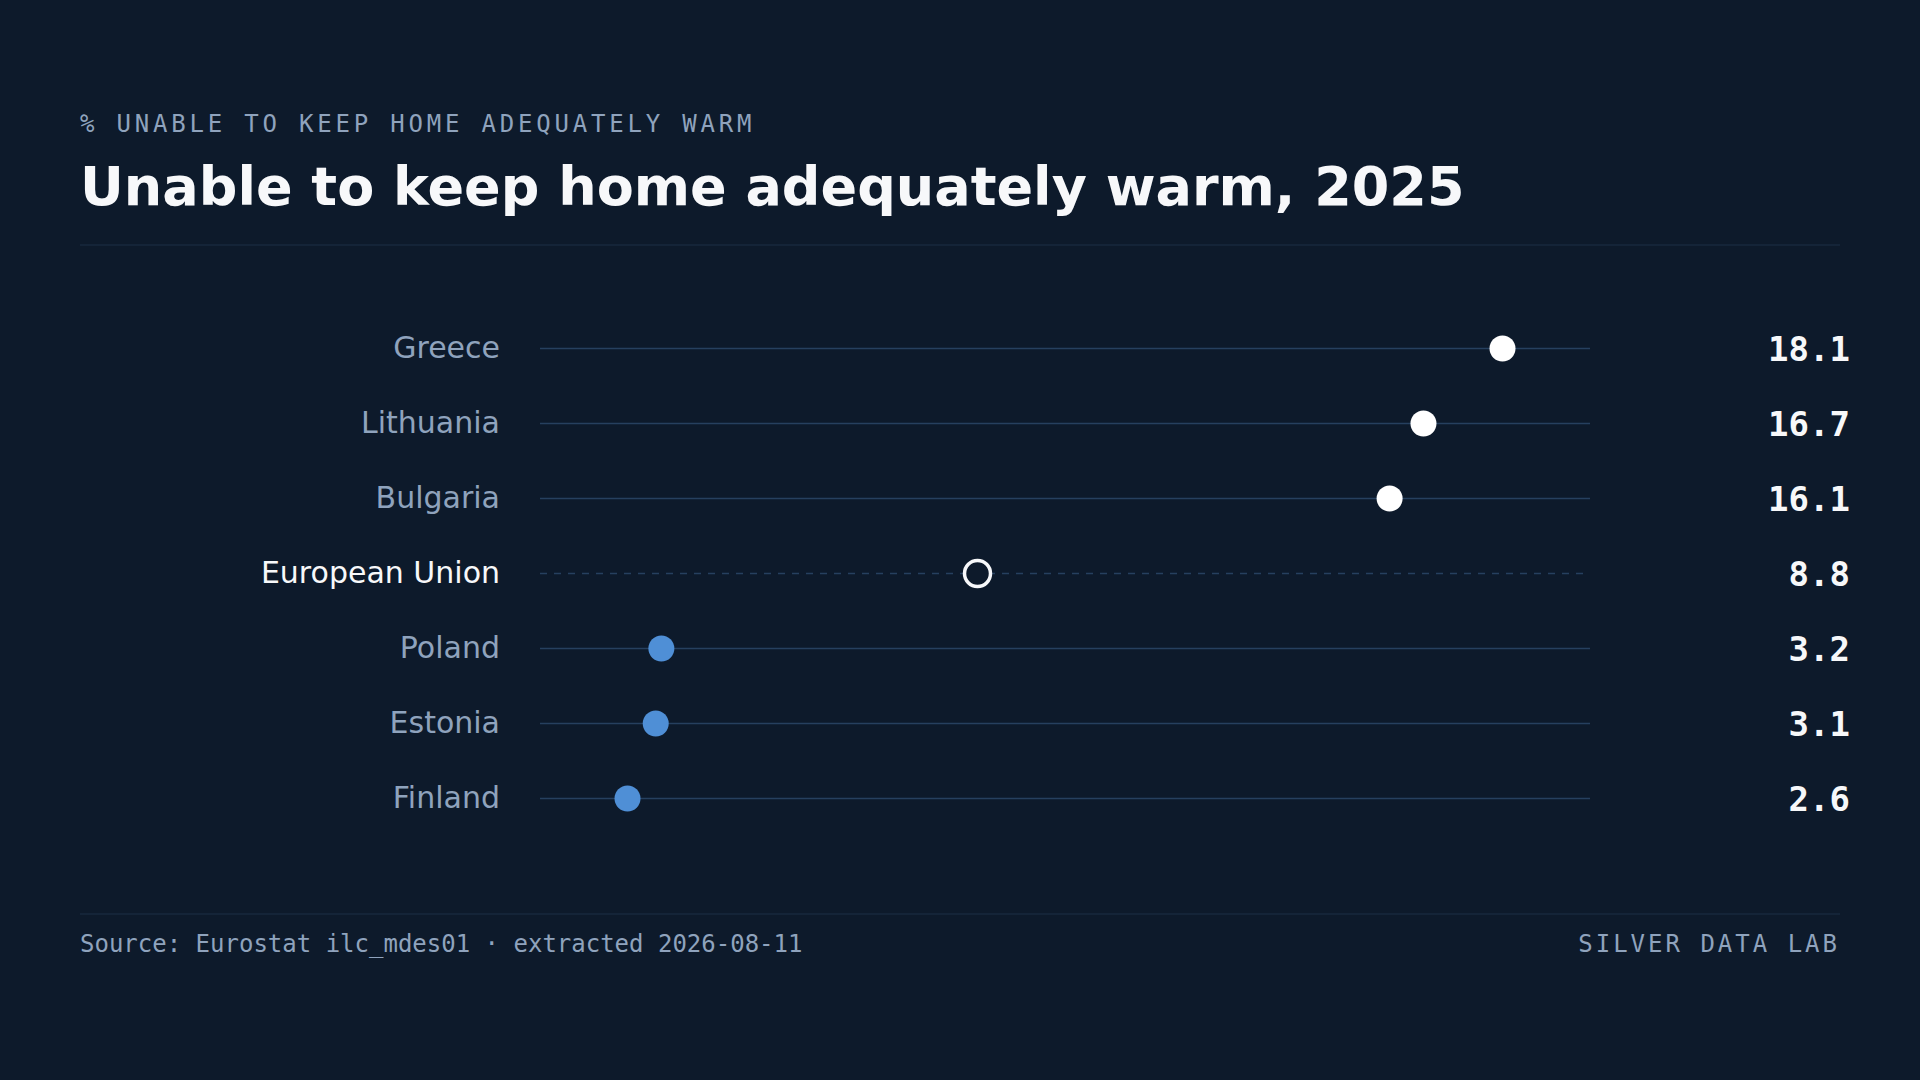
Greece Has the EU's Highest Share of People Who Cannot Afford Heating
8.8% of the EU population could not keep their home adequately warm in 2025.