After Eight Years of Negative Rates, the ECB Raised Them Faster Than Ever
Silver Data Lab Research Desk · Statistical analysis · Published on 20 June 2026
- Data source
- European Central Bank
- Reference period
- 1999-2026
- Last updated
- 11 October 2026
Re-checked against the source on 16 September 2026. No value in its datasets has moved between the snapshots we hold. Every revision we have observed →
Key estimates
- The deposit facility rate stood at -0.50% from September 2019 until July 2022, the end of eight years below zero that began in June 2014 — and of a decade at or below it, the rate having first reached zero in July 2012.
- It reached 4.00% on 20 September 2023, the highest level in the history of the single currency.
- That was ten increases in fourteen months — from -0.50% to 4.00%, a move of 450 basis points.
- Eight reductions between June 2024 and June 2025 brought it back to 2.00%.
- It stands at 2.50% following increases on 17 June and 16 September 2026, 150 basis points below the peak.
- The main refinancing rate is 2.65% and the marginal lending rate 2.90%, both as at 16 September 2026.
Three rates, one that matters
The ECB sets three rates. The main refinancing operations rate, at 2.65%, is the headline figure most often quoted. The marginal lending facility, at 2.90%, is what banks pay to borrow overnight. The deposit facility rate, at 2.50%, is what they receive for parking money at the central bank.
Since 2014, when the banking system moved into persistent excess liquidity, it is the deposit rate that has governed what money actually costs in the euro area. Banks awash with reserves do not queue for refinancing; they park the surplus. The rate on that surplus becomes the floor under every other rate in the system. This study follows the deposit rate for that reason.
Eight years below zero
The rate had already come down to zero on 11 July 2012, where it stayed for almost two years. It went negative on 11 June 2014, at -0.10%. It fell in four further steps — -0.20%, -0.30%, -0.40% — and reached -0.50% on 18 September 2019.
It stayed there until 27 July 2022.
For eight years, a commercial bank holding reserves at the ECB paid for the privilege. Negative policy rates began as an emergency measure and became the ordinary condition of European monetary policy for the better part of a decade. An entire cohort of borrowers, savers and treasurers learned their trade in a system where the floor rate was below zero — and counted from the day the rate first touched zero, reserves at the ECB earned a bank nothing for a full decade.
Fourteen months
On 27 July 2022 the rate returned to zero. By 20 September 2023 it stood at 4.00%.
Ten increases, 450 basis points, fourteen months. Nothing in the history of the euro comes close: the rate had never been above 3.75% before, and had never moved this far this fast.
The pace is the finding. A central bank that had spent a decade signalling patience compressed a full tightening cycle into little more than a year.
Down, and then up again
The first reduction came on 12 June 2024, nine months after the peak. Seven more followed, at intervals of roughly six to eight weeks through the first half of 2025, reaching 2.00% on 11 June 2025.
Then the cuts stopped. The rate held at 2.00% for a full year before rising to 2.25% on 17 June 2026, the first increase since the 2022-23 cycle, and to 2.50% on 16 September 2026. Two increases three months apart are what stop this series being a story of tightening followed by normalisation and nothing else.
What a policy rate does and does not tell you
The deposit rate is an instrument, not an outcome. It says what the central bank charges, not what a household pays for a mortgage or a firm pays for working capital. Those depend on the rate banks add on top, which varies by country, by borrower and by collateral.
Nor does the level alone say whether policy is tight or loose. A rate of 2.50% means something different when prices are rising at 2% than at 8%. What the series does record, unambiguously, is the sequence of decisions and their timing — the one thing a central bank controls directly and announces publicly.
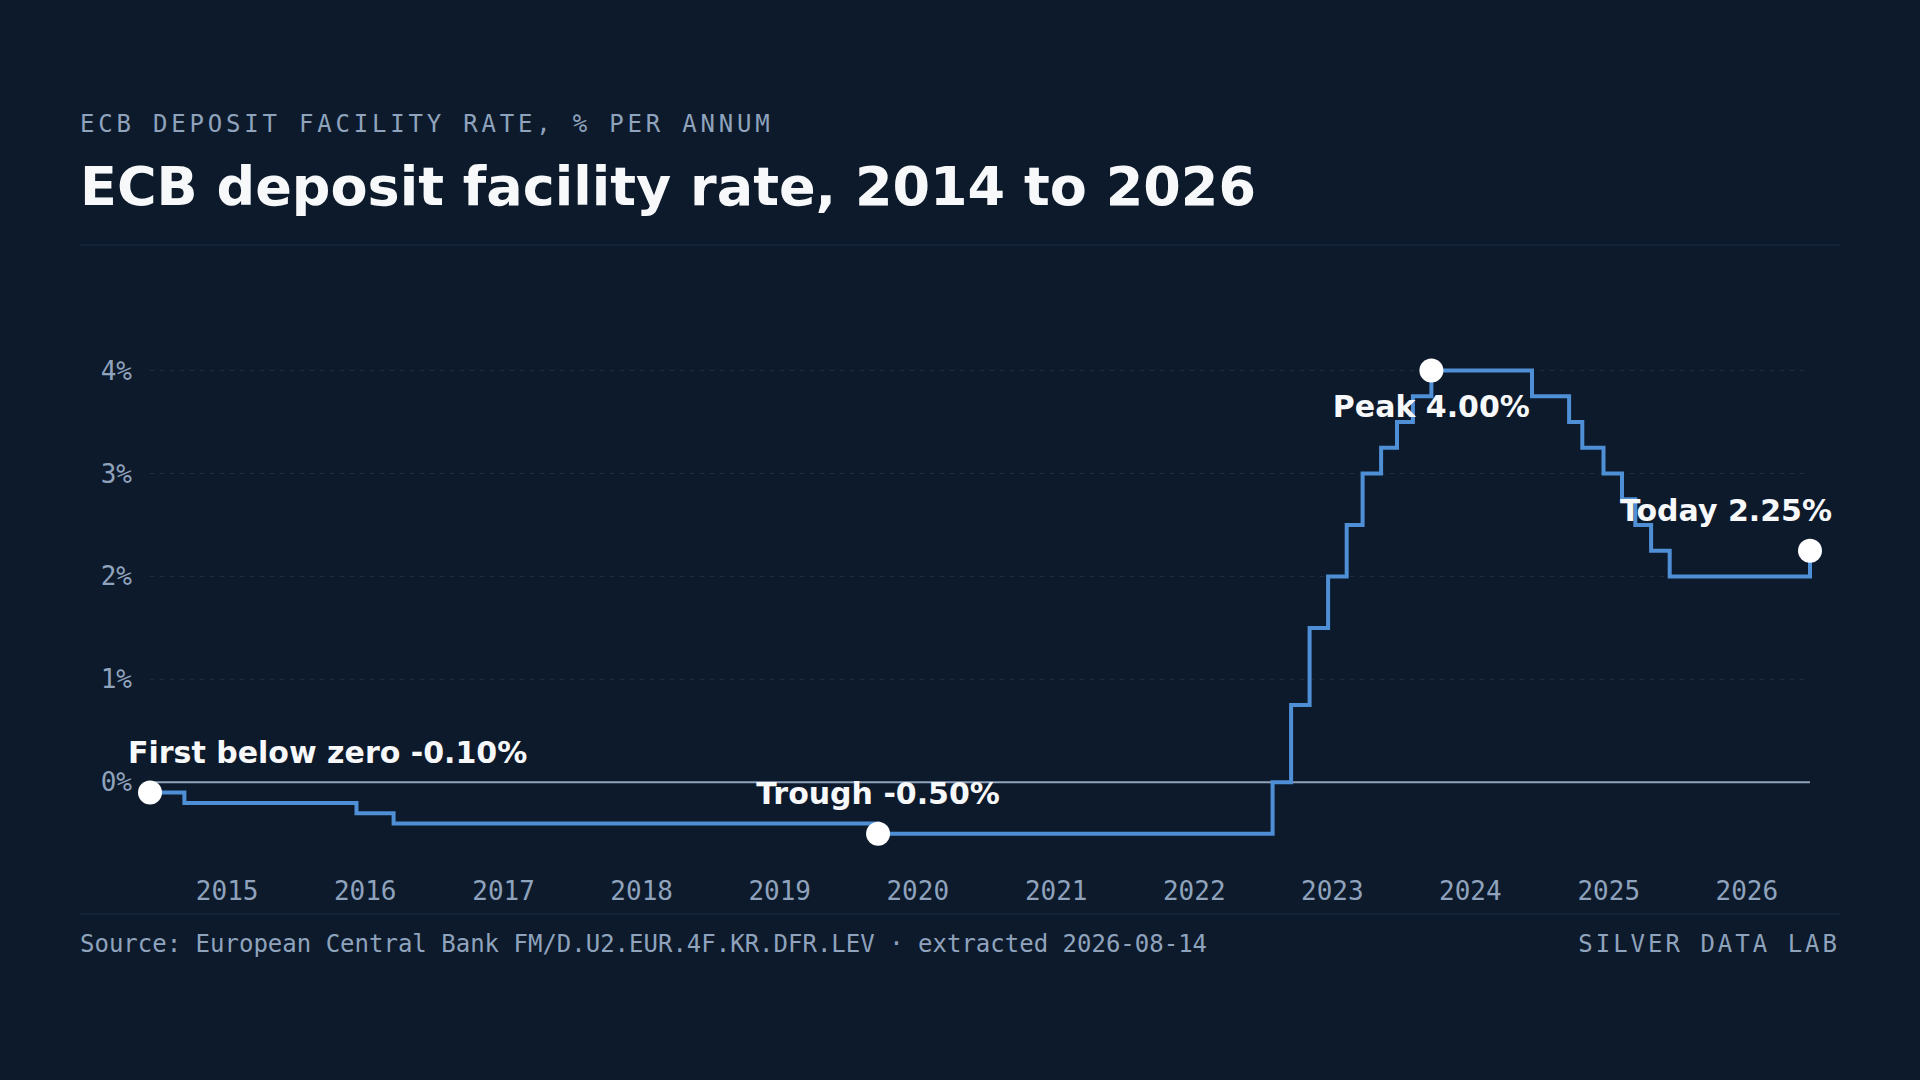
ECB deposit facility rate, 2014 to 2026
Every date on which the deposit facility rate changed, from the first move below zero in June 2014 to the current level.
- First below zero -0.10% · 2014-06-11
- Trough -0.50% · 2019-09-18
- Peak 4.00% · 2023-09-20
- Today 2.50% · 2026-09-16
What these figures cannot tell you
- A policy rate is not a market rate
- The deposit facility rate is what banks receive from the ECB. What households and firms pay depends on bank margins, credit risk and collateral, and differs substantially between Member States. This study makes no claim about borrowing costs in the real economy.
- Three rates, one series
- The chart follows the deposit facility rate because excess liquidity has made it the effective policy rate since 2014. Before that period the main refinancing rate was the operative one, so the earliest years of the series are less representative of policy stance than the later ones.
- Rates apply to the euro area, not the EU
- ECB policy covers the twenty-one countries that use the euro, Bulgaria among them since 1 January 2026. The six EU Member States outside the euro area — Poland, Sweden, Czechia, Denmark, Romania and Hungary — set their own policy rates through their national central banks.
- Dates are effective dates
- Each observation is dated to the day the rate took effect, which follows the Governing Council's decision by roughly a week. The decision dates are not the dates shown here.
Frequently asked questions
- What is the ECB deposit rate now?
- 2.50% per annum, effective 16 September 2026. The main refinancing rate is 2.65% and the marginal lending rate 2.90%, both as at the same date.
- How high did ECB rates go?
- The deposit facility rate peaked at 4.00% on 20 September 2023, the highest level since the euro was introduced in 1999. It is now 150 basis points below that peak.
- How long were ECB rates negative?
- Eight years. The deposit rate first went below zero on 11 June 2014 at -0.10%, reached -0.50% in September 2019, and returned to zero on 27 July 2022.
- Why does this study follow the deposit rate rather than the main refinancing rate?
- Because since 2014 the euro-area banking system has held persistent excess liquidity. Banks with surplus reserves deposit them rather than borrowing, so the deposit rate — not the refinancing rate — sets the effective floor for money market rates.
- Do ECB rates apply to the whole EU?
- No. They apply to the twenty-one countries that use the euro, Bulgaria included since 1 January 2026. The six EU members outside the euro area — Poland, Sweden, Czechia, Denmark, Romania and Hungary — set their own policy rates through their national central banks.
Methodological note
The ECB publishes its key interest rates as daily series through the ECB Data Portal. This study uses the deposit facility rate at the level published, with no adjustment, from the start of the series on 1 January 1999.
The chart plots the rate as a step line, because a policy rate holds its value between decisions rather than moving continuously.
The counts of increases and reductions, the 450 basis point span of the tightening cycle, the fourteen-month duration, the eight years below zero, the decade at or below it and the 150 basis point distance from the peak are derived by Silver Data Lab from the published series by identifying the dates on which the value changed. The main refinancing and marginal lending rates are quoted from their own series at the same extraction date.
Source data
This study draws on 3 datasets from European Central Bank. Each can be inspected and re-downloaded from its catalogue, and the filters below are the ones applied.
ECB deposit facility rate, daily
FM/D.U2.EUR.4F.KR.DFR.LEV
- Filters applied:
- freq=D · ref_area=U2 · currency=EUR · provider_fm=4F · instrument_fm=KR · provider_fm_id=DFR · data_type_fm=LEV
- Extracted:
- 2026-09-16
- Source last updated:
- 2026-09-16
ECB main refinancing operations rate, daily
FM/D.U2.EUR.4F.KR.MRR_FR.LEV
- Filters applied:
- freq=D · ref_area=U2 · currency=EUR · provider_fm=4F · instrument_fm=KR · provider_fm_id=MRR_FR · data_type_fm=LEV
- Extracted:
- 2026-09-16
- Source last updated:
- 2026-09-16
ECB marginal lending facility rate, daily
FM/D.U2.EUR.4F.KR.MLFR.LEV
- Filters applied:
- freq=D · ref_area=U2 · currency=EUR · provider_fm=4F · instrument_fm=KR · provider_fm_id=MLFR · data_type_fm=LEV
- Extracted:
- 2026-09-16
- Source last updated:
- 2026-09-16
Download the data
The data the study you have just read is built on, exactly as it was downloaded and archived.
Yours as a Member.
Data downloadable by Members
How to cite
Record the vintage as well as the study: the figures on this page are the ones extracted on the dates below.
Silver Data Lab Research Desk (2026). After Eight Years of Negative Rates, the ECB Raised Them Faster Than Ever. Silver Data Lab, published 20 June 2026, last updated 11 October 2026. https://www.silverdatalab.com/studies/ecb-key-interest-rates
- Data: European Central Bank, ECB deposit facility rate, daily (FM/D.U2.EUR.4F.KR.DFR.LEV), filters freq=D, ref_area=U2, currency=EUR, provider_fm=4F, instrument_fm=KR, provider_fm_id=DFR, data_type_fm=LEV; extracted 2026-09-16; source last updated 2026-09-16. https://data.ecb.europa.eu/data/datasets/FM/FM.D.U2.EUR.4F.KR.DFR.LEV
- Data: European Central Bank, ECB main refinancing operations rate, daily (FM/D.U2.EUR.4F.KR.MRR_FR.LEV), filters freq=D, ref_area=U2, currency=EUR, provider_fm=4F, instrument_fm=KR, provider_fm_id=MRR_FR, data_type_fm=LEV; extracted 2026-09-16; source last updated 2026-09-16. https://data.ecb.europa.eu/data/datasets/FM/FM.D.U2.EUR.4F.KR.MRR_FR.LEV
- Data: European Central Bank, ECB marginal lending facility rate, daily (FM/D.U2.EUR.4F.KR.MLFR.LEV), filters freq=D, ref_area=U2, currency=EUR, provider_fm=4F, instrument_fm=KR, provider_fm_id=MLFR, data_type_fm=LEV; extracted 2026-09-16; source last updated 2026-09-16. https://data.ecb.europa.eu/data/datasets/FM/FM.D.U2.EUR.4F.KR.MLFR.LEV
Silver Data Lab's analysis is licensed CC BY 4.0. The statistics remain their publisher's and keep its terms of reuse.
Ask the research desk
A question about this study — a definition, a filter, a break in the series, what the figures can and cannot support — answered by the desk that made the extraction.
Members can write to the research desk