Prices Rose Eight Times Faster in Romania Than in Cyprus
Silver Data Lab Research Desk · Statistical analysis · Published on 09 February 2026
- Data source
- Eurostat
- Reference period
- 2025
- Last updated
- 15 October 2026
Re-checked against the source on 11 August 2026. No value in its datasets has moved between the snapshots we hold. Every revision we have observed →
Key estimates
- Consumer prices across the EU rose 2.5% on annual average in 2025, and 2.1% in the euro area.
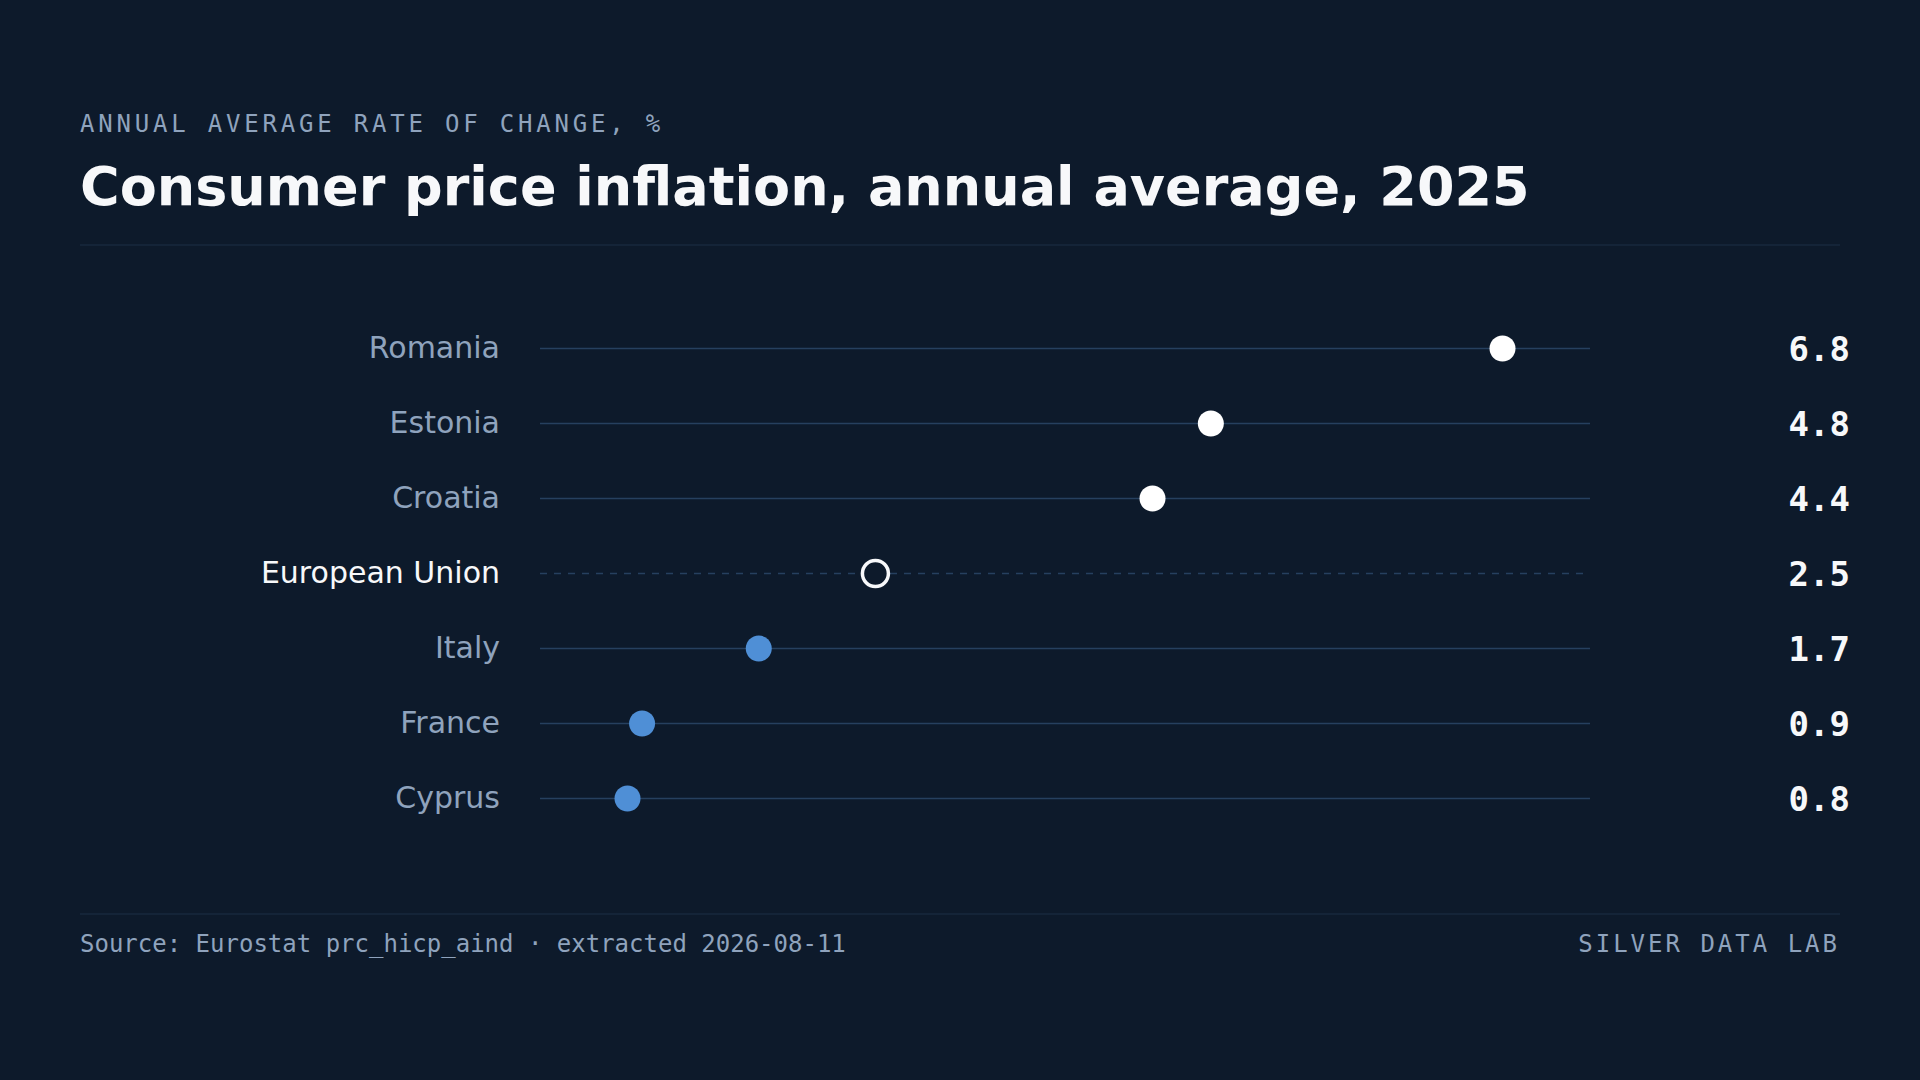
- The spread between the fastest and slowest Member State was 6.0 percentage points: Romania at 6.8%, Cyprus at 0.8%.
- 22 of 27 Member States recorded inflation above 2%, the rate the European Central Bank targets for the euro area.
- The five slowest were Cyprus, France, Italy, Finland and Denmark, all at or below 1.8%.
- All but one of the eight fastest were central and eastern European economies, a grouping the EU average conceals entirely.
An average that hides six points
Consumer prices in the European Union rose 2.5% on annual average in 2025. In the euro area the same measure reads 2.1%, close enough to the European Central Bank's 2% objective to look like a policy that worked.
Both numbers are correct, and each happens to match a Member State or two: Luxembourg and Slovenia also recorded 2.5%, Ireland 2.1%. What neither describes is the range behind them. Twenty-seven national rates run from 6.8% to 0.8%, a spread of six percentage points, and a household in Bucharest and a household in Nicosia lived through the same year inside the same single market with price changes that differ by a factor of more than eight.
Where prices rose fastest
Romania recorded 6.8%, well ahead of Estonia at 4.8%. Croatia and Hungary follow at 4.4%, Slovakia at 4.2%, Latvia at 3.8%, Austria at 3.6% and Bulgaria at 3.5%.
The composition of that group is the finding. With the single exception of Austria, the eight fastest-inflating economies in the Union are in central and eastern Europe. This is not a random draw from twenty-seven countries, and it is invisible in any figure that reports the Union as one number.
Where prices barely moved
At the other end, Cyprus recorded 0.8% and France 0.9% — both below half the ECB objective. Italy at 1.7%, Finland and Denmark at 1.8% complete the group that ran under target.
France and Italy are the two largest economies in that group, and both share the euro. A monetary policy calibrated to a euro area average of 2.1% was, for them, tighter than their own conditions warranted; for Slovakia at 4.2%, inside the same currency, it was looser.
Why the dispersion matters more than the level
Twenty-two of twenty-seven Member States recorded inflation above 2% in 2025. Read alone, that suggests a Union still above target. Read against the euro area's own 2.1%, it says something more specific: the aggregate is close to target because the large economies are, not because the Union as a whole is.
Monetary policy operates on the aggregate. It has one instrument and, in the euro area, one rate. Convergence in inflation is therefore not a technicality but the condition under which a single policy fits the economies it governs. Inside the euro area itself the rates ran from 4.8% in Estonia to 0.8% in Cyprus, a spread of 4.0 points derived here, and that rather than the Union's six is the distance the single rate had to cover.
Consumer price inflation, annual average, 2025
| Country | Annual average rate of change (%) | Gap to EU averagepercentage points, derived |
|---|---|---|
| Romania | 6.8 | +4.3 |
| Estonia | 4.8 | +2.3 |
| Croatia | 4.4 | +1.9 |
| European Unionaggregate | 2.5 | — |
| Italy | 1.7 | −0.8 |
| France | 0.9 | −1.6 |
| Cyprus | 0.8 | −1.7 |
This table as data: CSV · JSON
Every Member State for this indicator+
Members see every Member State for this indicator here, not only the rows the ranking prints. Become a Member
Embed this chart
Paste this code into a page. The frame carries the source and the extraction date, and links back to the study.
What these figures cannot tell you
- This is the annual average, not the December reading
- The rate here is the change in the annual average index against the previous annual average, which smooths within-year movements. A country whose prices spiked early and settled late can show a high annual average alongside a low year-end rate, and the two are frequently quoted interchangeably in reporting. They are not the same number.
- One basket, different consumption
- The Harmonised Index of Consumer Prices is built to be comparable across countries, with national weights reflecting what households in each country actually buy. Two countries facing identical price changes for identical goods can therefore report different HICP rates simply because their spending patterns differ, particularly in the weight given to energy and food.
- Not all Member States share the euro
- The single monetary policy argument applies to the euro area, which covered twenty Member States in 2025 on Eurostat's own definition. Romania, Hungary, Poland, Czechia, Sweden, Denmark and Bulgaria set their own policy rates over this period, so their dispersion is a different question from that of the countries inside the currency.
- An average rate says nothing about the level of prices
- A country with low inflation may still have high prices, and a country with high inflation may remain cheap. This study measures the rate of change over one year, not the cost of living, for which price level indices are the correct source.
Frequently asked questions
- What was EU inflation in 2025?
- 2.5% on annual average across the European Union, and 2.1% in the euro area. Behind those aggregates the national rates ran from 6.8% in Romania to 0.8% in Cyprus.
- Which EU country had the highest inflation in 2025?
- Romania, at 6.8% on annual average, ahead of Estonia at 4.8%, and Croatia and Hungary at 4.4%. With the exception of Austria, the eight fastest-inflating Member States were all in central and eastern Europe.
- Which EU country had the lowest inflation in 2025?
- Cyprus, at 0.8%, followed by France at 0.9%, Italy at 1.7%, and Finland and Denmark at 1.8%. All five ran below the 2% rate the European Central Bank targets.
- How many EU countries were above the 2% inflation target?
- 22 of 27 in 2025. The euro area aggregate nonetheless came in at 2.1%, because the aggregate is weighted towards the largest economies and several of those — France and Italy among them — ran below target.
Methodological note
The Harmonised Index of Consumer Prices is Eurostat's comparable measure of consumer price inflation across Member States. This study uses the all-items index, COICOP CP00, expressed as the annual average rate of change for 2025 against 2024.
The euro area figure quoted, 2.1%, is Eurostat's own aggregate for the currency union in that year, published alongside the national rates rather than computed here.
The spread of 6.0 percentage points across the Union, the 4.0-point spread inside the euro area, the ratio between the fastest and the slowest rate, the count of Member States above 2%, and the observation about the composition of the fastest group are derived by Silver Data Lab from the published national rates.
Source data
The underlying series can be inspected and re-downloaded from the Eurostat data browser. The filters below are the ones applied.
HICP — annual data (average index and rate of change)
prc_hicp_aind
- Filters applied:
- freq=A · coicop=CP00 · unit=RCH_A_AVG · time=2025
- Extracted:
- 2026-08-11
- Source last updated:
- 2026-02-06
Download the data
The data the study you have just read is built on, exactly as it was downloaded and archived.
Yours as a Member.
Data downloadable by Members
How to cite
Record the vintage as well as the study: the figures on this page are the ones extracted on the dates below.
Silver Data Lab Research Desk (2026). Prices Rose Eight Times Faster in Romania Than in Cyprus. Silver Data Lab, published 09 February 2026, last updated 15 October 2026. https://www.silverdatalab.com/studies/inflation-across-the-eu
- Data: Eurostat, HICP — annual data (average index and rate of change) (prc_hicp_aind), filters freq=A, coicop=CP00, unit=RCH_A_AVG, time=2025; extracted 2026-08-11; source last updated 2026-02-06. https://doi.org/10.2908/prc_hicp_aind
Silver Data Lab's analysis is licensed CC BY 4.0. The statistics remain their publisher's and keep its terms of reuse.
Ask the research desk
A question about this study — a definition, a filter, a break in the series, what the figures can and cannot support — answered by the desk that made the extraction.
Members can write to the research desk
Other studies on the same dataset
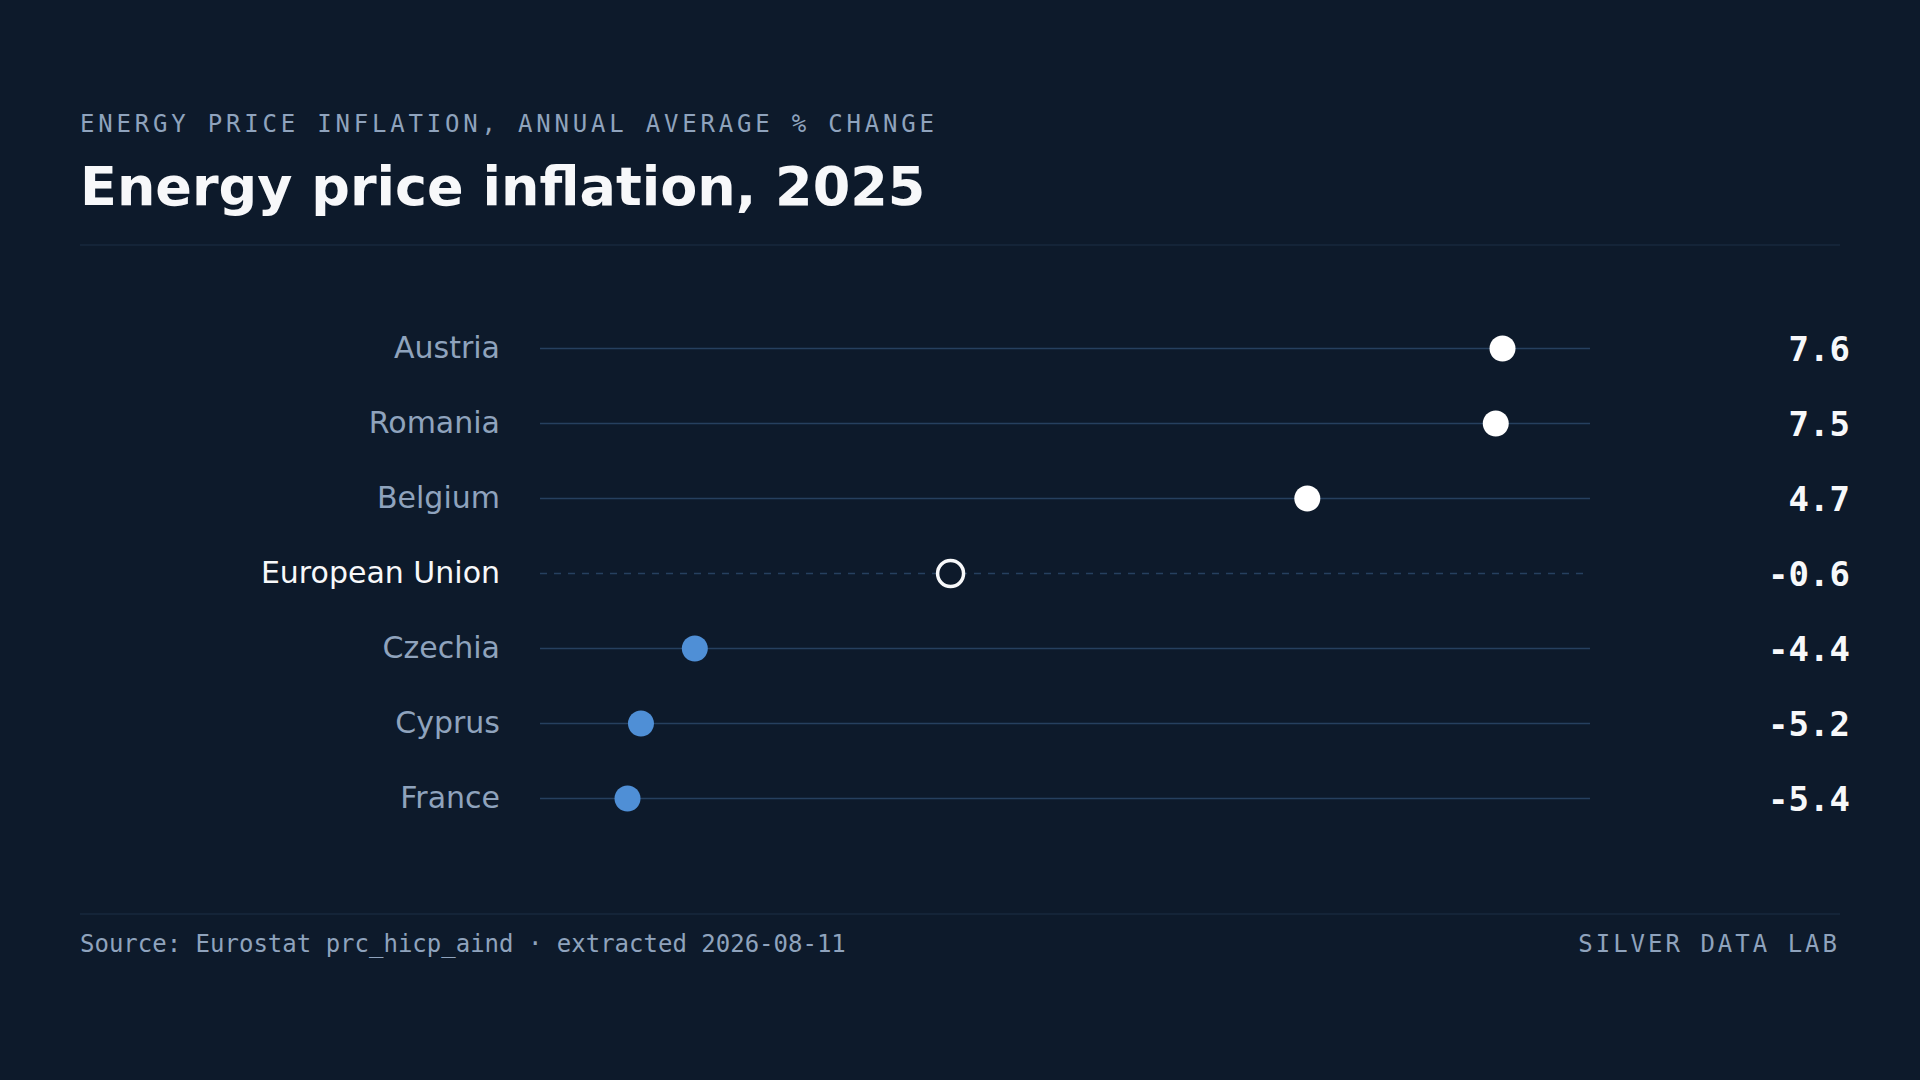
Energy Prices Fell on Average in the EU but Rose 7.6% in Austria
Energy prices in the EU fell 0.6% on average in 2025.
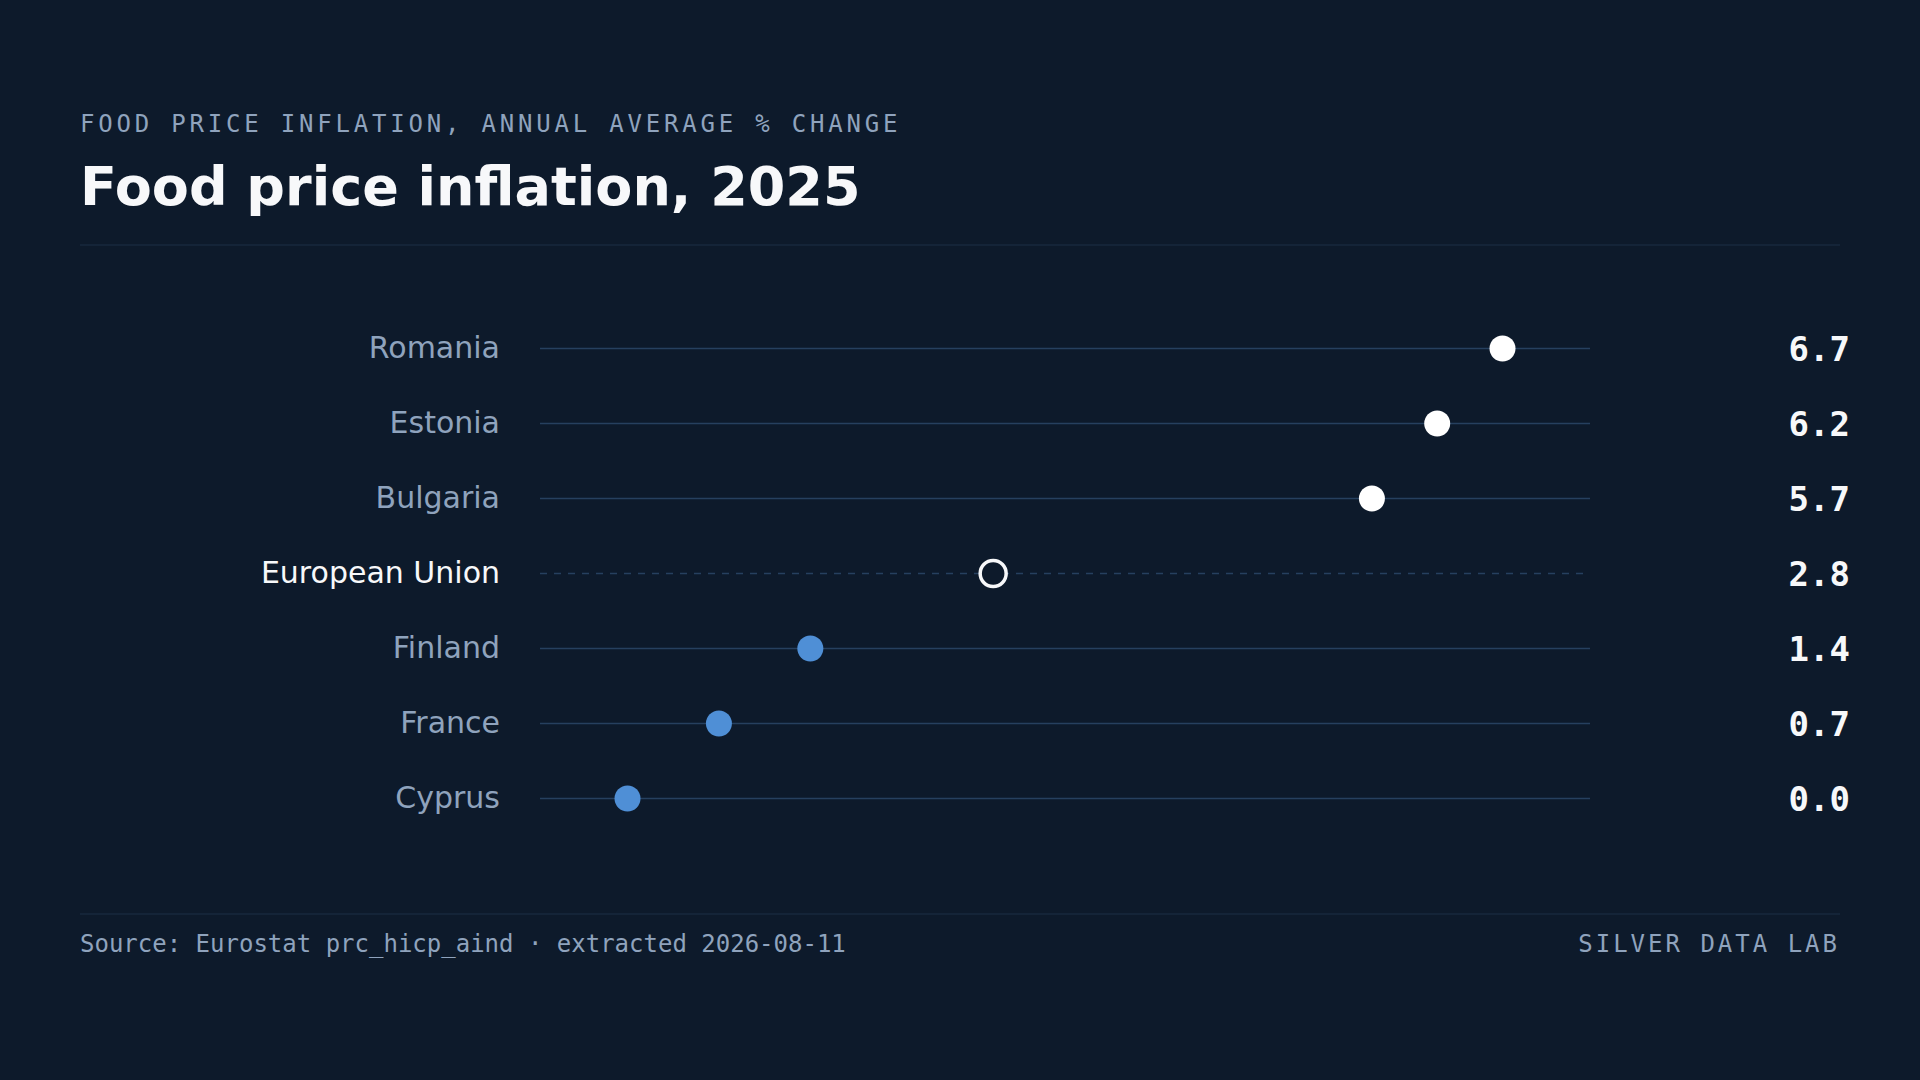
Food Prices Rose 6.7% in Romania and Not at All in Cyprus
Food prices in the EU rose 2.8% on average in 2025.
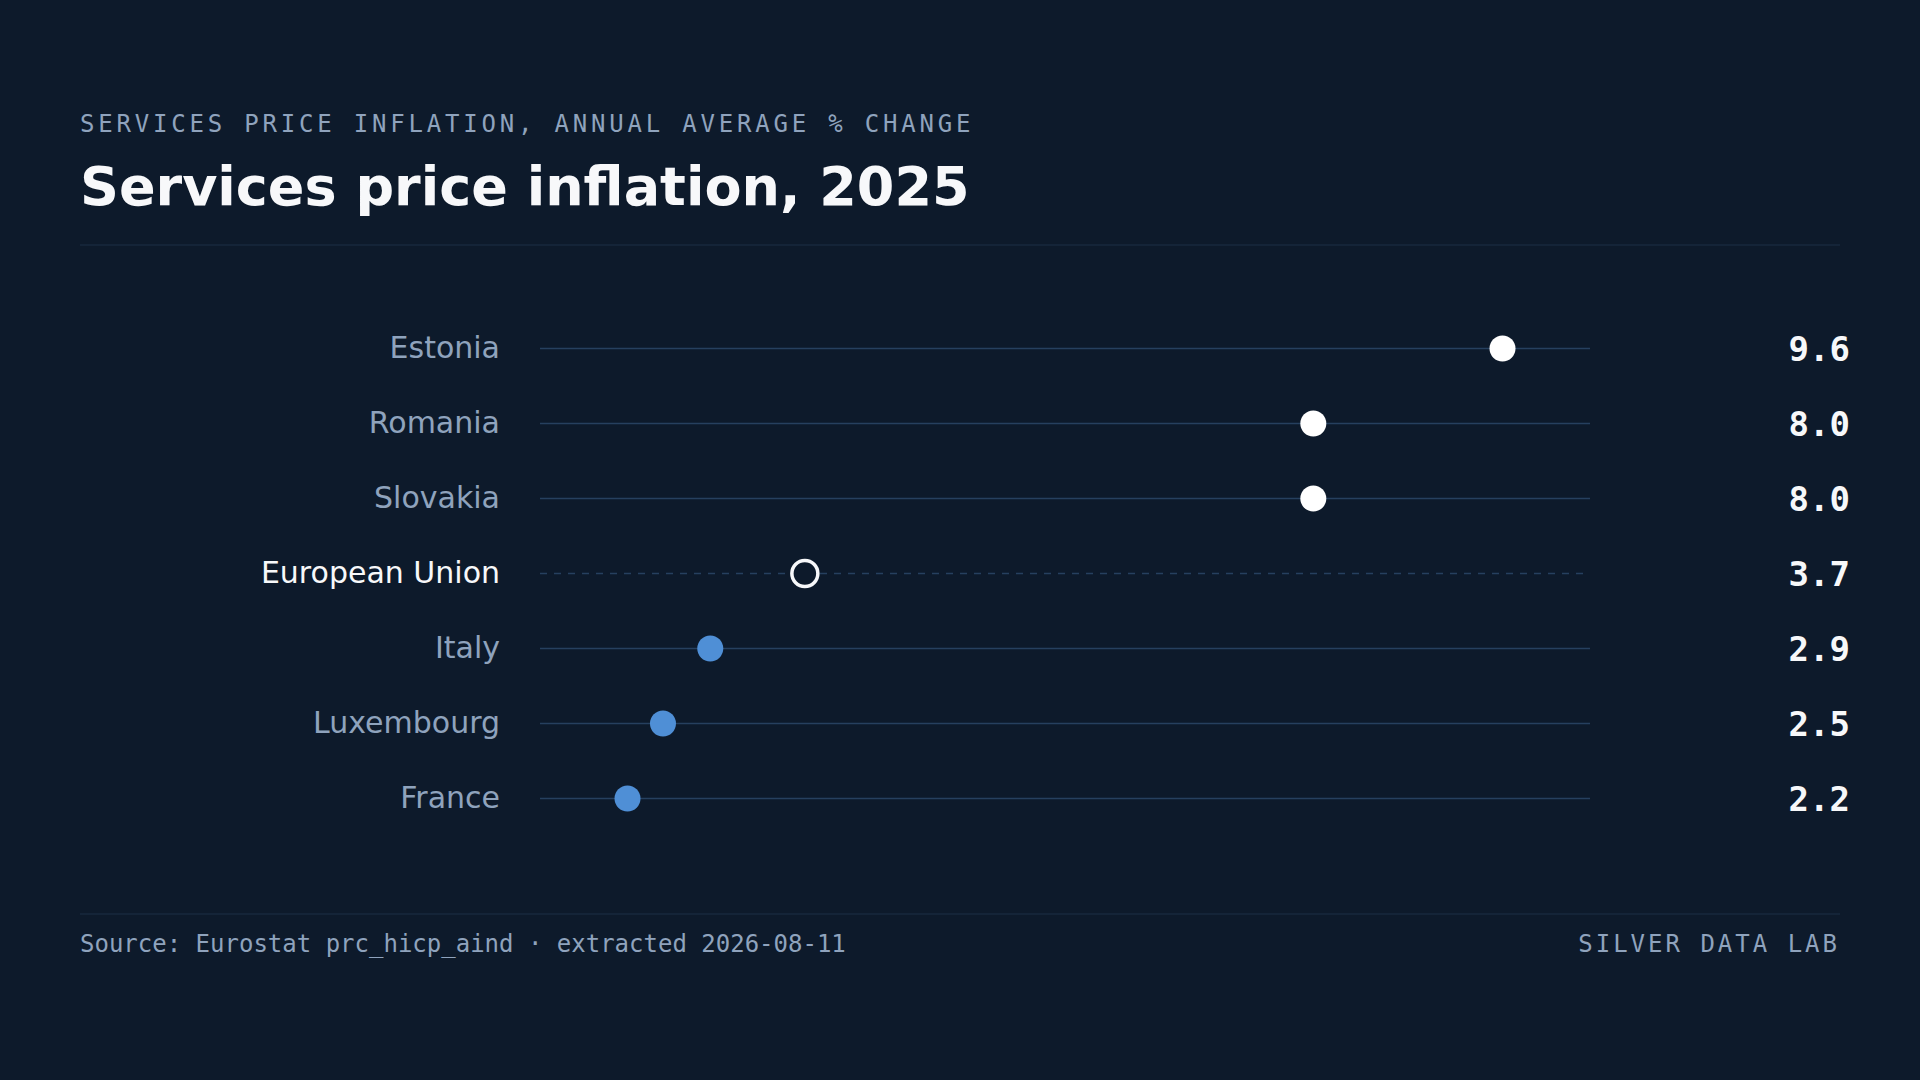
In One Year, EU Services Prices Rose While Energy Prices Fell
Services prices in the EU rose 3.7% in 2025, against 2.8% for food and -0.6% for energy.
Studies where the same country leads or trails
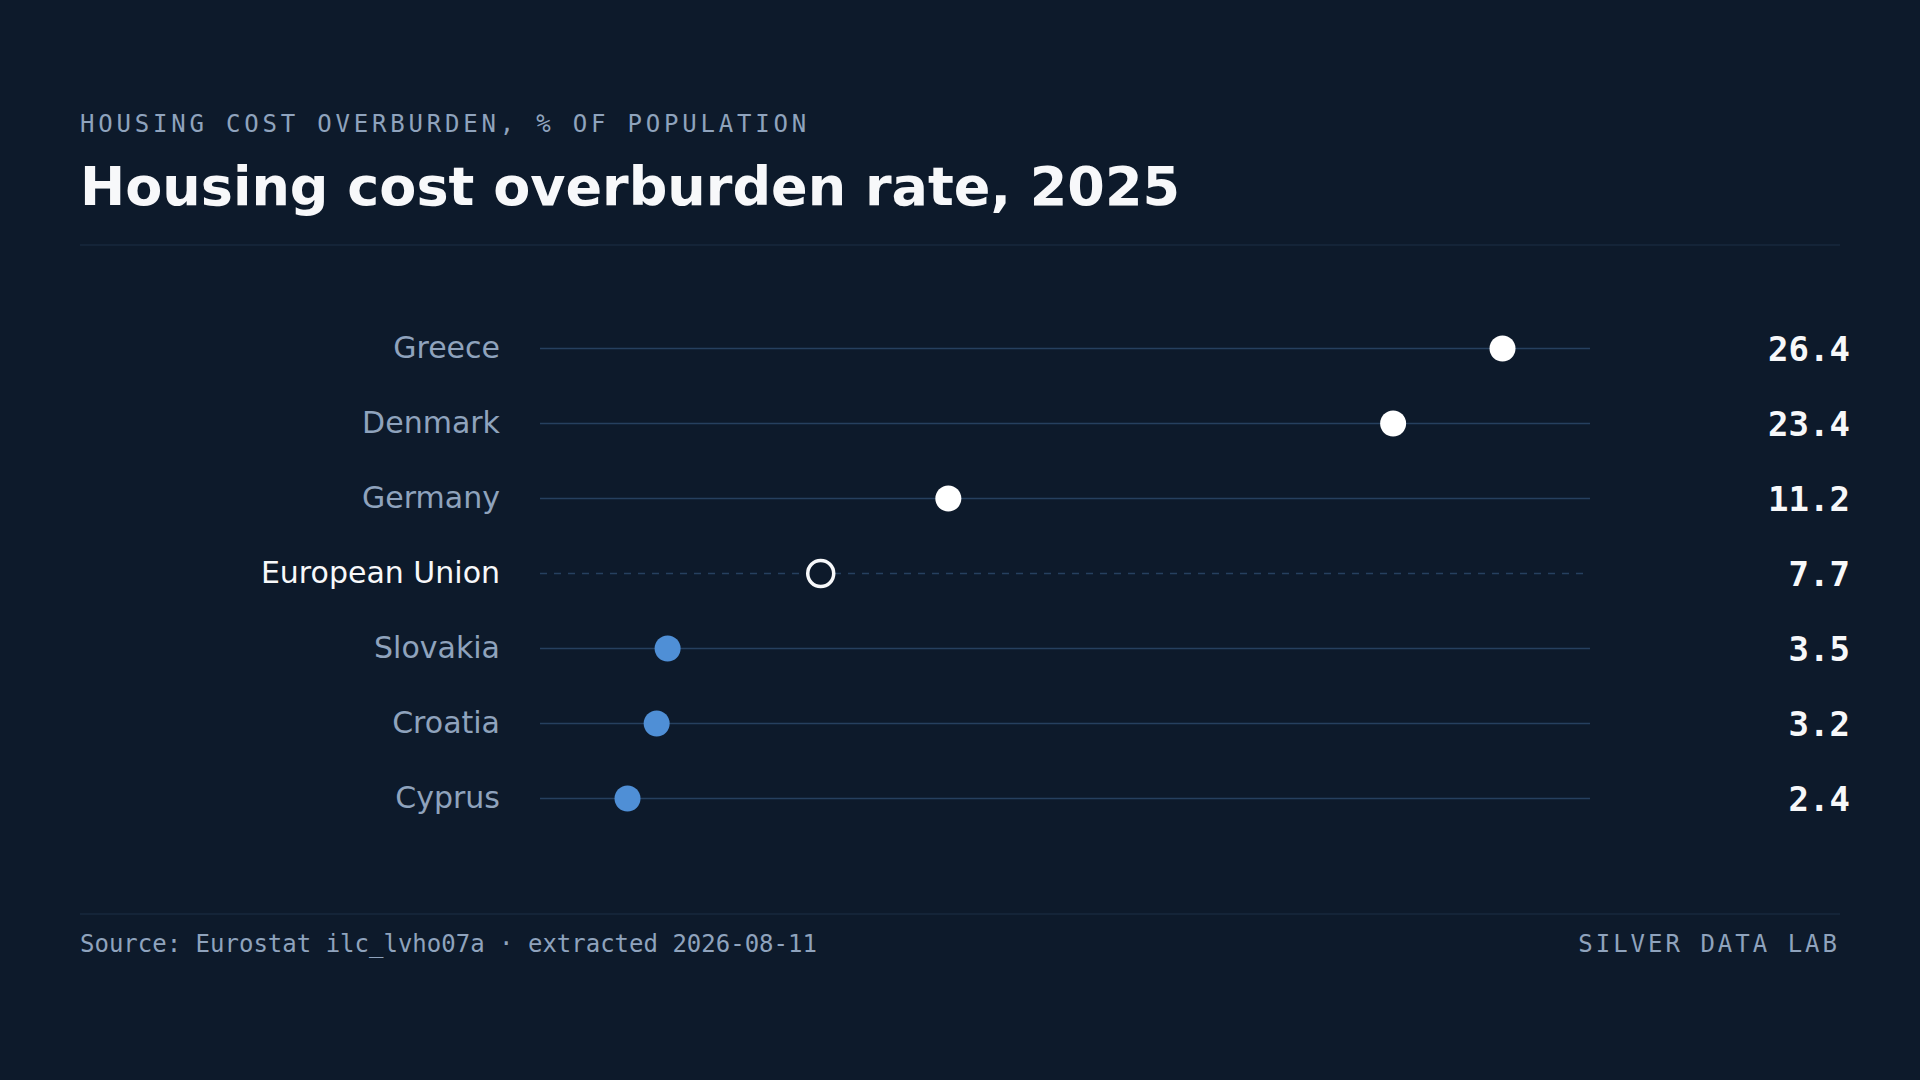
A Quarter of Greeks Spend More Than 40% of Income on Housing
7.7% of the EU population spent more than 40% of disposable income on housing in 2025.
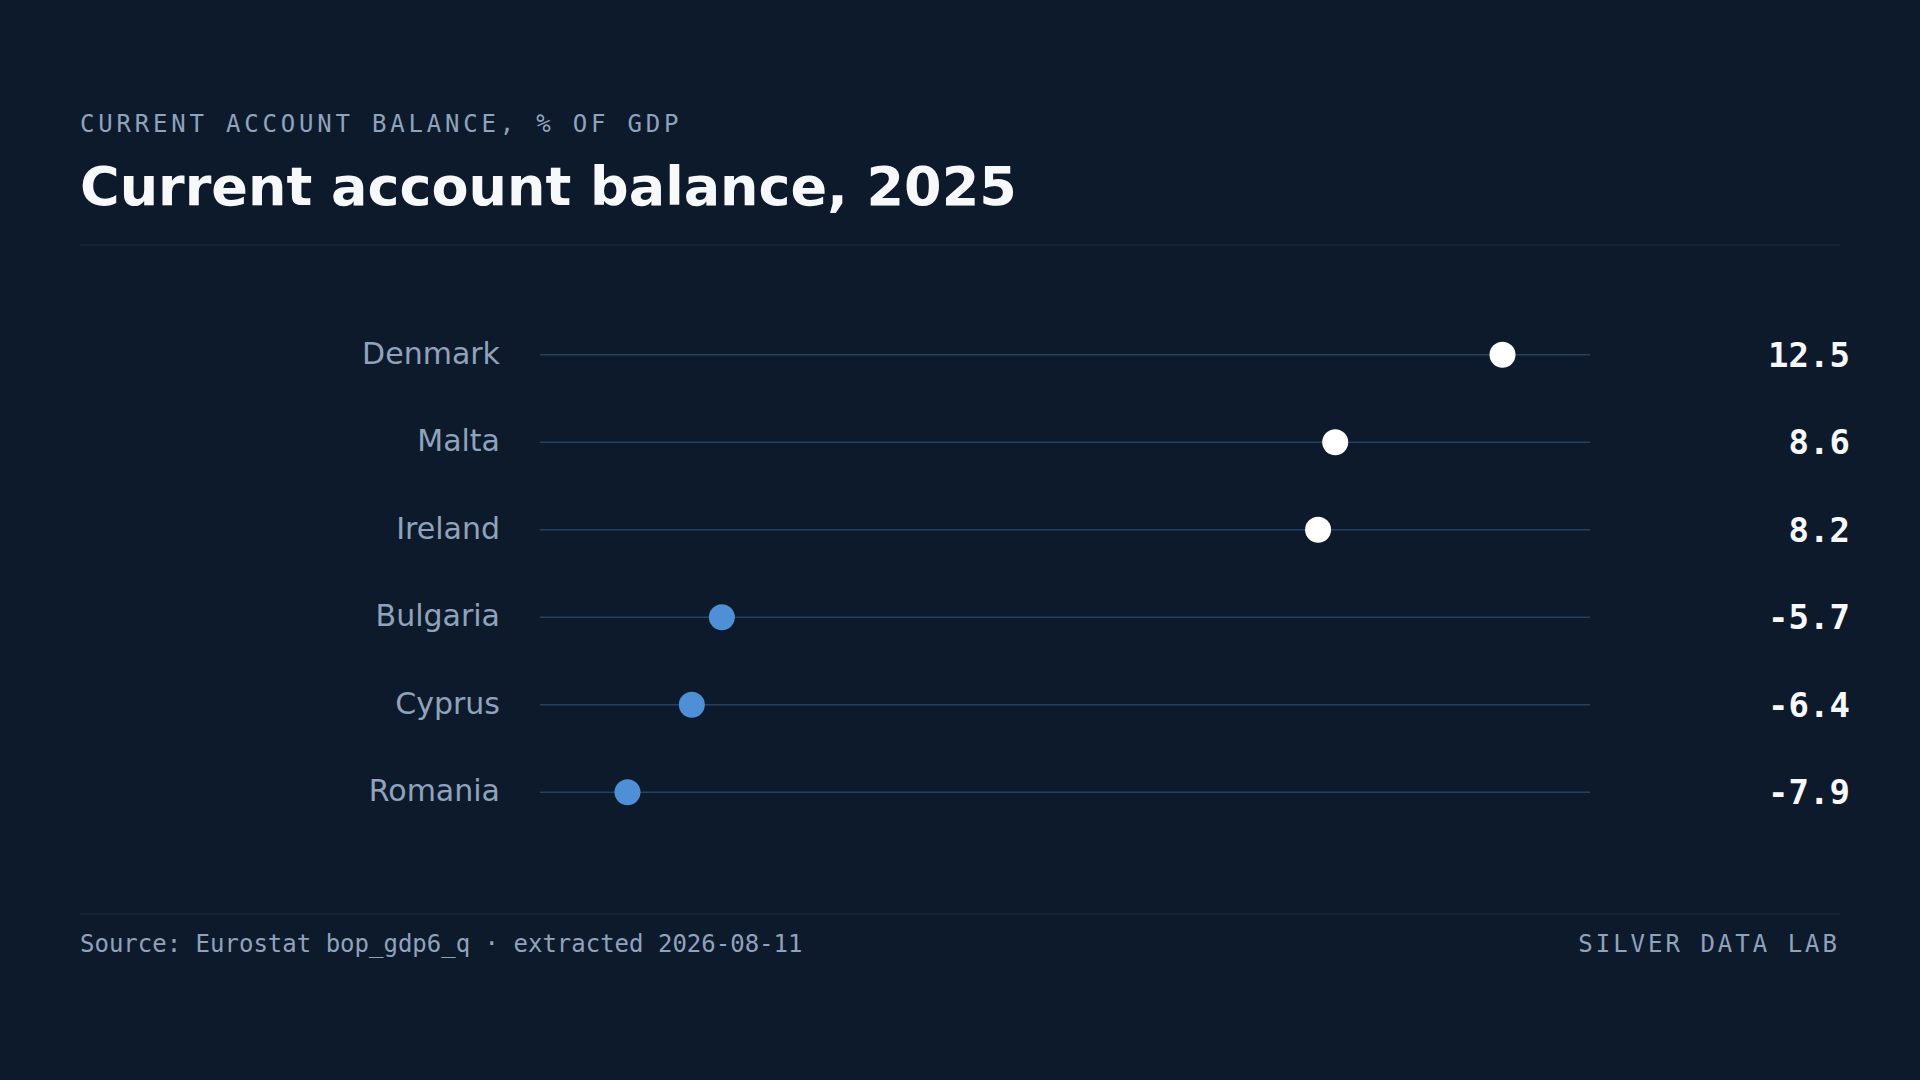
Denmark Has the EU's Biggest Surplus With the World, at 12.3% of GDP
Denmark ran a current account surplus worth 12.3% of GDP in 2025, the largest in the Union.
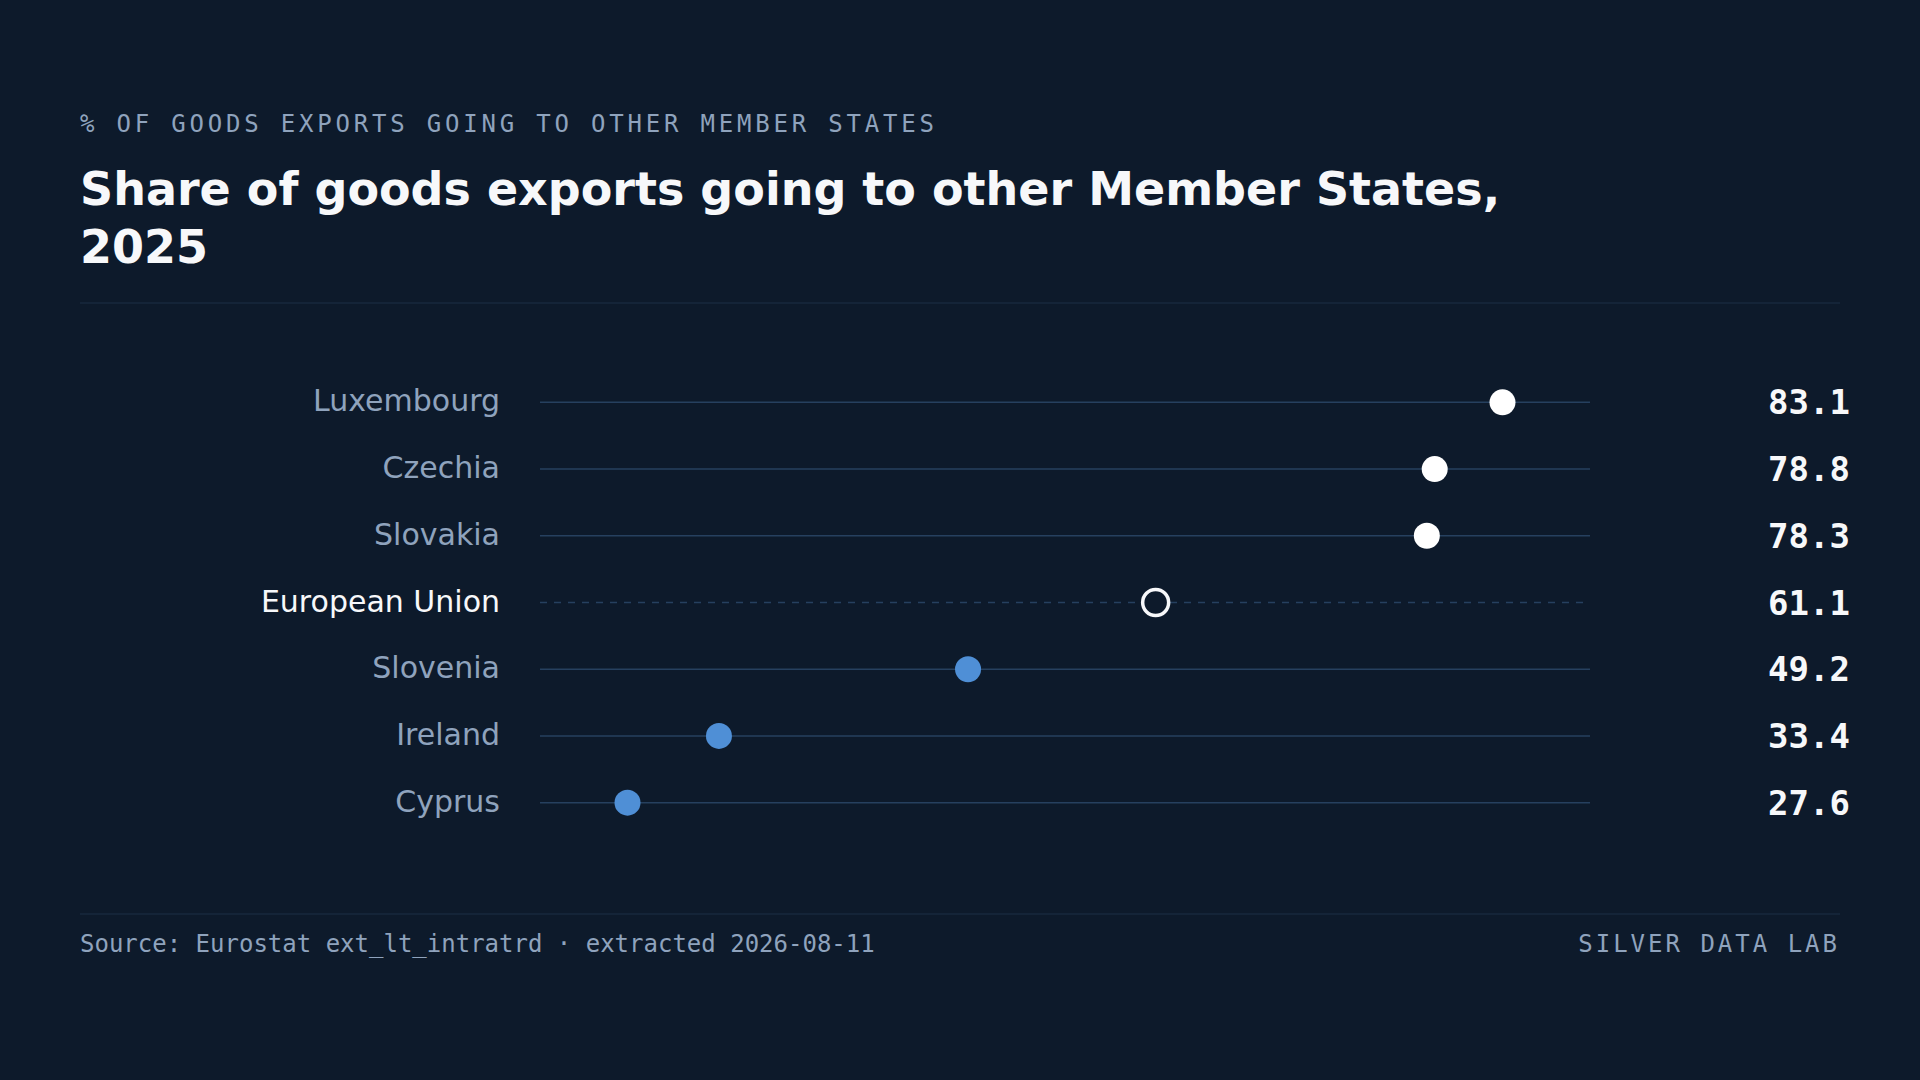
EU Countries Sell 61.1% of Their Goods Exports to Each Other
61.1% of the goods exported by EU Member States in 2025 went to other Member States.