In Greece, 85.3% of Working Non-EU Citizens With a Degree Are Overqualified
Silver Data Lab Research Desk · Statistical analysis · Published on 03 July 2026
This study is open to members only
Its sources, filters and extraction date are declared above, as they are for every study. Sign in to read the analysis in full.
- Data source
- Eurostat
- Reference period
- 2025
- Last updated
- 11 October 2026
Re-checked against the source on 11 September 2026. No value in its datasets has moved between the snapshots we hold. Every revision we have observed →
Key estimates
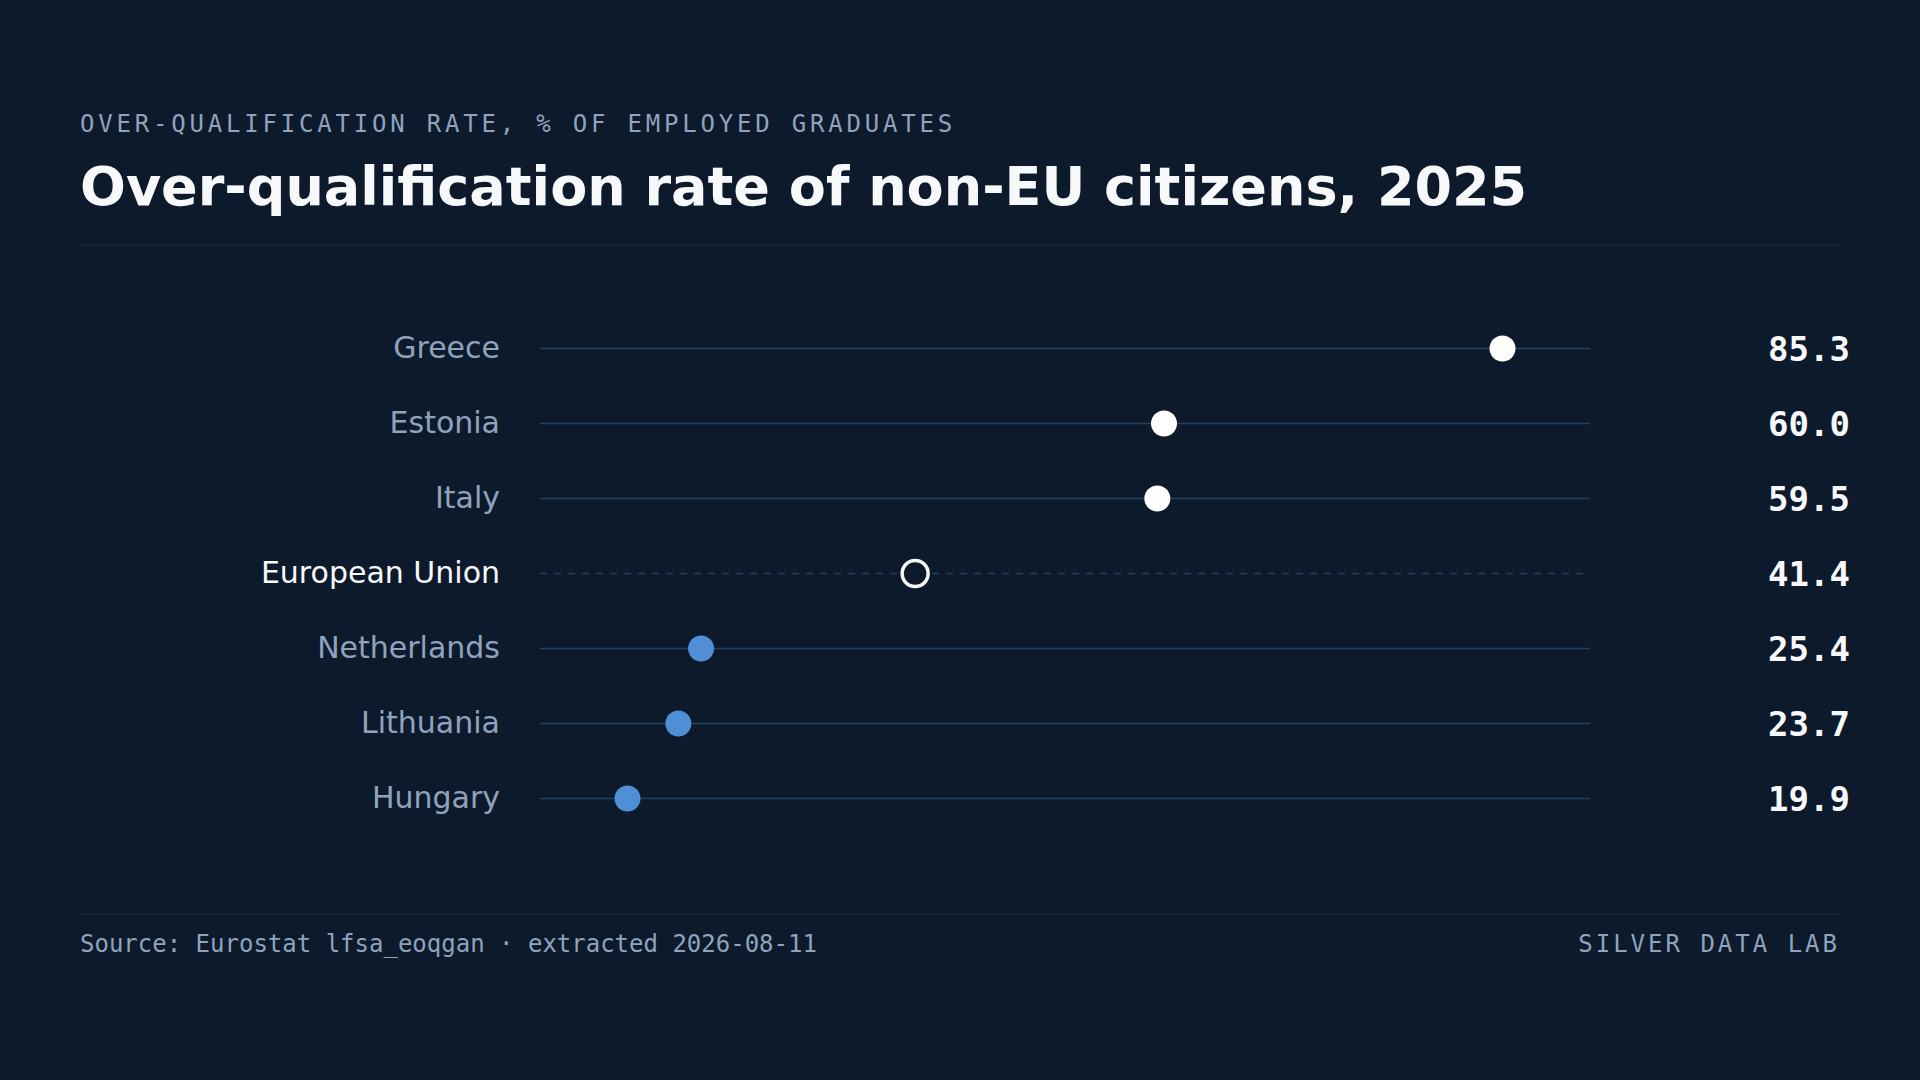
- 41.4% of employed non-EU citizens with tertiary education in the EU worked in jobs below their qualification level in 2025, against 20.0% of nationals.
- Greece records 85.3% — five in six employed non-EU graduates.
- Estonia records 60.0%, Italy 59.5%, Spain 52.3% and Portugal 52.3%.
- Hungary at 19.9% and Lithuania at 23.7% are the only Member States below 25%.
- This is a measure of employed people, so it counts skills wasted rather than skills unused.
A different failure from unemployment
Over-qualification counts people who hold a tertiary qualification and work in a job classified as not requiring one. It is measured only among those in work, which makes it a distinct question from whether migrants find employment at all.
A country can have migrants in work and still be wasting what they know.
Across the EU in 2025, 41.4% of employed non-EU citizens with a degree were over-qualified, against 20.0% of nationals. Two in five, against one in five.
Greece
Greece records 85.3%. Of employed non-EU citizens holding a tertiary qualification, roughly five in six work in jobs that do not require one.
Against a Greek national rate of 31.2% — itself high — the gap is 54.1 percentage points, by far the largest on any indicator in this category.
Greece also has the narrowest unemployment gap in the Union, at effectively zero. The two findings sit together and neither cancels the other: non-EU citizens in Greece find work at about the same rate as Greeks, and the work they find bears almost no relation to their qualifications.
That combination is the strongest argument available for why employment rates alone are an inadequate measure of integration. On the unemployment ranking Greece looks like the Union's success story. On this one it is its clearest failure.
Southern Europe, and the Baltic exception
Italy records 59.5%, Spain 52.3% and Portugal 52.3%. Estonia at 60.0% is the entry that does not fit the southern pattern.
The southern European figures are consistent with labour markets in which non-EU citizens are concentrated in agriculture, domestic work, tourism and construction — sectors that absorb workers readily and recognise qualifications rarely.
Estonia's position rests on a different history: a large Russian-speaking population whose qualifications were obtained under a different system and whose access to professional employment is affected by language requirements.
Where it is lowest
Hungary records 19.9%, Lithuania 23.7% and the Netherlands 25.4%. Sweden records 29.9%.
Hungary and Lithuania are the same Member States that showed small or reversed gaps on poverty, and for the same reason: small non-EU populations recruited into specific jobs, often with qualifications assessed before arrival. Selection at the point of entry produces a better match than integration after it.
The Netherlands at 25.4% is the more interesting case, because it has one of the widest poverty gaps in the Union and one of its narrowest over-qualification gaps. Dutch non-EU residents who are employed and hold degrees are comparatively well matched to their work; the population as a whole is comparatively badly off. Those are compatible, and they point to a divide within the migrant population rather than a uniform position.
What this measures
Over-qualification is recorded by comparing a person's education level with the classification of their occupation. It does not assess whether an individual's specific qualification is recognised, whether they speak the working language, or whether they would prefer a different job.
It is therefore a measure of allocation rather than of ability or preference, and it detects one thing well: an economy in which people arrive with credentials that its labour market does not use.
Over-qualification rate of non-EU citizens, 2025
| Country | % of employed graduates | Gap to EU averagepercentage points, derived |
|---|---|---|
| Greece | 85.3 | +43.9 |
| Estonia | 60.0 | +18.6 |
| Italy | 59.5 | +18.1 |
| European Unionaggregate | 41.4 | — |
| Netherlands | 25.4 | −16.0 |
| Lithuania | 23.7 | −17.7 |
| Hungary | 19.9u | −21.5 |
Flags carried by the source on these values: u low reliability
This table as data: CSV · JSON
Every Member State for this indicator+
Members see every Member State for this indicator here, not only the rows the ranking prints. Become a Member
What these figures cannot tell you
- Seven Member States are missing
- Bulgaria, Denmark, Croatia, Luxembourg, Malta, Romania and Slovakia have no published non-EU rate for 2025, generally because the relevant population is too small for reliable survey estimation. The ranking covers twenty Member States.
- Occupation classification is coarse
- Over-qualification is inferred by matching education level against the skill level of an occupation group. It cannot tell whether a specific degree is relevant to a specific job, and it treats all tertiary qualifications alike.
- Employed people only
- The rate is calculated among those in work. A country where qualified migrants cannot find work at all can record a low over-qualification rate for that reason, so this indicator must be read alongside the employment and unemployment measures.
- The Hungarian figure is flagged as unreliable
- Eurostat marks the Hungarian rate as having low reliability, and the Slovenian one too. It is the same flag that withholds the value altogether in five of the seven Member States missing from this ranking, and Hungary is the lowest row in the table. The Spanish and French rates carry a different mark, for a definition that departs from the standard one. None of the four is excluded here, because the source publishes them; the flags travel with them instead.
- Recognition of foreign qualifications is not observed
- Whether a qualification obtained abroad is formally recognised is a major determinant of the outcome measured here, and it is not a variable in this dataset.
Frequently asked questions
- What share of migrant graduates work below their qualification?
- 41.4% of employed non-EU citizens with tertiary education in the EU were over-qualified for their job in 2025, against 20.0% of nationals.
- Which EU country wastes migrant skills the most?
- Greece, where 85.3% of employed non-EU graduates work in jobs not requiring a degree — five in six. The gap against Greek nationals is 54.1 percentage points, the widest on any indicator in this category.
- How can Greece have no migrant unemployment gap and the worst over-qualification?
- Because they measure different failures. Non-EU citizens in Greece find work at about the same rate as Greek nationals, and the work they find largely does not use their qualifications. Employment rates alone are not a sufficient measure of integration, and Greece is the clearest demonstration.
- Where are migrant qualifications used best?
- Hungary at 19.9%, Lithuania at 23.7% and the Netherlands at 25.4%. In Hungary and Lithuania this largely reflects small migrant populations recruited into specific jobs with qualifications assessed before arrival, rather than integration after it.
Methodological note
Over-qualification rates by citizenship are published by Eurostat from the EU labour force survey, defined as the share of employed persons with tertiary education working in occupations classified below tertiary skill level. This study uses the population aged 20 to 64, both sexes, for nationals and for citizens of countries outside the EU.
Values are for 2025. Seven Member States have no published non-EU rate for that year and are excluded from the ranking; the EU aggregate is as published.
Eurostat's observation flags are read from the same extraction: the Hungarian and Slovenian rates are marked as having low reliability, and the Spanish and French ones as departing from the standard definition.
The gaps between the two rates are computed by Silver Data Lab by subtracting one published series from the other and are labelled as derived. The comparison with unemployment by citizenship draws on the companion study in this category.
Source data
The underlying series can be inspected and re-downloaded from the Eurostat data browser. The filters below are the ones applied.
Over-qualification rates by citizenship
lfsa_eoqgan
- Filters applied:
- freq=A · citizen=NAT, NEU27_2020_FOR · age=Y20-64 · sex=T · unit=PC · time=2025
- Extracted:
- 2026-09-11
- Source last updated:
- 2026-09-10
Download the data
The data the study you have just read is built on, exactly as it was downloaded and archived.
Yours as a Member.
Data downloadable by Members
How to cite
Record the vintage as well as the study: the figures on this page are the ones extracted on the dates below.
Silver Data Lab Research Desk (2026). In Greece, 85.3% of Working Non-EU Citizens With a Degree Are Overqualified. Silver Data Lab, published 03 July 2026, last updated 11 October 2026. https://www.silverdatalab.com/studies/migrant-over-qualification-in-the-eu
- Data: Eurostat, Over-qualification rates by citizenship (lfsa_eoqgan), filters freq=A, citizen=NAT, NEU27_2020_FOR, age=Y20-64, sex=T, unit=PC, time=2025; extracted 2026-09-11; source last updated 2026-09-10. https://doi.org/10.2908/lfsa_eoqgan
Silver Data Lab's analysis is licensed CC BY 4.0. The statistics remain their publisher's and keep its terms of reuse.
Ask the research desk
A question about this study — a definition, a filter, a break in the series, what the figures can and cannot support — answered by the desk that made the extraction.
Members can write to the research desk
Studies where the same country leads or trails
45.9% Fewer Children Sought Asylum Alone in the EU Than a Year Earlier
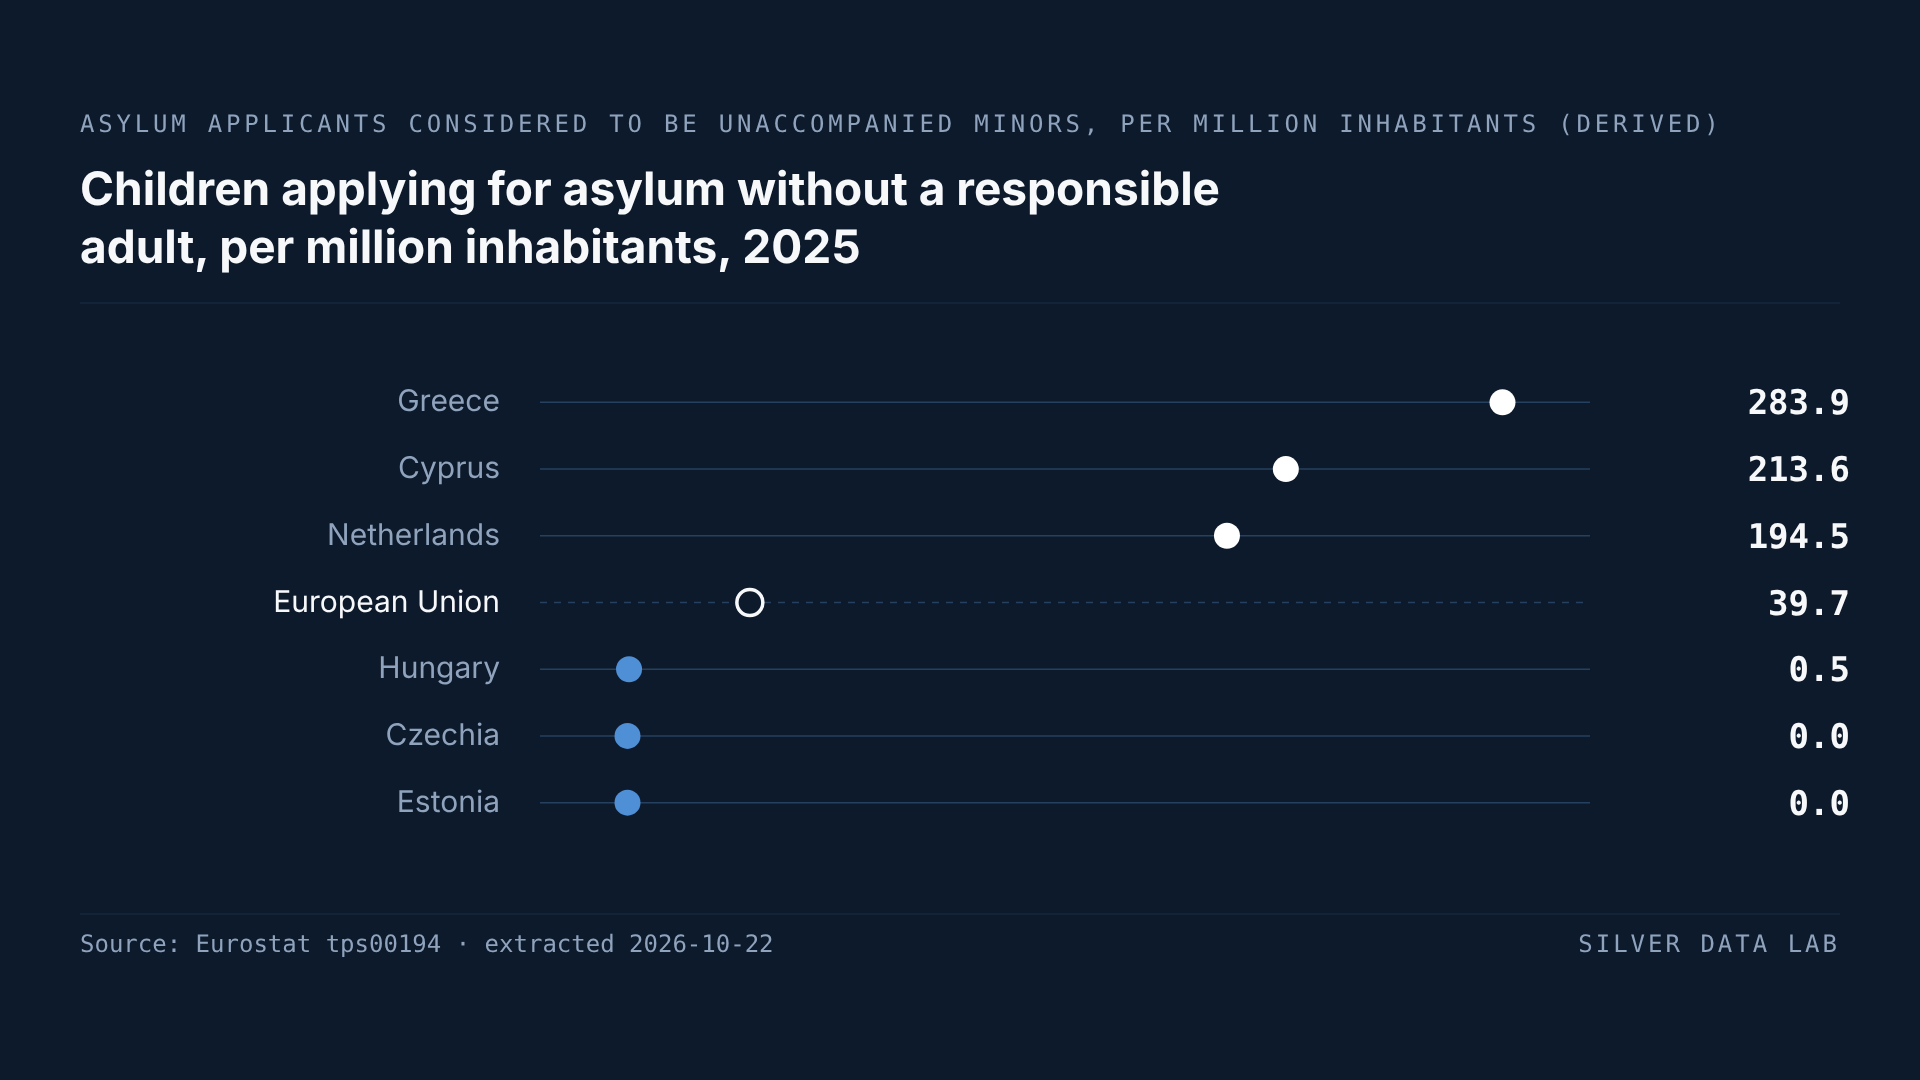
In 2025, 17,930 children applied for asylum in the EU without a parent or another adult responsible for them, against 33,160 in 2024: a derived fall of 45.9%, to the lowest figure since 2020.
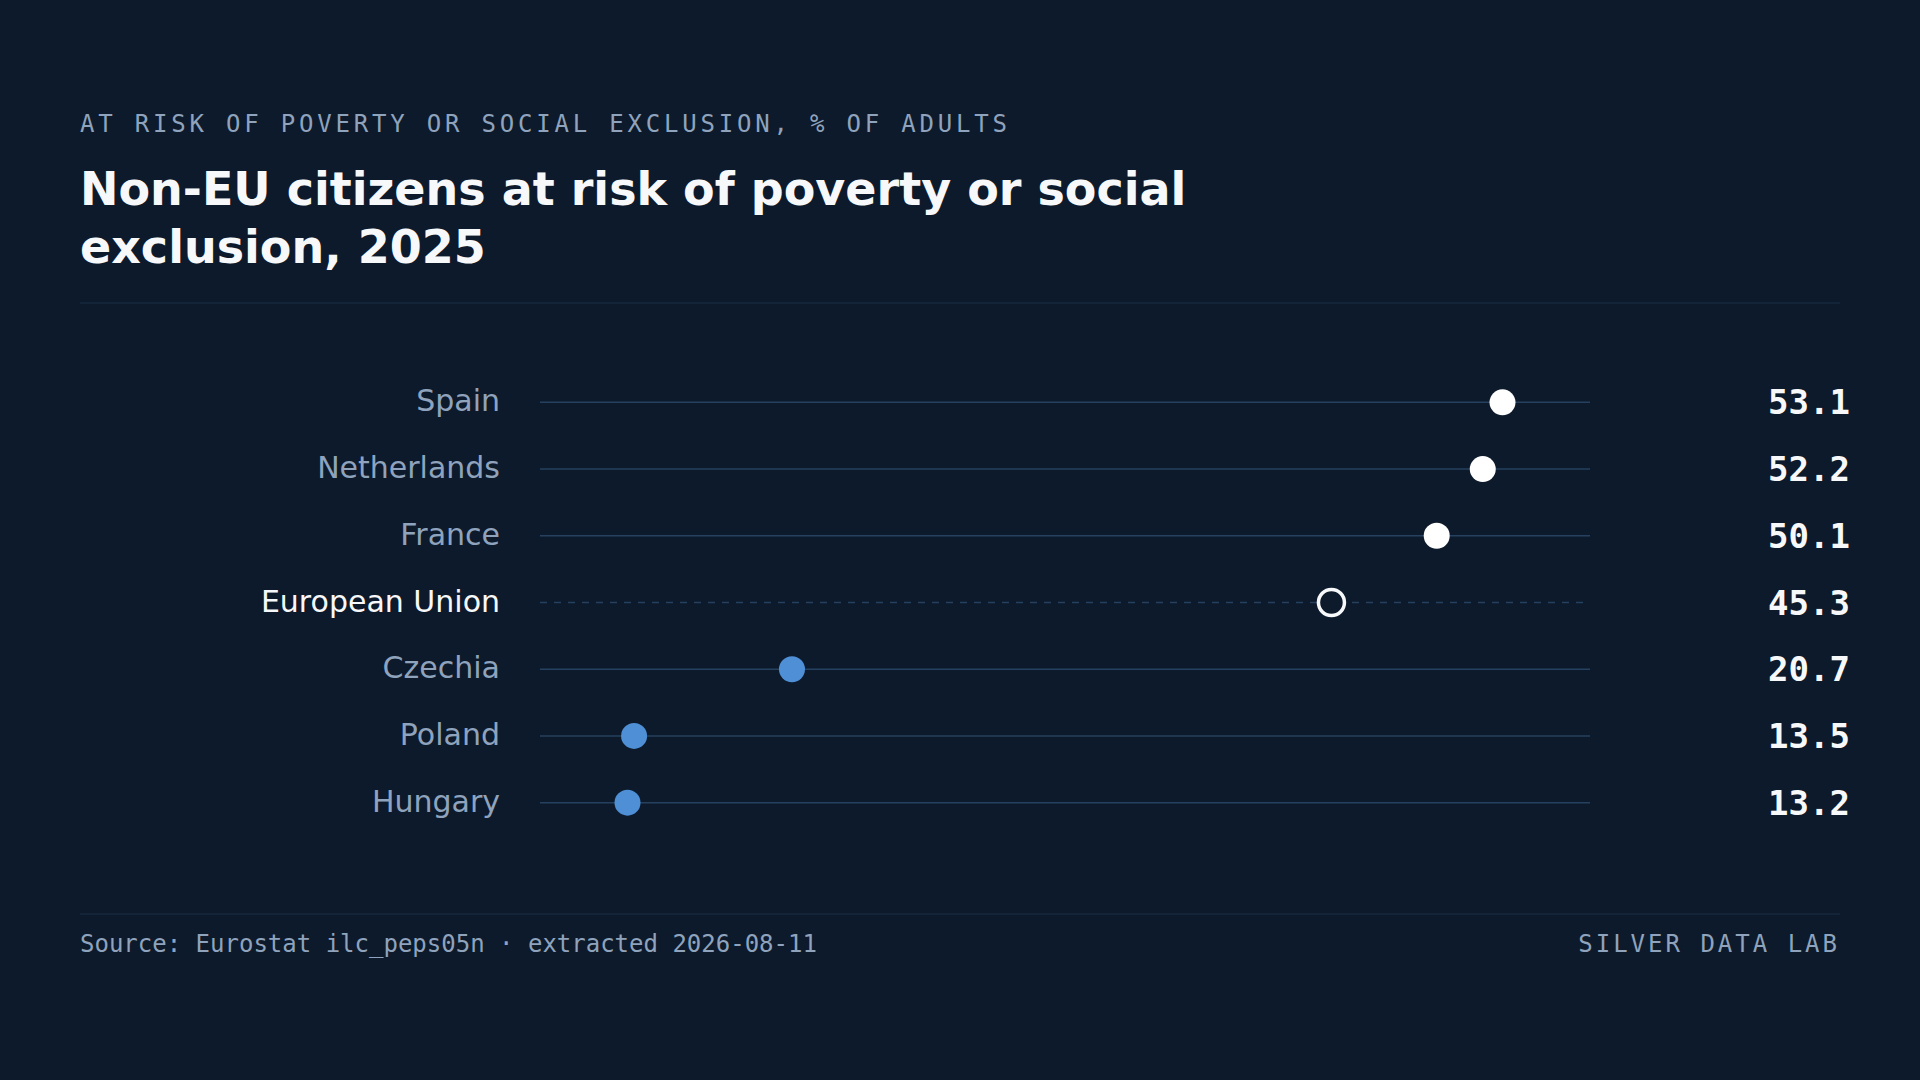
52.2% of Adult Non-EU Citizens in the Netherlands Risk Poverty or Exclusion
45.3% of non-EU citizens aged 18 and over in the EU were at risk of poverty or social exclusion in 2025, against 18.2% of nationals.
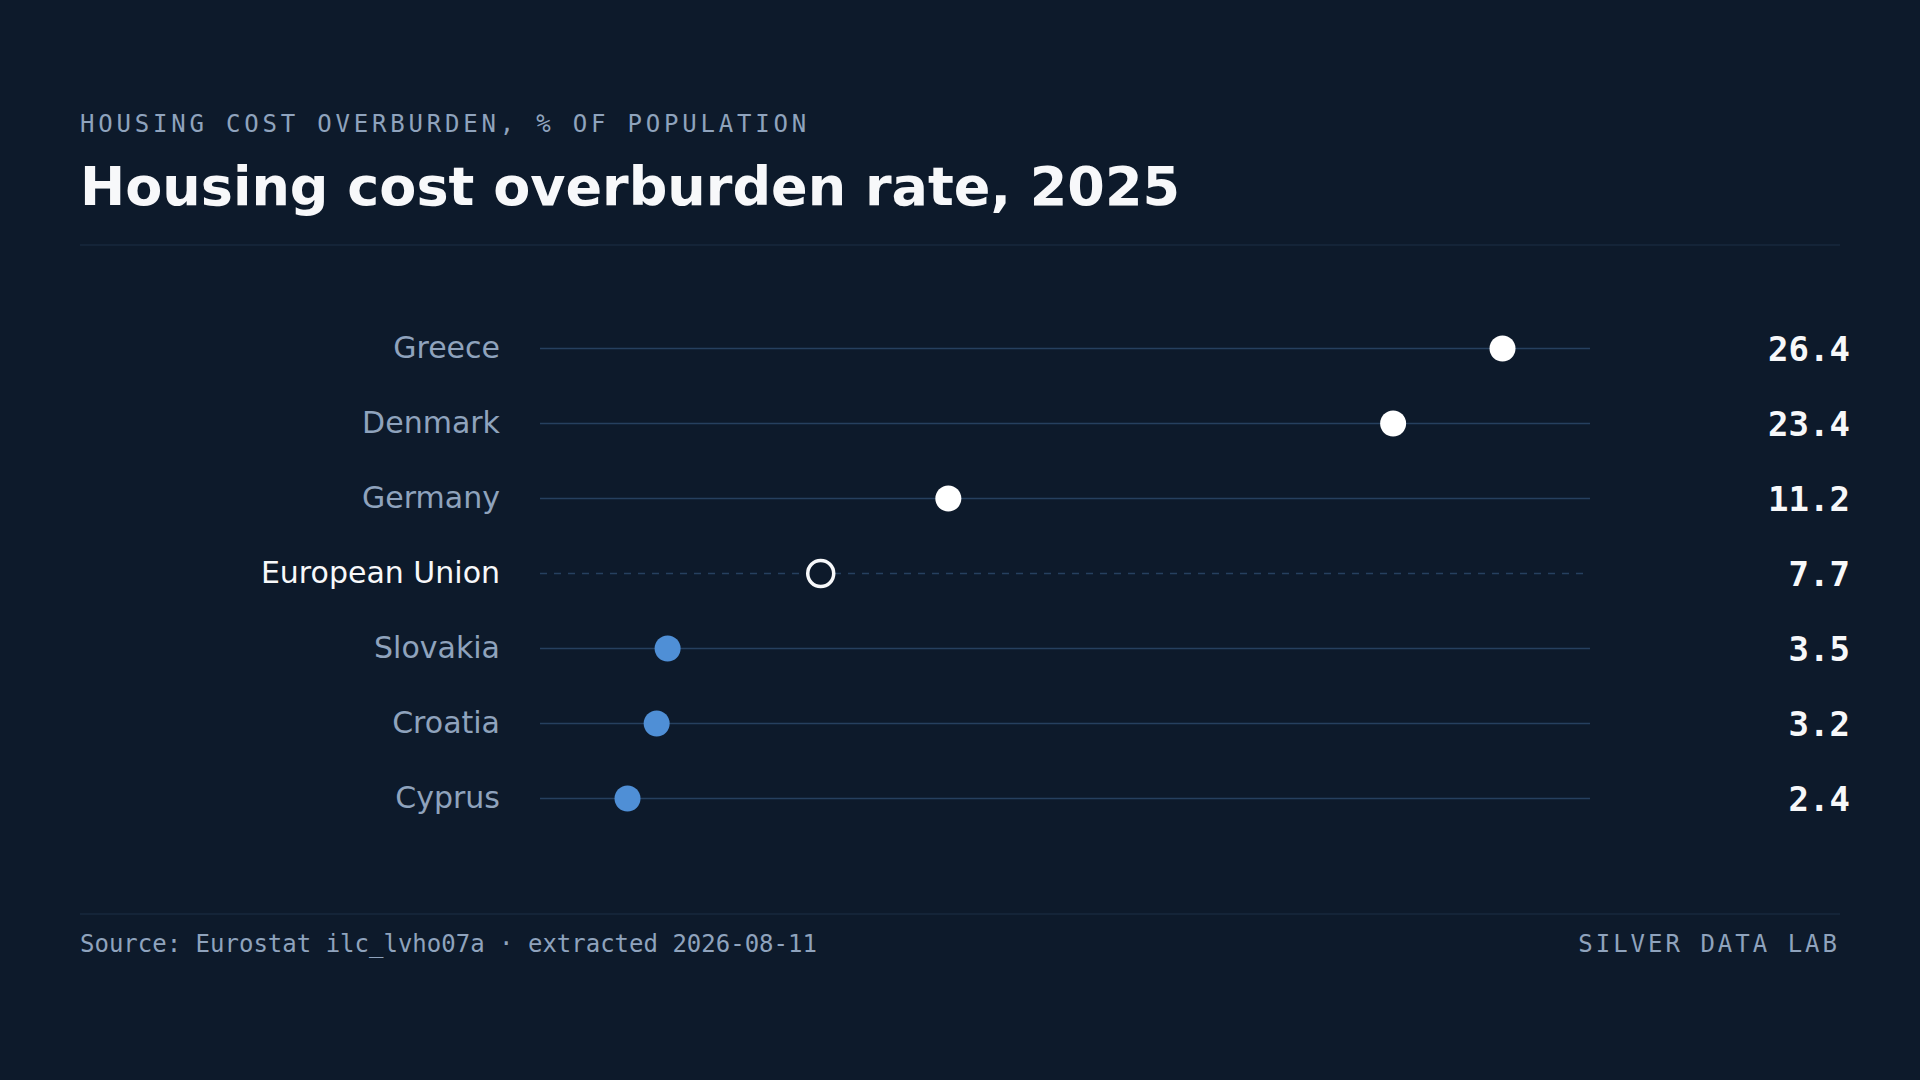
A Quarter of Greeks Spend More Than 40% of Income on Housing
7.7% of the EU population spent more than 40% of disposable income on housing in 2025.