The Amount of Money in the Euro Area Fell by a Record 1.3% in a Year
Silver Data Lab Research Desk · Statistical analysis · Published on 31 July 2026
This study is open to members only
Its sources, filters and extraction date are declared above, as they are for every study. Sign in to read the analysis in full.
- Data source
- European Central Bank
- Reference period
- August 2026
- Last updated
- 11 October 2026
Re-checked against the source on 26 September 2026. No value in its datasets has moved between the snapshots we hold. Every revision we have observed →
Key estimates
- M3, the broadest measure of euro area money, contracted 1.27% in the year to August 2023 — the deepest fall in a series that starts in 1981.
- It is the second contraction on record. The first was in 2009 and 2010, and the deepest month then was −0.40%, less than a third as steep.
- The fastest expansion was 12.56% in November 2007, months before the financial crisis.
- January 2021 came within 0.07 points of it, at 12.49%, during the pandemic asset purchase programmes.
- Growth stood at 3.49% in August 2026, back inside the range the aggregate occupied through the 2010s.
What M3 counts
M3 is the broadest of the ECB's monetary aggregates: cash in circulation, overnight deposits, deposits with a maturity up to two years or redeemable at up to three months' notice, and short-term marketable instruments such as money market fund shares and repurchase agreements.
Its annual growth rate is the measure below, published monthly since 1981.
The 2023 contraction
In the year to August 2023, M3 fell 1.27%. Euro area money supply was smaller than it had been twelve months earlier.
That is the deepest contraction in the whole published series, and it lasted five consecutive months, from July to November 2023.
It is not, however, unprecedented. M3 also contracted in the aftermath of the financial crisis: six negative months across 2009 and 2010, though not consecutively. They fall in two spells, November to December 2009 and February to May 2010, with a fractionally positive January between them. The deepest month then was −0.40%, in February 2010 — less than a third of the 2023 fall.
The two expansions
The series rises above 12% in two episodes, five months in all.
The first is November 2007 at 12.56%, the fastest expansion on record, arriving in the months before the financial crisis broke.
The second is January 2021 at 12.49%, during the pandemic, with December 2020 and February 2021 just below it. The ECB's asset purchases and the credit guarantees issued across the union expanded the aggregate at a rate matched only once in forty-five years.
The two peaks are 0.07 percentage points apart and different in origin: one accumulated over several years of credit growth, the other appeared within months of a policy decision.
Where it stands now
Growth was 3.49% in August 2026.
That figure sits inside the range M3 occupied for most of the 2010s, when annual growth ran between roughly 1% and 5%. Measured by this aggregate, the monetary contraction that accompanied the tightening cycle has been reversed, and the quantity of money in the euro area is growing at a rate the currency has seen for most of its existence.
What a monetary aggregate does not tell you
M3 counts money, not what it does. The same rate of growth is consistent with lending expanding or contracting, with prices rising or stable, and with the aggregate concentrated in a few countries or spread across all of them.
The series is also an aggregate for the currency union as a whole, published only for the euro area. Nothing here describes any individual member state, and the composition of the euro area itself has changed over the period, most recently with Bulgaria's entry on 1 January 2026.
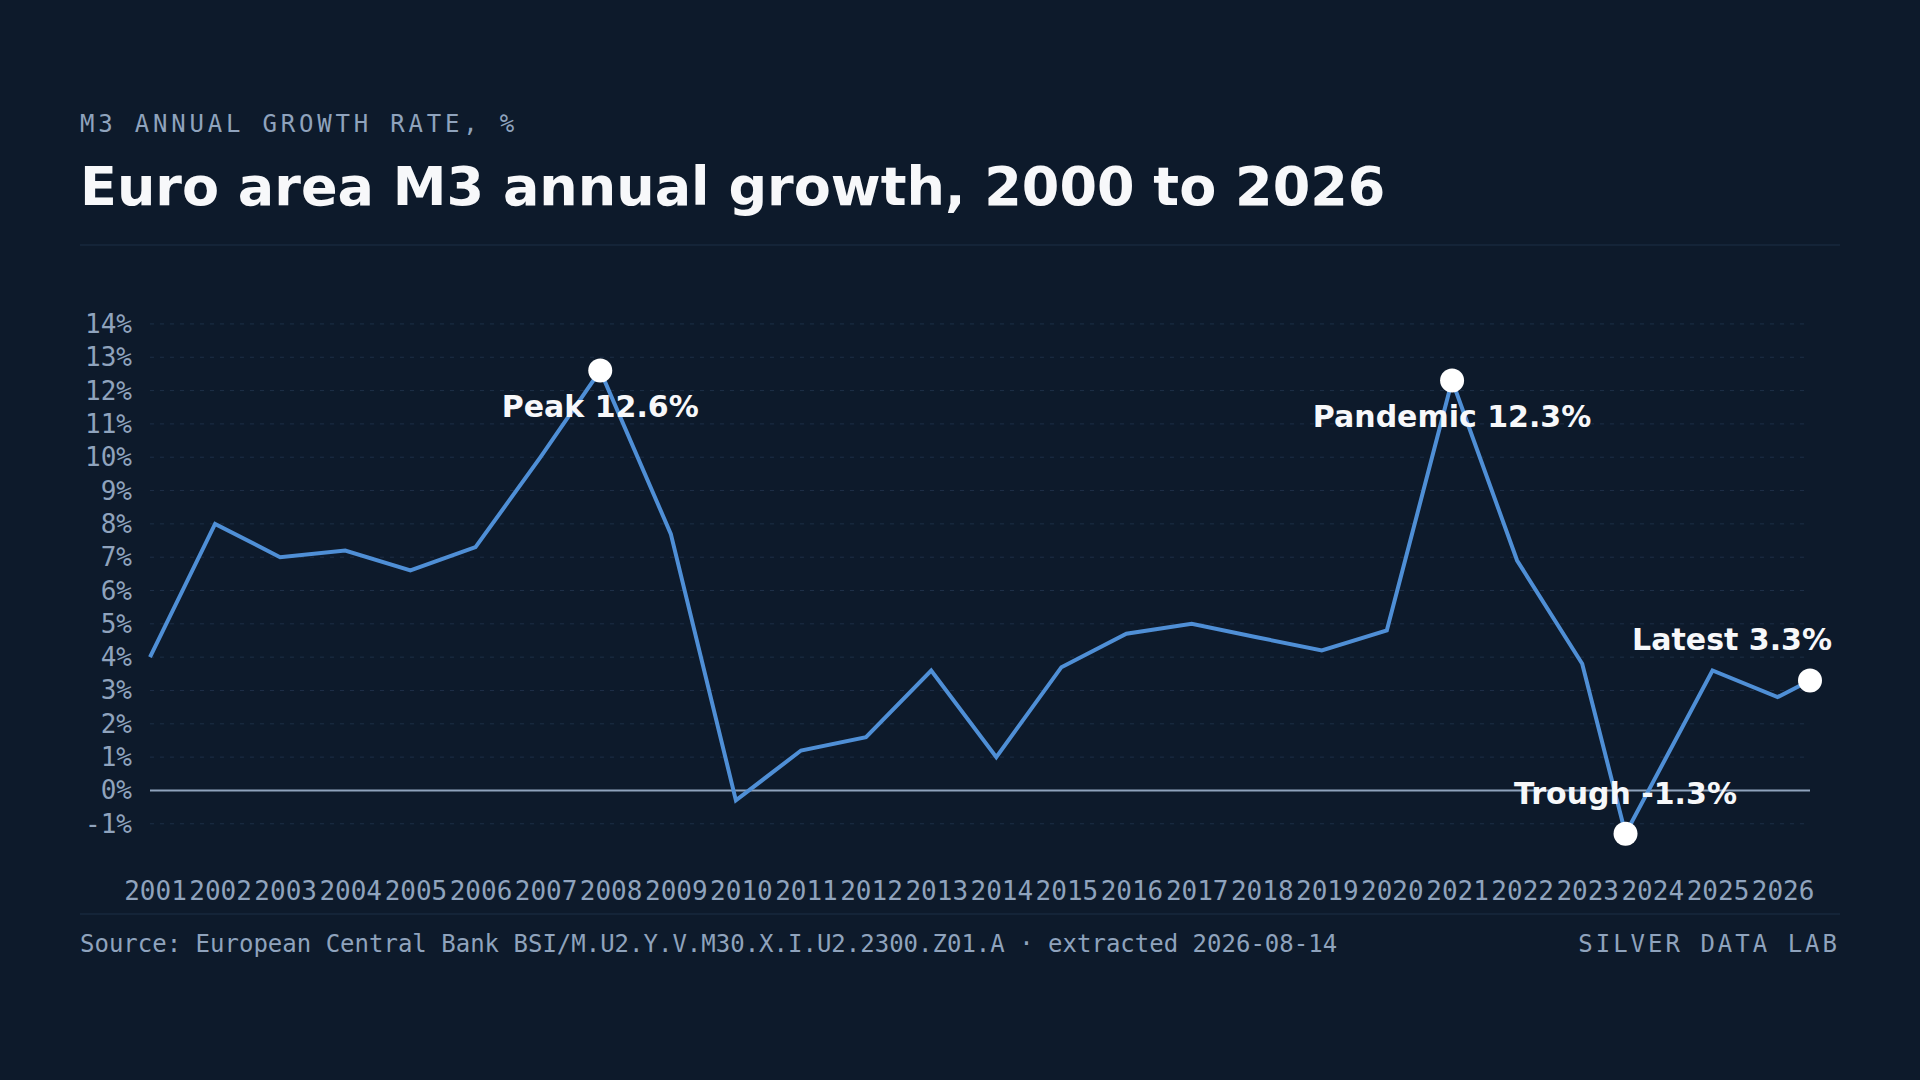
Euro area M3 annual growth, 2000 to 2026
One value a year from 2000: each December, except that the November 2007 peak, the August 2023 trough and the latest month stand in place of their own year's December.
- Peak 12.6% · 2007-11-01
- Pandemic 12.3% · 2020-12-01
- Trough -1.3% · 2023-08-01
- Latest 3.5% · 2026-08-01
What these figures cannot tell you
- The euro area composition changes
- The series is published for the euro area as it stands in each period, which has grown from eleven countries in 1999 to twenty-one with Bulgaria's entry on 1 January 2026. Pre-1999 values are constructed from the national aggregates of the founding members.
- A quantity, not an effect
- M3 measures how much money exists. It does not measure lending, inflation or economic activity, and no relationship with them is asserted here.
- Chart points are year-end, or the year's turning point
- The figure plots one value a year from 2000: December, except where the November 2007 peak, the August 2023 trough or the latest month stands in place of its own year's December. December 2007 and December 2023 are therefore not in the figure, and the 2023 point is the trough rather than the year-end. Intermediate months are not drawn, so the line understates month-to-month variation.
- Definitional revisions
- The instruments counted in M3 have been revised over the four and a half decades the series covers. Values from different eras are not strictly like-for-like.
Frequently asked questions
- Has the euro area money supply ever shrunk?
- Twice. There were six negative months across 2009 and 2010, in two spells either side of a fractionally positive January, reaching −0.40%; and five consecutive months in 2023, reaching −1.27% in August. The 2023 episode is the deepest in a series that starts in 1981.
- What is M3?
- The broadest ECB monetary aggregate: cash in circulation, overnight deposits, deposits with a maturity up to two years or redeemable at up to three months' notice, and short-term marketable instruments such as money market fund shares and repurchase agreements.
- When did euro area money grow fastest?
- November 2007, at 12.56% year on year, months before the financial crisis. January 2021 came within 0.07 points of it, at 12.49%, during the pandemic asset purchase programmes.
- How fast is the money supply growing now?
- 3.49% in the year to August 2026, inside the range the aggregate occupied through most of the 2010s.
Methodological note
The ECB publishes monetary aggregates through the ECB Data Portal. This study uses the annual growth rate of M3 for the euro area, as published, monthly from January 1981 to August 2026.
The identification of the deepest contraction, the count of contraction episodes and their depths, and the two expansion peaks are derived by Silver Data Lab from the published series by inspecting every one of its 548 observations. The growth rates themselves are published figures, not computed ones.
The chart plots one value a year from 2000 onwards: each December, except that November 2007, August 2023 and August 2026 stand in place of their own year's December, so the turning points named in the text appear in the figure rather than beside it.
Source data
The underlying series can be inspected and re-downloaded from the ECB Data Portal. The filters below are the ones applied.
Monetary aggregate M3, annual growth rate, euro area
BSI/M.U2.Y.V.M30.X.I.U2.2300.Z01.A
- Filters applied:
- freq=M · ref_area=U2 (euro area, changing composition) · bs_item=M30 (M3) · data_type=I (annual growth rate) · counterpart_area=U2 · bs_count_sector=2300 (money-holding sector) · series_denom=Z01
- Extracted:
- 2026-09-26
- Source last updated:
- 2026-08-01
Download the data
The data the study you have just read is built on, exactly as it was downloaded and archived.
Yours as a Member.
Data downloadable by Members
How to cite
Record the vintage as well as the study: the figures on this page are the ones extracted on the dates below.
Silver Data Lab Research Desk (2026). The Amount of Money in the Euro Area Fell by a Record 1.3% in a Year. Silver Data Lab, published 31 July 2026, last updated 11 October 2026. https://www.silverdatalab.com/studies/money-supply-growth-in-the-euro-area
- Data: European Central Bank, Monetary aggregate M3, annual growth rate, euro area (BSI/M.U2.Y.V.M30.X.I.U2.2300.Z01.A), filters freq=M, ref_area=U2 (euro area, changing composition), bs_item=M30 (M3), data_type=I (annual growth rate), counterpart_area=U2, bs_count_sector=2300 (money-holding sector), series_denom=Z01; extracted 2026-09-26; source last updated 2026-08-01. https://data.ecb.europa.eu/data/datasets/BSI
Silver Data Lab's analysis is licensed CC BY 4.0. The statistics remain their publisher's and keep its terms of reuse.
Ask the research desk
A question about this study — a definition, a filter, a break in the series, what the figures can and cannot support — answered by the desk that made the extraction.
Members can write to the research desk