Sweden Gets Four Times as Much of Its Energy From Renewables as Belgium
Silver Data Lab Research Desk · Statistical analysis · Published on 17 July 2026
- Data source
- Eurostat
- Reference period
- 2025
- Last updated
- 11 October 2026
Re-checked against the source on 16 September 2026. No value in its datasets has moved between the snapshots we hold. Every revision we have observed →
Key estimates
- Renewable sources covered 26.2% of the EU's gross final energy consumption in 2025.
- Sweden reaches 65.4%, more than four times Belgium's 14.9% at the bottom of the ranking.
- Six Member States are above 40%: Sweden, Finland, Denmark, Latvia, Austria and Estonia.
- Seven are below 20%, Poland and Belgium among them.
- The top of the ranking is dominated by countries with forests, rivers or wind, which is a fact about endowment as much as about policy.
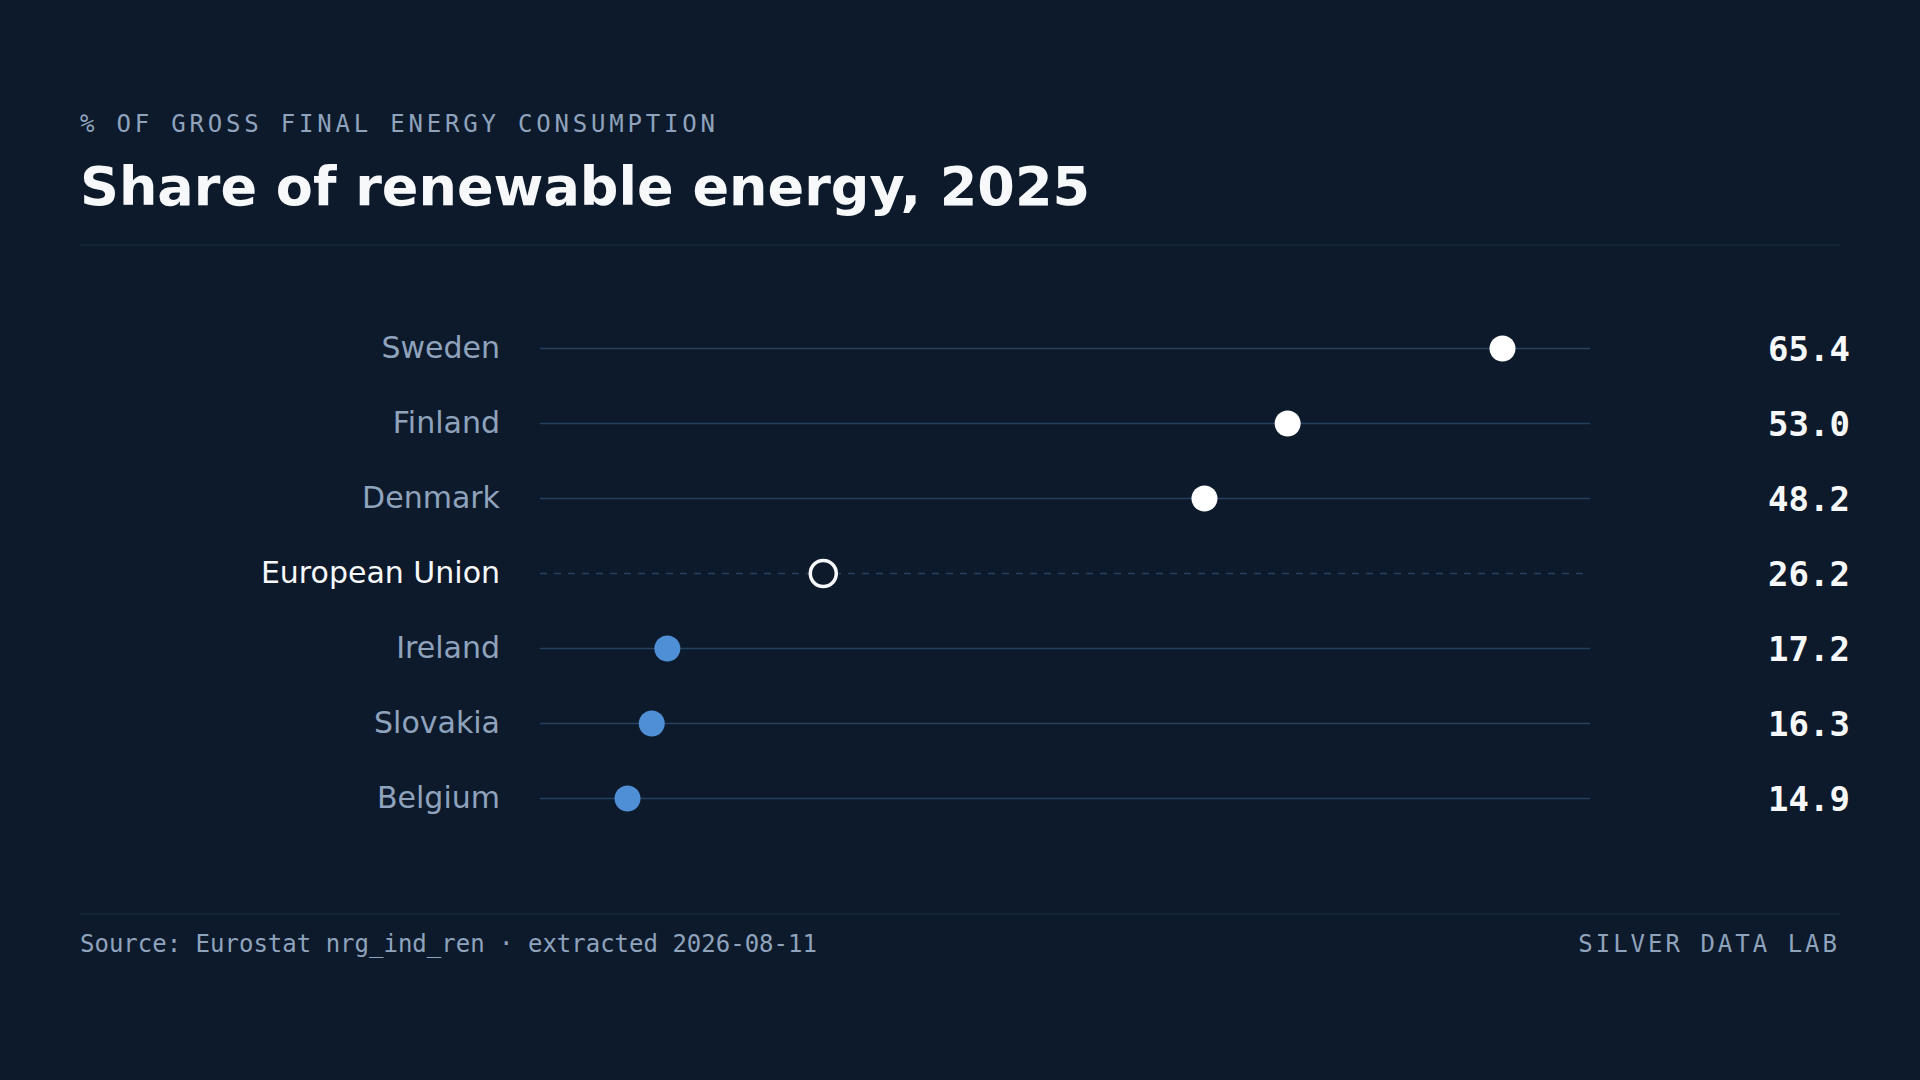
A quarter of the way, unevenly
Renewable sources covered 26.2% of the European Union's gross final energy consumption in 2025 — the measure that counts electricity, heating and cooling, and transport together, rather than electricity alone.
Electricity is where renewable shares are highest and where most public attention sits. This indicator is the harder one: it includes the heating of buildings and the fuel burned by vehicles, both of which have decarbonised more slowly.
The top of the ranking
Sweden records 65.4%, comfortably first. Finland follows at 53.0%, Denmark at 48.2%, Latvia at 46.3% and Austria at 44.2%.
Four of those five are northern countries with large forests and substantial hydropower, and the fifth, Denmark, has built the wind capacity its geography allows. Estonia at 42.3% and Lithuania at 38.5% follow the same pattern.
This matters for how the ranking should be read. A high renewable share is partly a policy achievement and partly an inheritance: biomass from forestry, hydro from rivers with the right gradient, wind from an exposed coastline. Countries without those endowments start from a different place.
The bottom, and who is in it
Belgium records 14.9%, the lowest in the Union, with Slovakia at 16.3%, Ireland at 17.2%, Poland at 18.7% and Malta at 18.8%.
The group below 20% includes several densely populated economies with limited land for biomass and little hydro potential, and it is where the gap between the Union's average and its laggards is widest. Belgium's share is 11.3 percentage points below the EU figure and less than a quarter of Sweden's.
Where the large economies sit
Germany records 23.9% and France 23.9%, both below the EU average. Italy records 20.5%, Spain 26.0% and Poland 18.7%.
That is the finding with the most weight behind it, because these are the Member States that consume the most energy in absolute terms. The EU average of 26.2% is held up by countries whose total consumption is small; the countries that dominate the Union's energy use are clustered at or below it.
A share is not a quantity, and this study measures shares. A percentage point of renewable energy in Germany represents far more energy than a percentage point in Latvia, and the ranking cannot show that.
Share of renewable energy, 2025
| Country | % of gross final energy consumption | Gap to EU averagepercentage points, derived |
|---|---|---|
| Sweden | 65.4p | +39.2 |
| Finland | 53.0p | +26.8 |
| Denmark | 48.2p | +22.0 |
| European Unionaggregate | 26.2p | — |
| Ireland | 17.2p | −9.0 |
| Slovakia | 16.3p | −9.9 |
| Belgium | 14.9p | −11.3 |
Flags carried by the source on these values: p provisional
This table as data: CSV · JSON
Every Member State for this indicator+
Members see every Member State for this indicator here, not only the rows the ranking prints. Become a Member
Embed this chart
Paste this code into a page. The frame carries the source and the extraction date, and links back to the study.
What these figures cannot tell you
- This is a share, not an amount
- The indicator measures renewables as a percentage of each country's own gross final energy consumption. A country can raise its share by reducing total consumption rather than by adding renewable capacity, and a small economy with a high share may deploy far less renewable energy in absolute terms than a large economy with a low one.
- Endowment and policy are not separated here
- Hydropower requires rivers with the right gradient, biomass requires forests, and offshore wind requires a suitable coastline. The ranking measures outcomes and cannot distinguish a country that built capacity from one that inherited the conditions for it.
- Biomass sustainability is outside this measure
- The indicator counts biomass as renewable regardless of its source or the carbon accounting attached to it. Member States with large forestry sectors score highly for that reason, and whether that is climate neutral in practice is a live scientific and regulatory question this dataset does not address.
- Gross final consumption follows accounting rules
- The denominator is defined by EU methodology, which includes statistical transfers between Member States and specific treatments for aviation and transport fuels. Two countries with the same physical energy mix can report slightly different shares as a result.
Frequently asked questions
- What share of EU energy is renewable?
- 26.2% of gross final energy consumption in 2025. That measure covers electricity, heating and cooling, and transport together, so it is lower than the renewable share of electricity alone.
- Which EU country uses the most renewable energy?
- Sweden, at 65.4% of its gross final energy consumption in 2025, ahead of Finland at 53.0% and Denmark at 48.2%. Six Member States are above 40%.
- Which EU country uses the least renewable energy?
- Belgium, at 14.9% in 2025, followed by Slovakia at 16.3% and Ireland at 17.2%. Seven Member States sit below 20%.
- Why do northern countries score so highly on renewables?
- Largely because of what they have. Forests supply biomass, rivers supply hydropower and exposed coastlines supply wind. The indicator measures the outcome and cannot separate a country that built capacity from one whose geography provided it.
Methodological note
The indicator is the share of energy from renewable sources in gross final energy consumption, Eurostat's headline renewable measure and the one against which EU renewable targets are set. It covers electricity, heating and cooling, and transport together.
Values are for 2025, the most recent year with complete coverage of the 27 Member States at the extraction date.
The counts of Member States above 40% and below 20%, and the comparisons between individual countries and the EU figure, are derived by Silver Data Lab from the published shares.
Source data
The underlying series can be inspected and re-downloaded from the Eurostat data browser. The filters below are the ones applied.
Main indicators — share of renewable energy
nrg_ind_ren
- Filters applied:
- freq=A · nrg_bal=REN · unit=PC · time=2025
- Extracted:
- 2026-09-16
- Source last updated:
- 2026-09-15
Download the data
The data the study you have just read is built on, exactly as it was downloaded and archived.
Yours as a Member.
Data downloadable by Members
How to cite
Record the vintage as well as the study: the figures on this page are the ones extracted on the dates below.
Silver Data Lab Research Desk (2026). Sweden Gets Four Times as Much of Its Energy From Renewables as Belgium. Silver Data Lab, published 17 July 2026, last updated 11 October 2026. https://www.silverdatalab.com/studies/renewable-energy-in-the-eu
- Data: Eurostat, Main indicators — share of renewable energy (nrg_ind_ren), filters freq=A, nrg_bal=REN, unit=PC, time=2025; extracted 2026-09-16; source last updated 2026-09-15. https://doi.org/10.2908/nrg_ind_ren
Silver Data Lab's analysis is licensed CC BY 4.0. The statistics remain their publisher's and keep its terms of reuse.
Ask the research desk
A question about this study — a definition, a filter, a break in the series, what the figures can and cannot support — answered by the desk that made the extraction.
Members can write to the research desk
Other studies on the same dataset
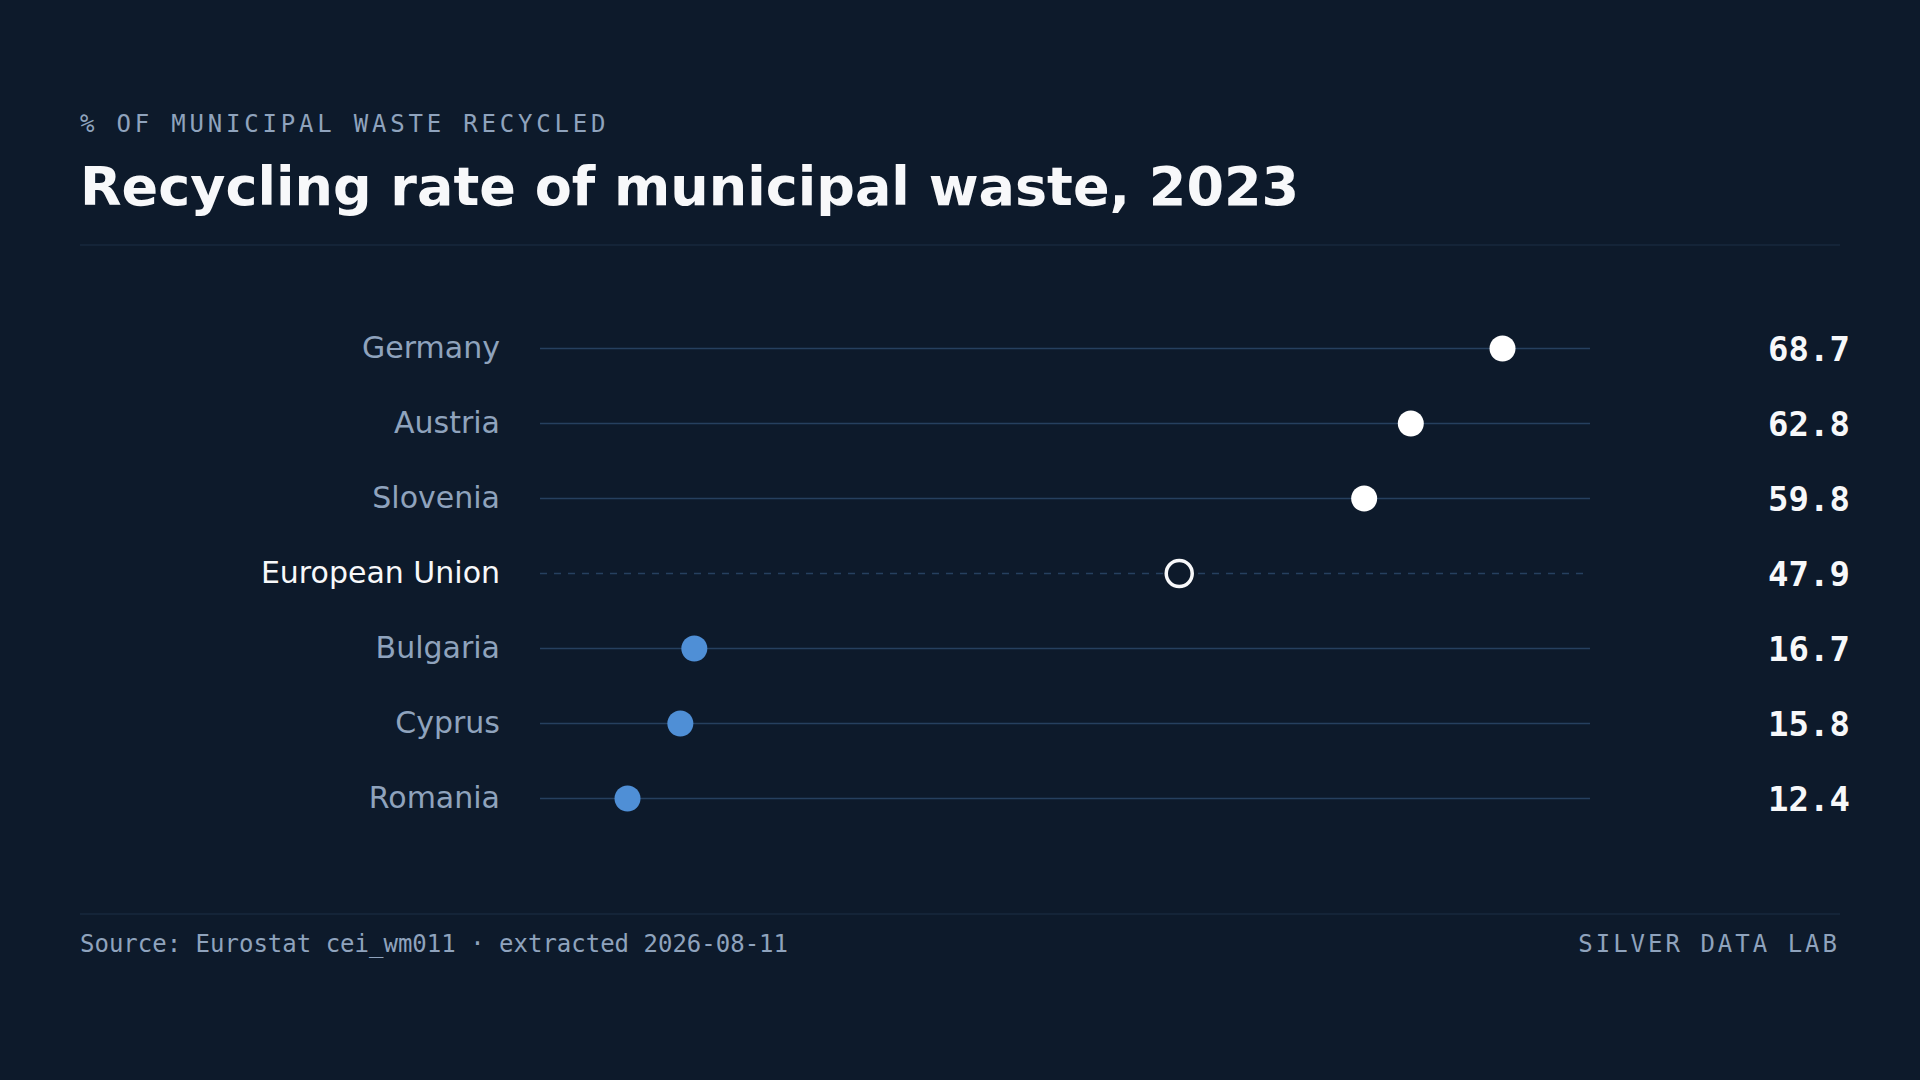
Studies where the same country leads or trails
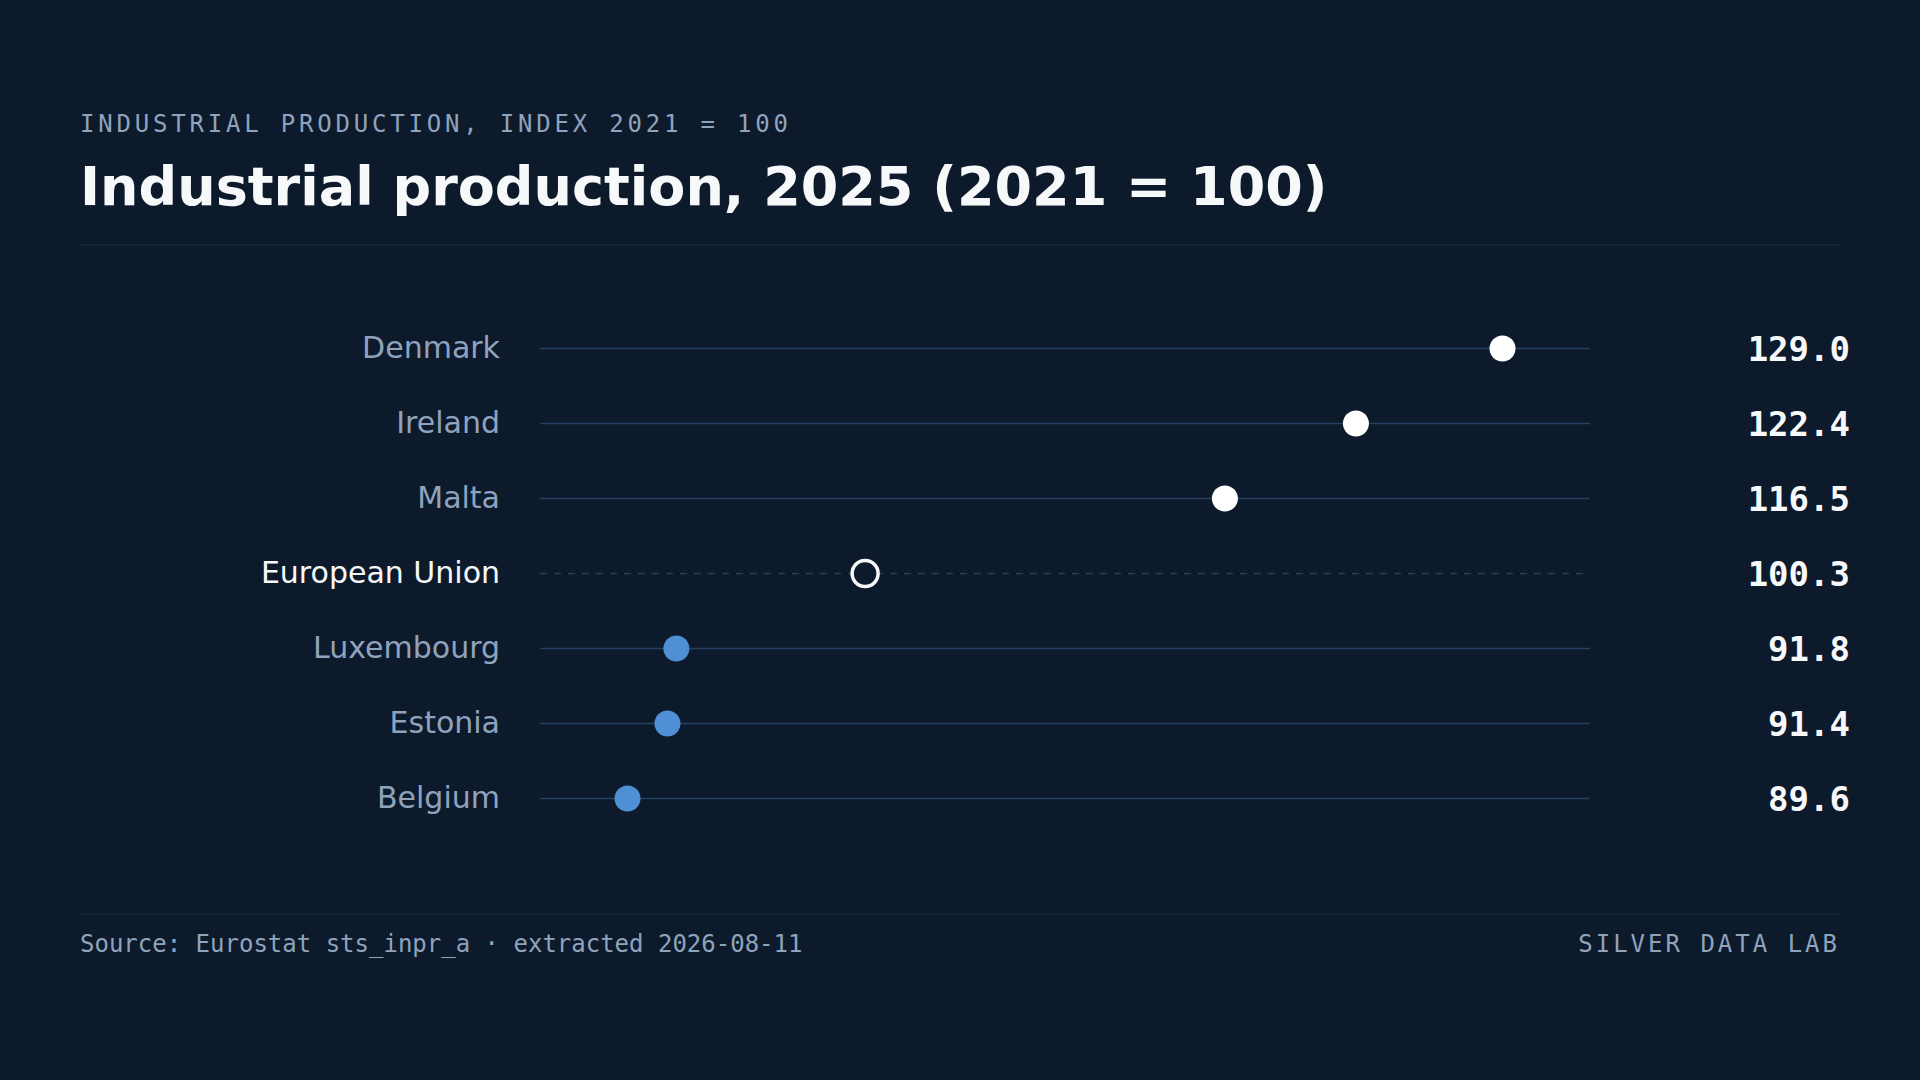
EU Industrial Output Is Where It Was Four Years Ago
EU industrial production in 2025 stood at 100.4 against a 2021 base of 100 — output is essentially unchanged after four years.
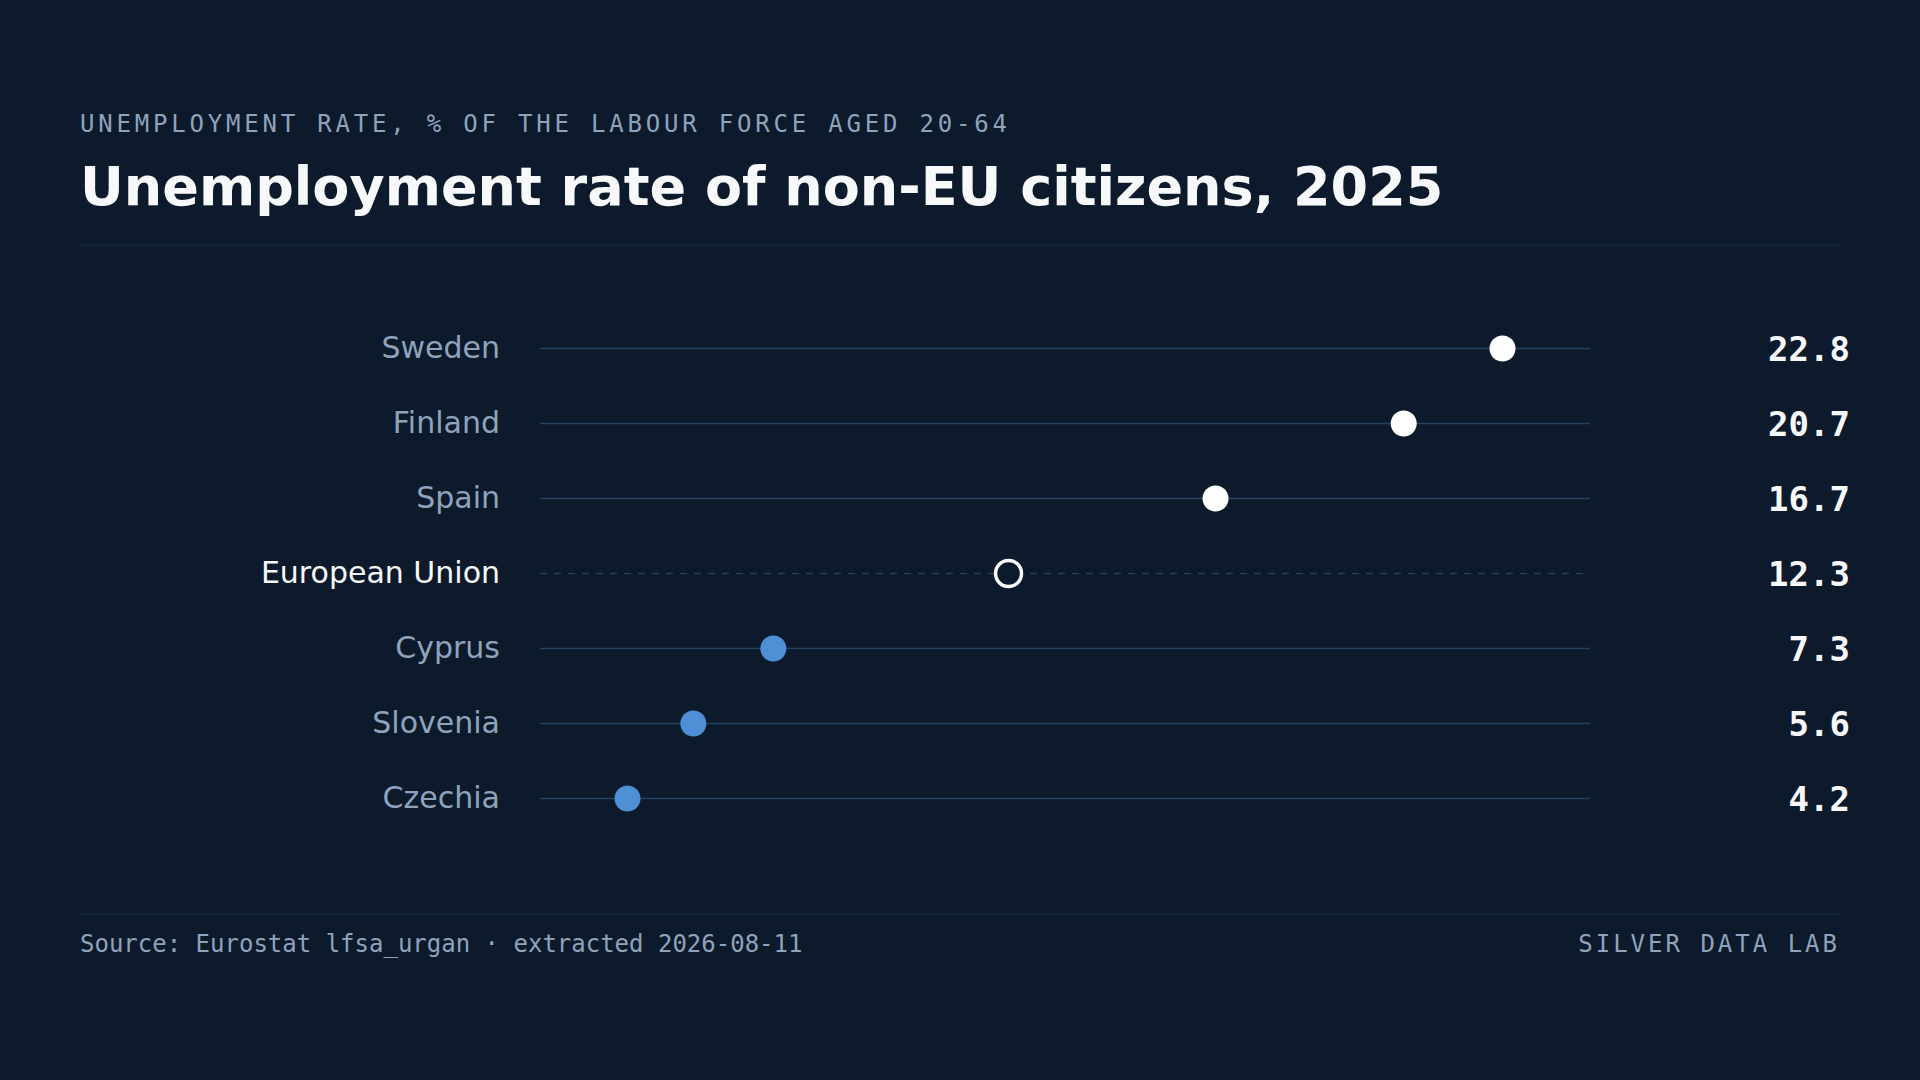
In Sweden, Non-EU Citizens Are Unemployed at 3.5 Times the Rate of Swedes
Non-EU citizens aged 20 to 64 faced 12.3% unemployment in the EU in 2025, against 5.2% for nationals.
Ireland Pays Out More Income Abroad Than It Receives, a Net 28.6% of GDP
Ireland's net primary income outflow was 28.6% of GDP in 2025, second only to Luxembourg's 29.3%.