Trips by Greeks Are the EU's Least Likely to Last Three Nights or Fewer
Silver Data Lab Research Desk · Statistical analysis · Published on 24 October 2026
This study is open to members only
Its sources, filters and extraction date are declared above, as they are for every study. Sign in to read the analysis in full.
- Data source
- Eurostat
- Reference period
- 2025
- Last updated
- 24 October 2026
Re-checked against the source on 23 October 2026. No value in its datasets has moved between the snapshots we hold. Every revision we have observed →
Key estimates
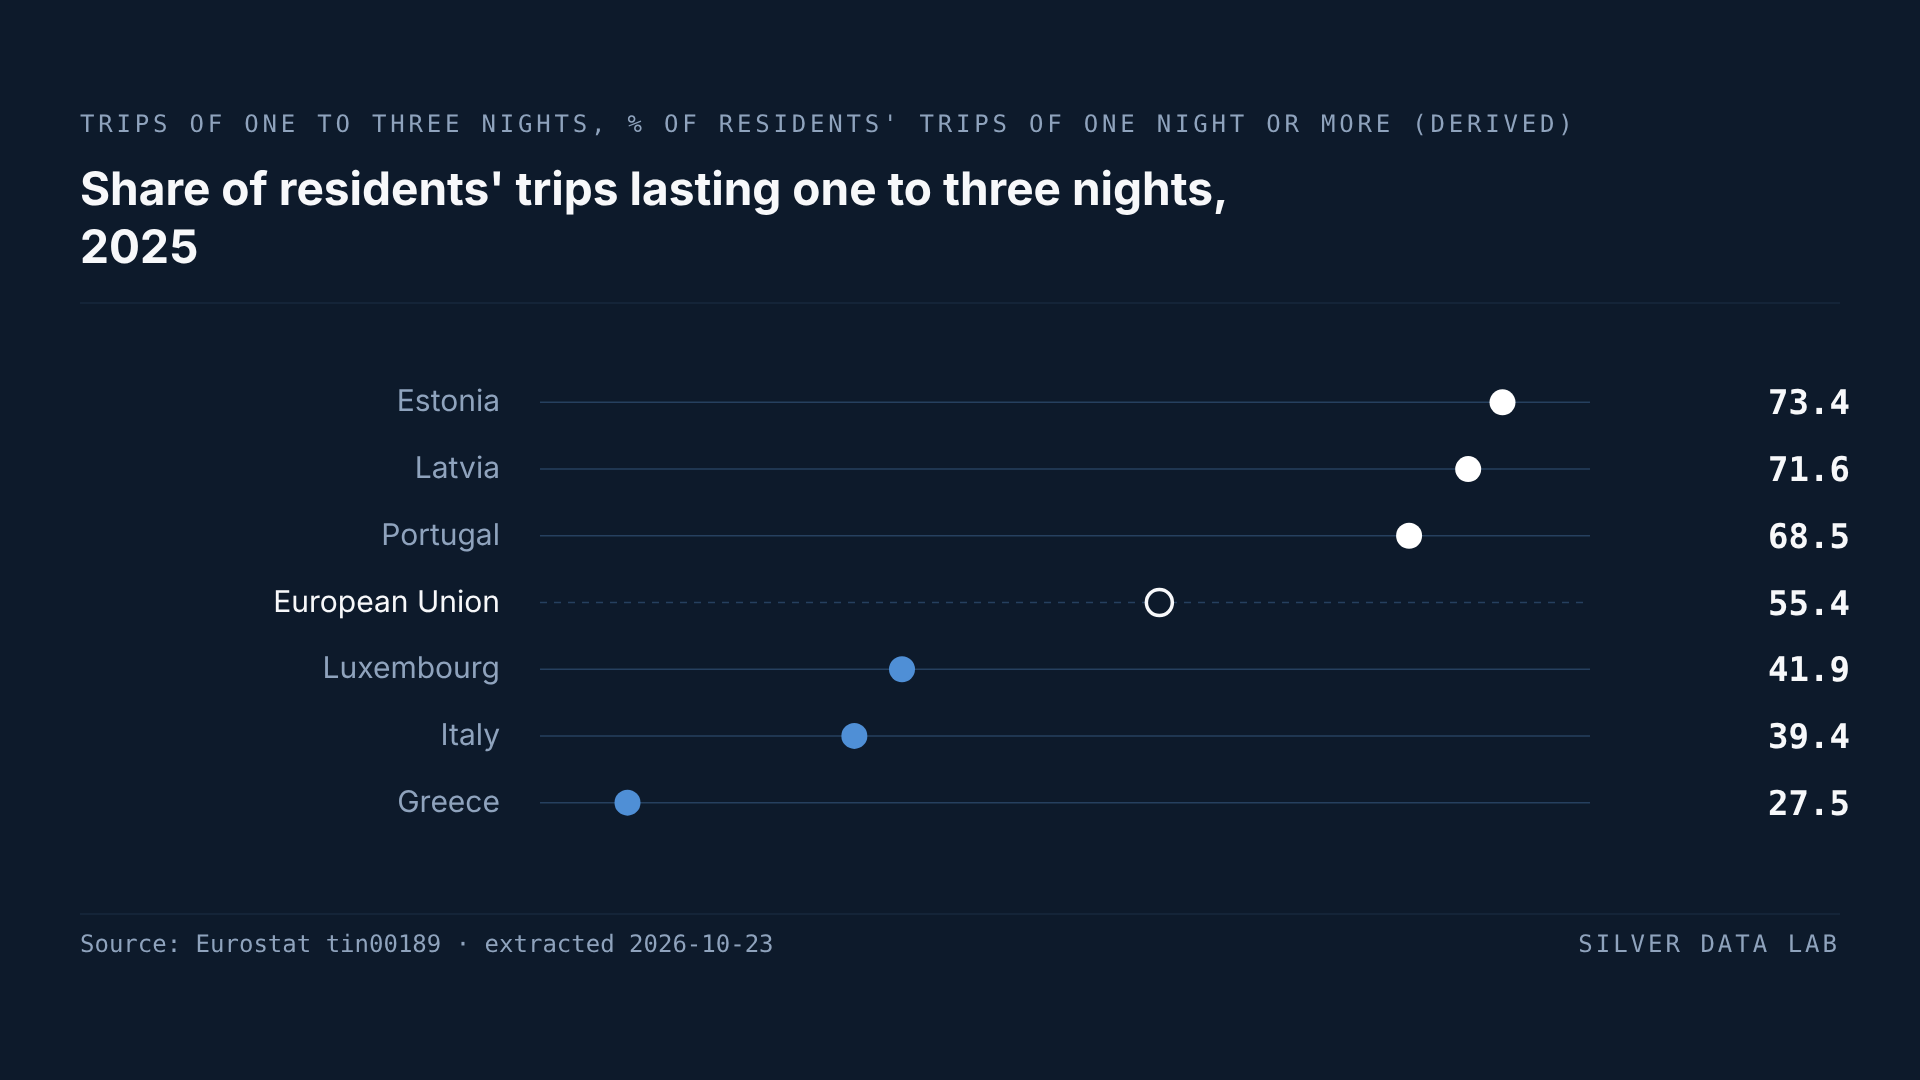
- In 2025, 27.5% of the trips of at least one night made by people living in Greece lasted one to three nights: 2.25 million of 8.17 million. No other Member State's residents recorded a share as low; the share is derived by Silver Data Lab from Eurostat's counts, as is every share on this page.
- Greek residents have had the lowest share in every year from 2014 to 2025, ranging from 25.4% to 31.0%. The lowest share the residents of any other Member State have recorded in those years is Belgium's 37.6%, in 2014.
- At the other end, 73.4% of Estonian residents' trips lasted one to three nights, ahead of Latvian residents' 71.6% and Portuguese residents' 68.5%. After Greece, the lowest shares were those of residents of Italy, 39.4%, and Luxembourg, 41.9%, and short trips were the majority for the residents of 20 of the 27 Member States.
- For EU residents as a whole the share was 55.4%, its lowest since the series began in 2014. Between 2019 and 2025 their trips of four nights or more grew by 10.0% and their trips of one to three nights by 3.2%, both changes derived.
- Business trips are short far more often, 74.8% of those EU residents made in 2025, but they were 10.7% of all trips. Counting personal trips alone, the same three Member States sit at each end, with Greek residents lowest at 26.7% and Estonian residents highest at 72.7%.
Fewer than three trips in ten
In 2025 the people living in Greece made 8.17 million trips that kept them away from home for at least one night, and 2.25 million of those trips lasted one to three nights. That is 27.5%, the smallest share of short trips recorded for the residents of any Member State. Taken together, EU residents kept 55.4% of their trips to one to three nights, about twice the Greek proportion. Seen from the other side, more than seven in ten of the trips Greek residents made lasted four nights or more.
Eurostat publishes how many trips fell into each band of nights. The proportions on this page are Silver Data Lab's arithmetic on those counts, and each of them is labelled as derived.
What the table counts
Member States ask their residents aged 15 and over, mostly in household surveys, about the trips they made during the year that included at least one night away from where they usually live. A trip is counted wherever it went, within the country or abroad, and whatever it was for: holidays, visits to family and friends, other private reasons and journeys for work all go into one total. Greece's figure is therefore a count of the trips Greek residents made, not of the visitors who came to Greece.
The unit is the trip rather than the traveller, so a resident who goes away often adds many trips and one who never travels adds none. The table then sorts the trips by length, counted in nights. This page calls a trip of one to three nights short, and the share it ranks is the number of short trips divided by the number of all trips of one night or more. Trips of four nights or more make up the remainder: for every country and year in the table, the two bands add up to the total to within one trip.
Lowest in every year since 2014
The Greek share has stayed in a narrow band for twelve years. It was 29.9% in 2014 and 31.0% in 2015, its highest, fell to 25.4% in both 2023 and 2024, its lowest, and stood at 27.5% in 2025. In none of those years did the residents of another Member State record a lower share; in 2023 Sweden has no value, so that year's comparison covers the other 26. Belgian residents' 37.6% in 2014 is the lowest any other Member State reaches in the table, more than six points above the highest Greek value.
The number of trips moved far more than the share. Greek residents made 32.4% more trips of one night or more in 2025 than in 2019, while the short share went from 26.7% to 27.5%.
The two ends of the ranking
Estonian residents recorded the highest share in 2025: 73.4% of their trips lasted one to three nights. Residents of Latvia followed at 71.6%, Portugal at 68.5%, Lithuania at 66.7% and Spain at 64.9%. Estonia's residents have had the highest share in ten of the twelve years in the table, and Latvia's in the other two, 2015 and 2021.
After Greece, the lowest shares in 2025 belonged to residents of Italy, at 39.4%, and Luxembourg, at 41.9%, then Denmark at 46.0%, Malta at 46.8%, the Netherlands at 48.1% and Belgium at 48.3%. Those are the seven Member States whose residents made fewer short trips than longer ones; for the residents of the other 20, short trips were the majority. Thirteen countries' residents recorded shares above the EU share and fourteen below it, and the middle of the 27 is Cyprus, at 55.3%.
The south of the Union therefore sits at both extremes. Greek and Italian residents have the two lowest shares, while Portuguese residents are third highest and Spanish residents fifth. The two countries whose residents make the most trips sit nearer the middle: German residents, with 274.0 million trips the largest count in the EU, kept 50.6% of them to three nights or fewer, and French residents 58.6%.
Luxembourg's residents have been among the four lowest in every year of the series. Italian residents' place near the bottom is more recent: their share ranged from 47.1% to 52.9% between 2014 and 2020, dropped to 39.6% in 2021 and has stayed between 39.4% and 43.9% since then. Eurostat flags no break in the Italian series in 2021, and the table does not say why the level changed.
Trips for work and trips for private reasons
The share mixes two kinds of travel that behave differently. Eurostat's dataset tour_dem_ttls, from which this table is drawn, splits the same trips by purpose, and it shows that 74.8% of the business trips EU residents made in 2025 lasted one to three nights, against 53.1% of their personal trips. Business, however, made up 10.7% of all trips, so the share for every purpose together, 55.4%, sits 2.3 points above the share for personal trips alone.
Taking business trips out leaves both ends of the ranking where they were. Counting personal trips only, Greek residents are lowest at 26.7%, followed by residents of Italy at 37.2% and Luxembourg at 38.6%, while Estonian residents are highest at 72.7%, ahead of residents of Latvia at 72.1% and Portugal at 68.2%: the same six Member States, in the same order. Travel for work by the same residents is the subject of the study on business travel.
Longer trips have grown faster across the EU
EU residents made 1,208.9 million trips of at least one night in 2025, 6.2% more than the 1,138.9 million of 2019, the last year before the pandemic. The two bands did not grow at the same pace. Trips of four nights or more rose by 10.0%, to 539.3 million, and trips of one to three nights by 3.2%, to 669.6 million, so 49.2 million of the 70.1 million additional trips, or 70.2%, were in the longer band.
The EU share of short trips went from 57.0% in 2019 to 55.4% in 2025, the lowest value in a series that starts in 2014; its highest was 59.0%, in 2020, and Eurostat's EU value for 2023 is an estimate. Compared at one decimal place, the share fell between 2019 and 2025 for the residents of 19 Member States and rose for those of eight, Greece among them, by 0.8 points.
What the counts cannot tell
The table sorts trips by the number of nights they lasted and records nothing about why they lasted that long. It carries no measure of distance, cost, income or destination, so it cannot say why Greek residents' trips are so seldom short or why Estonian residents' trips so often are, and this study gives no reason for either. The study on holidays abroad also finds Greek residents at one end of its ranking, on a different measure: the share of their holiday nights spent outside the country. The two pages answer separate questions, and neither is used here to account for the other.
Share of residents' trips lasting one to three nights, 2025
| Country | % of trips (derived) | Gap to EU sharepercentage points, derived |
|---|---|---|
| Estonia | 73.4 | +18.0 |
| Latvia | 71.6 | +16.2 |
| Portugal | 68.5 | +13.1 |
| European Unionaggregate | 55.4 | — |
| Luxembourg | 41.9 | −13.5 |
| Italy | 39.4 | −16.0 |
| Greece | 27.5 | −27.9 |
This table as data: CSV · JSON
Every Member State for this indicator+
Members see every Member State for this indicator here, not only the rows the ranking prints. Become a Member
Share of residents' personal trips lasting one to three nights, 2025
| Country | % of personal trips (derived) | Gap to EU sharepercentage points, derived |
|---|---|---|
| Estonia | 72.7 | +19.6 |
| Latvia | 72.1 | +19.0 |
| Portugal | 68.2 | +15.1 |
| European Unionaggregate | 53.1 | — |
| Luxembourg | 38.6 | −14.5 |
| Italy | 37.2 | −15.9 |
| Greece | 26.7 | −26.4 |
This table as data: CSV · JSON
Every Member State for this indicator+
Members see every Member State for this indicator here, not only the rows the ranking prints. Become a Member
What these figures cannot tell you
- Residents' trips, each counted once
- The counts come from national surveys of residents aged 15 and over, so they describe the trips each country's residents made, at home or abroad, and say nothing about the visitors a country received. Because the unit is the trip, residents who travel often carry more weight in the share than those who rarely do, and the table cannot say how many people take short trips. Eurostat's metadata states that the figures are representative of people aged 15 and over, with younger travellers reported only on an optional basis, and a journey that ends at home on the same day is not a trip here.
- Bands of nights, not an average length
- The share says how often a trip fell into the band of one to three nights. It is not an average length of trip, which would need the number of nights spent, a different table, and none is computed here. The finer bands for long stays are not used either: in 2025 the band of 92 to 365 nights has no value for 23 Member States, and the band of 29 to 91 nights none for six and a low-reliability flag on six more. Eurostat's metadata explains that this flag marks a value resting on 20 to 49 observations in the survey sample, and that a value resting on fewer is not published.
- Work and private travel in one share
- The table covers every purpose at once. In 2025 business trips were 10.7% of EU residents' trips, and 74.8% of them lasted one to three nights against 53.1% of personal trips, figures taken from tour_dem_ttls, the dataset the table is drawn from. Where work makes up a larger part of residents' travel, the mix alone can move a country's share. On personal trips only, the three highest and the three lowest Member States are the same as on all trips, in the same order, so the ends of the ranking do not rest on that mix.
- National series that jump without a break flag
- The counts are produced country by country, mostly from sample surveys and, in a few cases, for trips abroad, from surveys at the border. Some national series move sharply with no break flagged: the share for Danish residents went from 56.8% in 2024 to 46.0% in 2025 and for Belgian residents from 38.8% to 48.3%, the count of trips by Swedish residents rose from 54.9 million in 2019 to 105.7 million in 2025, and Italian residents' share fell from 47.1% in 2020 to 39.6% in 2021. The table gives no reason for any of these, and no thesis on this page rests on them. With Sweden taken out of both years, the EU share still falls between 2019 and 2025, from 56.8% to 55.2%, a derived calculation. Eurostat's metadata also names respondents forgetting trips as the main likely source of error, which would leave too few trips counted; it does not say whether short trips or long ones are forgotten more often.
- Breaks, an estimate and a missing year
- Eurostat flags breaks in series for Italy, Malta and Poland in 2014, Spain in 2015 and Belgium in 2017, so statements that cover every year since 2014 compare those countries across those breaks. Sweden has no value for 2023, which leaves that year's comparisons with 26 Member States, and the EU value for 2023 is estimated. In every other year the national counts add up to the EU aggregate to within four trips; in 2023, with no Swedish value to add, they fall 82.4 million trips short of it. None of the 2019, 2024 or 2025 values used on this page carries a flag.
Frequently asked questions
- What share of trips by EU residents last three nights or fewer?
- 55.4% in 2025. Of the 1,208.9 million trips of at least one night made by EU residents aged 15 and over, 669.6 million lasted one to three nights. The share is derived by Silver Data Lab from Eurostat's counts, and it is the lowest in a series that starts in 2014.
- Which EU country's residents make the smallest share of short trips?
- Greece's. Of the trips people living in Greece made in 2025, 27.5% lasted one to three nights, and Greek residents have had the lowest share in every year since 2014. Residents of Italy follow at 39.4% and of Luxembourg at 41.9%.
- Where are short trips most common?
- Among the residents of Estonia, 73.4% of whose trips lasted one to three nights in 2025, followed by the residents of Latvia at 71.6% and Portugal at 68.5%. Estonian residents have recorded the highest share in ten of the twelve years from 2014 to 2025.
- Does a low share of short trips mean trips are long on average?
- Not on this evidence. More than seven in ten of Greek residents' trips lasted four nights or more, but the table sorts trips into bands rather than counting their nights, so it gives no average length and this study computes none. The longer band runs from four nights to a year, and the share says nothing about where in that range the longer trips fall.
- Do business trips change the picture?
- Not at either end of the ranking. Business trips are mostly short, 74.8% of those EU residents made in 2025, but they were 10.7% of all trips. On personal trips alone Greek residents are still lowest, at 26.7%, and Estonian residents still highest, at 72.7%.
- Are these trips made to each country or by its residents?
- By its residents. Each country's figure counts the trips its residents aged 15 and over made, in their own country or abroad. Visitors arriving from other countries are not in it, and how many nights a country hosts is a separate measure.
Methodological note
The table measures the number of trips of one night or more made during the year by residents aged 15 and over of each Member State and of the EU as a whole, to any destination, the residents' own country included, and for all purposes together, sorted into bands by the number of nights each trip lasted. This page uses three of those bands, one to three nights, four nights or more, and all trips of one night or more, for every Member State and the EU in every year from 2014 to 2025. From tour_dem_ttls, the dataset tin00189 is drawn from, it uses the bands of one to three nights and of one night or more for 2025, split into personal trips, professional or business trips and all purposes, for every Member State and the EU.
2025 is the latest year in both, with a value for every Member State and for the EU aggregate. Changes are measured from 2019, the last year before the pandemic.
Silver Data Lab derived the following from the published counts: the share of trips lasting one to three nights, trips of one to three nights divided by trips of one night or more, for each Member State and the EU in every year from 2014 to 2025, which includes every value in the first ranking; the same share for personal trips and for business trips in 2025, which includes every value in the second ranking; the share of Greek residents' trips lasting four nights or more in 2025, and the gap between the lowest share any other Member State recorded and the highest Greek share; business trips as a share of all trips for the EU in 2025; the ratio of the EU share to the Greek share, and the difference between the EU share for all trips and for personal trips; the percentage changes between 2019 and 2025 in the EU's trips of one to three nights, of four nights or more and of all lengths, and in Greek residents' trips of all lengths; the EU's additional trips between those two years, in millions, and the part of them lasting four nights or more; the change in each Member State's share between 2019 and 2025, compared at one decimal place, and the counts of Member States whose share rose or fell; the EU share with Sweden left out, Eurostat's EU counts minus Sweden's, for 2019 and 2025; the difference between the sum of the national counts and the EU aggregate in each year; the counts of Member States above or below 50% and above or below the EU share, and the middle value of the 27; the rank positions and the years in which a Member State's residents recorded the highest or lowest share; and the rounding of counts to millions. Every count, rank and comparison covers all 27 Member States, except in 2023, when Sweden has no value. No other value is computed, and nothing on the page is an average number of nights.
Source data
This study draws on 2 datasets from Eurostat. Each can be inspected and re-downloaded from its catalogue, and the filters below are the ones applied.
Trips by duration of the trip
tin00189
- Filters applied:
- freq=A · c_dest=WORLD · purpose=TOTAL · duration=N_GE1, N1-3, N_GE4 · unit=NR
- Extracted:
- 2026-10-23
- Source last updated:
- 2026-10-08
Trips by duration of the trip
tour_dem_ttls
- Filters applied:
- freq=A · c_dest=WORLD · purpose=TOTAL, PER, PROF · duration=N_GE1, N1-3 · unit=NR · time=2025
- Extracted:
- 2026-10-23
- Source last updated:
- 2026-10-08
Download the data
The data the study you have just read is built on, exactly as it was downloaded and archived.
Yours as a Member.
Data downloadable by Members
How to cite
Record the vintage as well as the study: the figures on this page are the ones extracted on the dates below.
Silver Data Lab Research Desk (2026). Trips by Greeks Are the EU's Least Likely to Last Three Nights or Fewer. Silver Data Lab, published 24 October 2026, last updated 24 October 2026. https://www.silverdatalab.com/studies/trip-length-in-the-eu
- Data: Eurostat, Trips by duration of the trip (tin00189), filters freq=A, c_dest=WORLD, purpose=TOTAL, duration=N_GE1, N1-3, N_GE4, unit=NR; extracted 2026-10-23; source last updated 2026-10-08. https://doi.org/10.2908/tin00189
- Data: Eurostat, Trips by duration of the trip (tour_dem_ttls), filters freq=A, c_dest=WORLD, purpose=TOTAL, PER, PROF, duration=N_GE1, N1-3, unit=NR, time=2025; extracted 2026-10-23; source last updated 2026-10-08. https://doi.org/10.2908/tour_dem_ttls
Silver Data Lab's analysis is licensed CC BY 4.0. The statistics remain their publisher's and keep its terms of reuse.
Ask the research desk
A question about this study — a definition, a filter, a break in the series, what the figures can and cannot support — answered by the desk that made the extraction.
Members can write to the research desk
Studies where the same country leads or trails
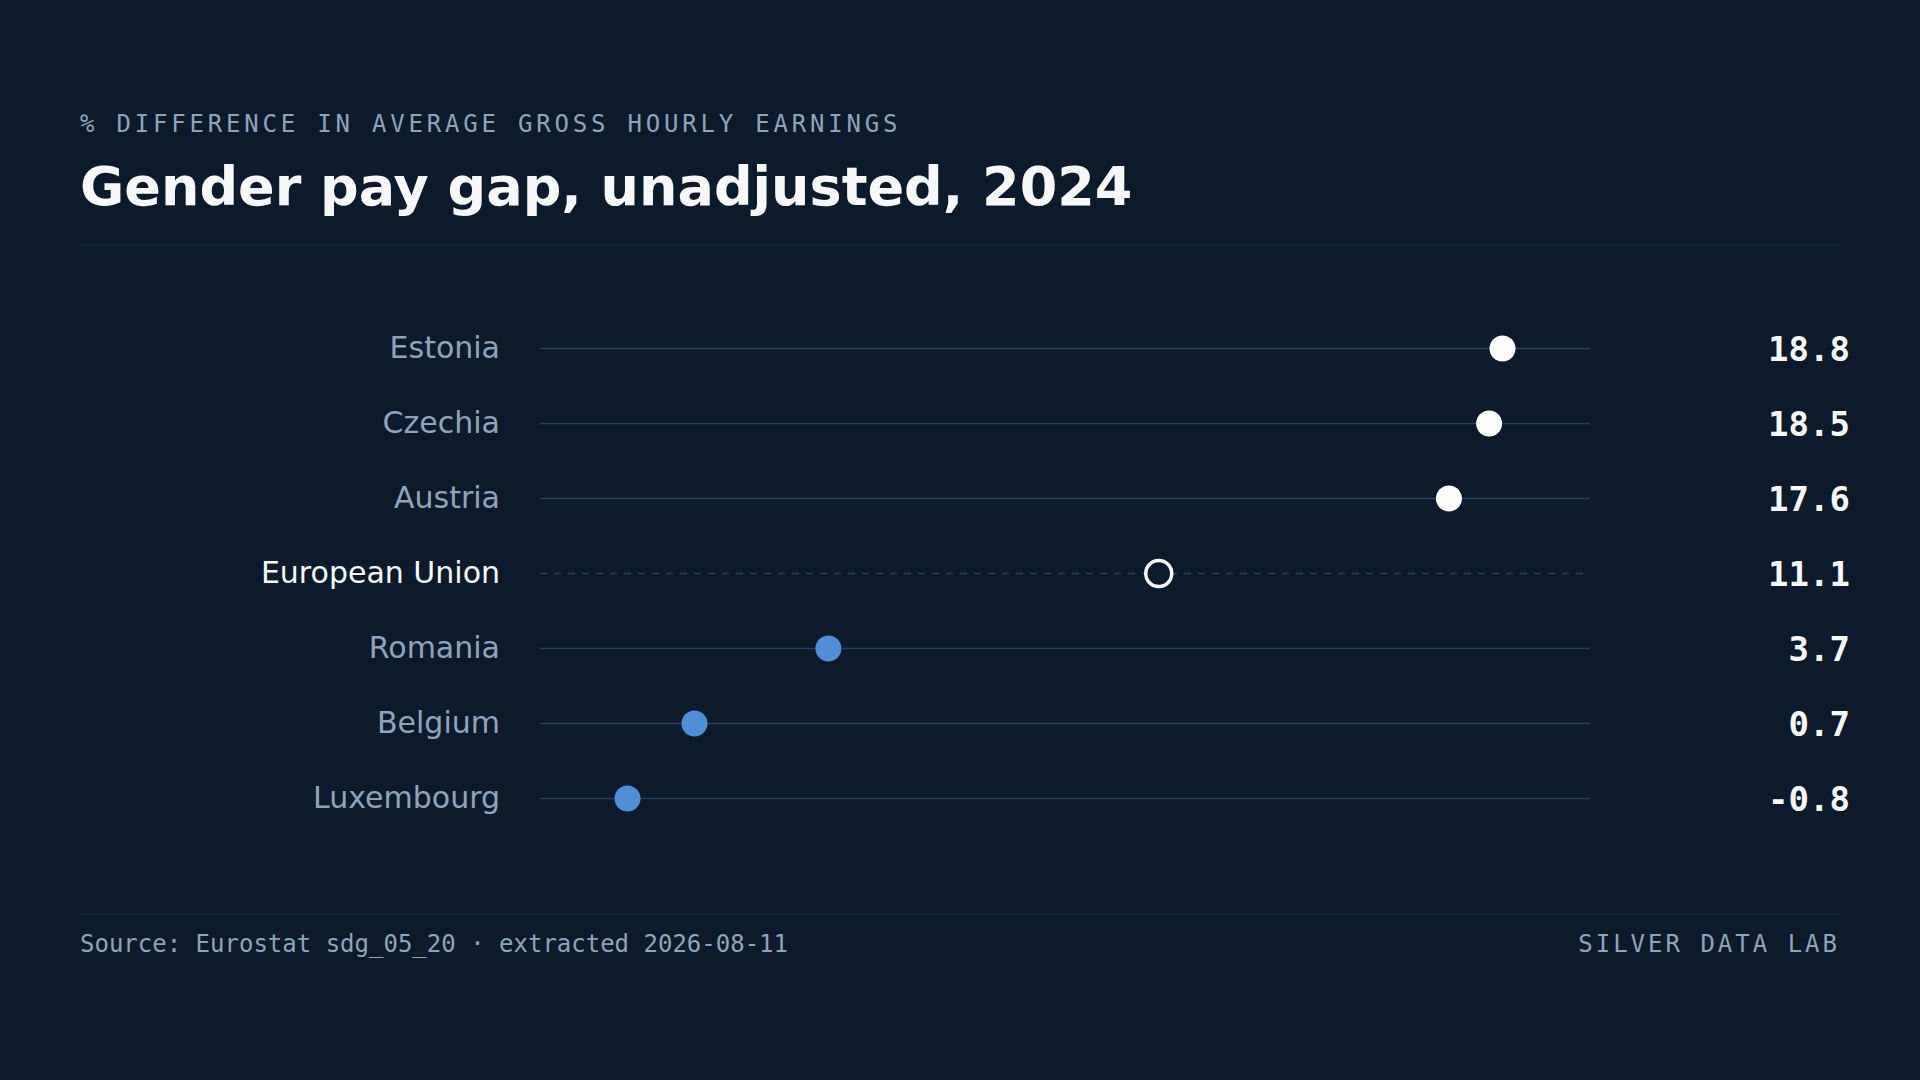
In Luxembourg, Women Are Paid More Than Men
Women in the EU earned 11.1% less per hour than men in 2024, before any adjustment for occupation or hours.
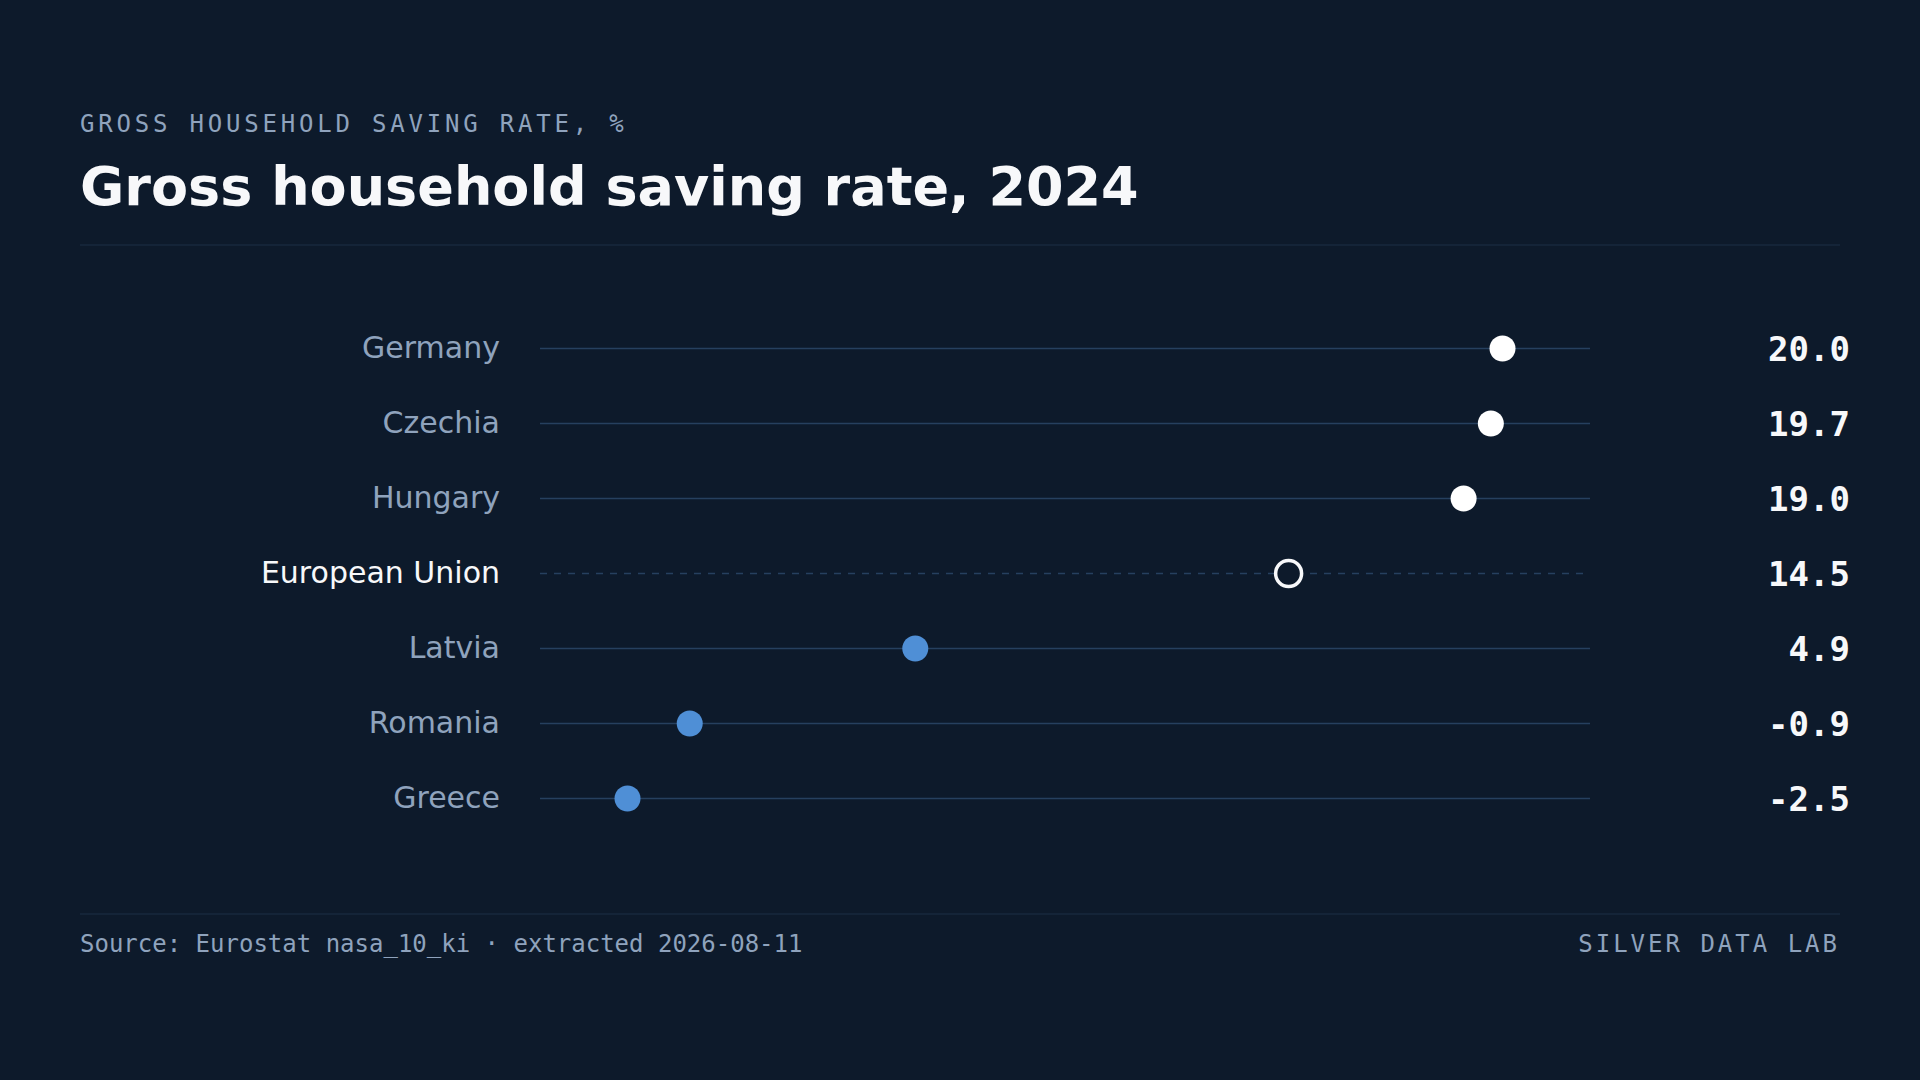
In Two EU Countries, Households Spend More Than They Earn
EU households saved 14.5% of their gross disposable income in 2024.
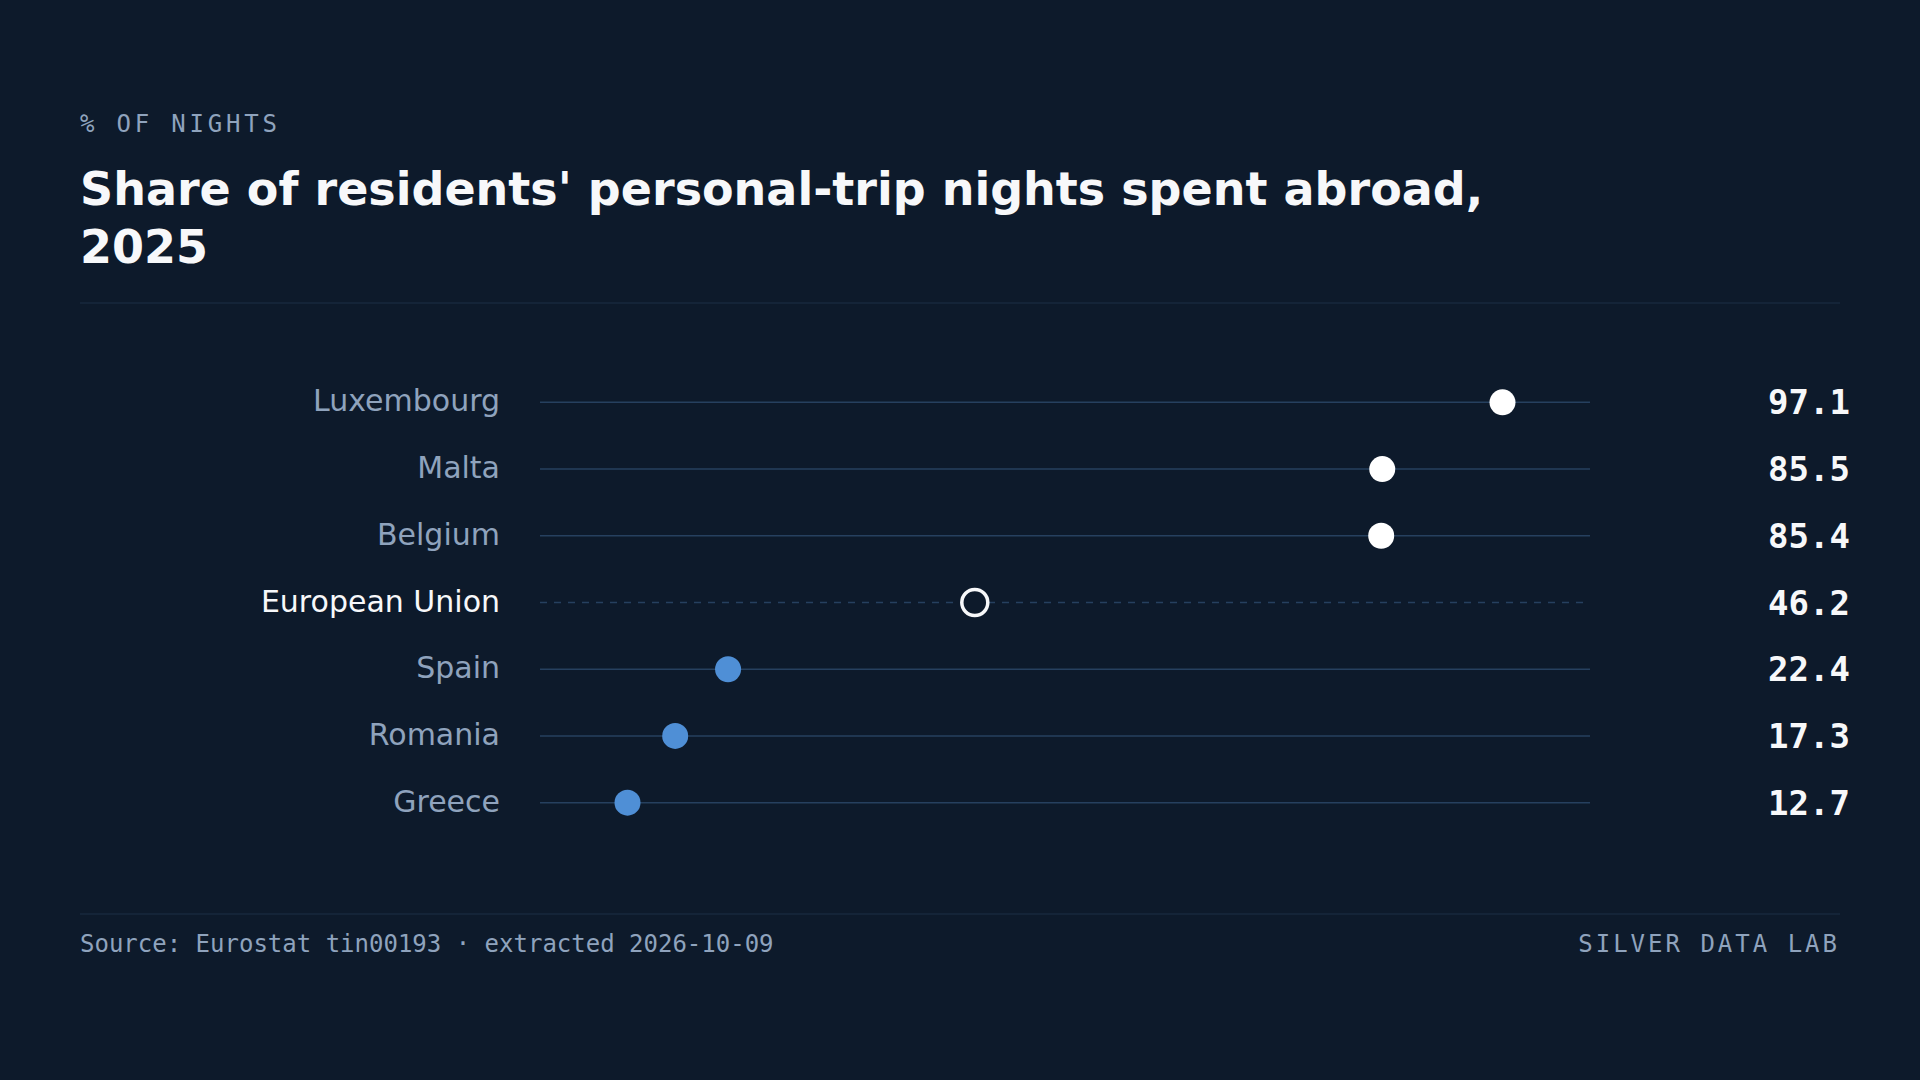
Luxembourg's Residents Spend Nearly All Their Holiday Nights Abroad
In 2025, 46.2% of the nights EU residents spent away from home on personal trips were spent in a country other than their own, against 42.3% in 2019. Both shares are derived by Silver Data Lab from Eurostat's counts of nights.