Bulgaria Relies More on Green Taxes Than Any Other EU Country
Silver Data Lab Research Desk · Statistical analysis · Published on 13 February 2026
This study is open to members only
Its sources, filters and extraction date are declared above, as they are for every study. Sign in to read the analysis in full.
- Data source
- Eurostat
- Reference period
- 2024
- Last updated
- 11 October 2026
Re-checked against the source on 11 August 2026. No value in its datasets has moved between the snapshots we hold. Every revision we have observed →
Key estimates
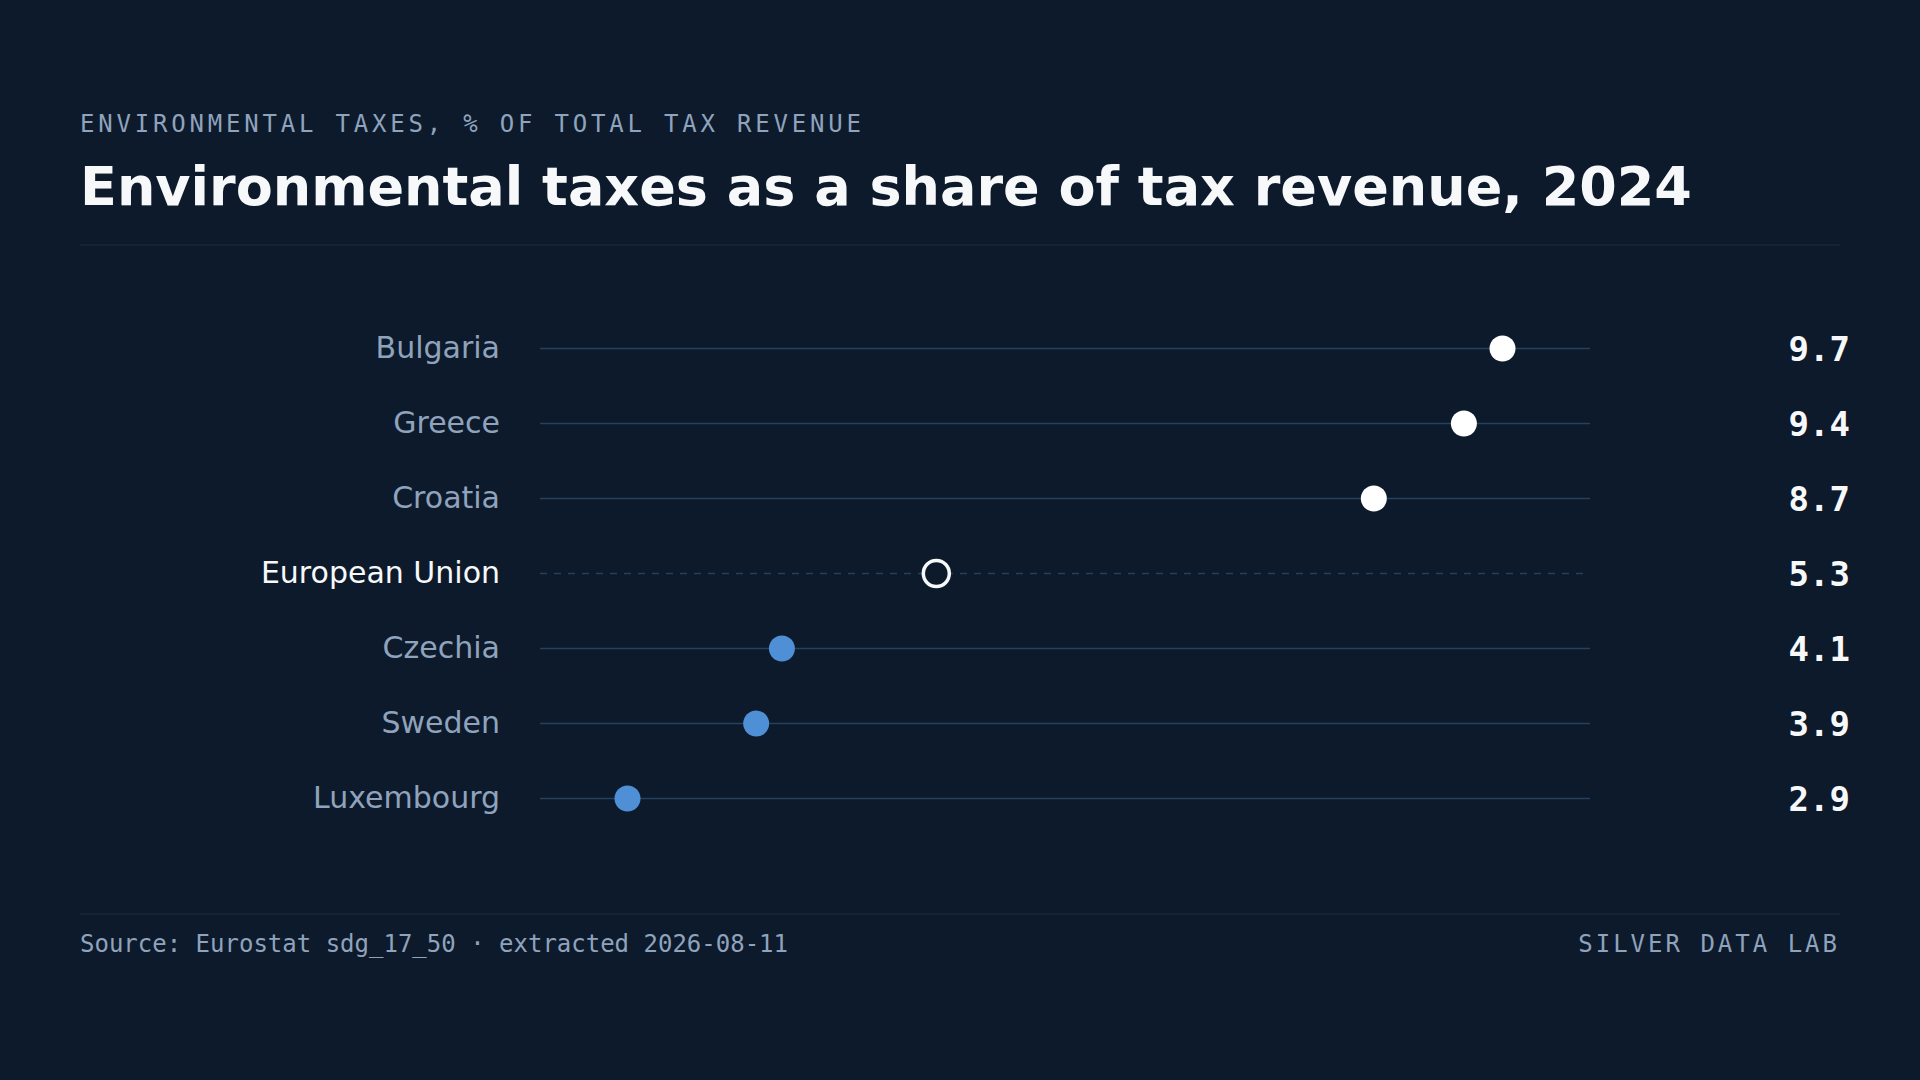
- Environmental taxes accounted for 5.3% of total tax revenue in the EU in 2024.
- Bulgaria records 9.7%, Greece 9.4%, Croatia 8.7% and Romania 8.7%.
- Luxembourg records 2.9%, Sweden 3.9% and Czechia 4.1%.
- Fifteen Member States are above the EU share.
- The countries with the largest shares are not the Union's environmental-policy leaders: the share is high because the rest of the tax base is narrow.
A ratio whose denominator does the work
Environmental taxes are levies on energy, transport, pollution and resource use. This indicator reports them as a share of a country's total tax revenue.
For the EU in 2024 the share was 5.3%.
The construction is the first thing to understand about the ranking. A country can raise its share by taxing pollution more, or by taxing everything else less. Both produce the same number and they mean opposite things.
The top
Bulgaria records 9.7%, Greece 9.4%, Croatia 8.7% and Romania 8.7%.
None of these is a country known for environmental policy leadership. What they share is a comparatively low total tax take relative to the size of their economies, and a heavy reliance on consumption taxes including fuel duty.
Bulgaria is the clearest illustration of why the ratio misleads. It has the largest share of tax revenue coming from environmental taxes and sits mid-table in the Union on emissions per head. The share is high because the base of other taxes is narrow, not because pollution is discouraged effectively.
The bottom
Luxembourg records 2.9%, Sweden 3.9%, Czechia 4.1% and France 4.3%.
Sweden is the case that makes the point in the other direction. It has one of the oldest carbon taxes in the world, introduced in 1991 and at one of the highest rates anywhere, and it records the second-lowest environmental tax share in the Union.
Two things produce that. Sweden's total tax revenue is large, so any component is a smaller share of it. And a carbon tax that works reduces its own base: emissions fall, and revenue with them.
An effective environmental tax is therefore self-defeating as a revenue source, which means a falling environmental tax share can be a sign of success. This indicator cannot distinguish that from a sign of neglect.
What the indicator is good for
Read as a measure of environmental ambition, this ranking is close to useless, and stating that plainly is more useful than qualifying it.
Read as a measure of fiscal structure, it is informative. It shows which Member States depend on consumption and energy taxation for public revenue, and those are the Member States for whom decarbonisation carries a fiscal cost as well as an economic one.
Bulgaria, Greece, Croatia and Romania all raise close to a tenth of public revenue from taxes whose base is intended to shrink. That is a budgetary problem attached to the energy transition, and it lands hardest on the Member States least able to absorb it.
Environmental taxes as a share of tax revenue, 2024
| Country | % of total tax revenue | Gap to EU averagepercentage points, derived |
|---|---|---|
| Bulgaria | 9.7 | +4.4 |
| Greece | 9.4 | +4.1 |
| Croatia | 8.7 | +3.4 |
| European Unionaggregate | 5.3 | — |
| Czechia | 4.1 | −1.2 |
| Sweden | 3.9 | −1.4 |
| Luxembourg | 2.9 | −2.4 |
This table as data: CSV · JSON
Every Member State for this indicator+
Members see every Member State for this indicator here, not only the rows the ranking prints. Become a Member
What these figures cannot tell you
- A share, not a level or a rate
- The measure divides environmental tax revenue by total tax revenue. A country with a small total tax take records a high share without taxing pollution heavily, and the reverse.
- Effective taxes erode their own base
- A tax that successfully reduces emissions also reduces its own revenue. A falling share can indicate success or neglect, and this indicator cannot separate them. Sweden's low position alongside a long-standing high carbon tax is the clearest example.
- Energy taxes dominate the category
- Most environmental tax revenue across the Union comes from energy taxes, particularly on motor fuels. The category is therefore closer to a measure of fuel taxation than of environmental policy breadth.
- Revenue, not incidence
- The indicator records what is collected, not who pays it or how the burden is distributed across households and firms.
Frequently asked questions
- How much EU tax revenue comes from environmental taxes?
- 5.3% in 2024, covering taxes on energy, transport, pollution and resources. Most of it is energy taxation, particularly on motor fuels.
- Which EU country taxes the environment most?
- By share of total tax revenue, Bulgaria at 9.7%, followed by Greece at 9.4% and Croatia and Romania at 8.7%. That reflects a narrow base of other taxes rather than strong environmental taxation.
- Why does Sweden score so low?
- Sweden records 3.9%, second-lowest in the Union, despite having one of the world's oldest and highest carbon taxes. Its total tax revenue is large, which shrinks any component's share, and an effective carbon tax reduces emissions and therefore its own revenue.
- Is a high environmental tax share good?
- Not necessarily, and the indicator is a poor measure of environmental ambition. It is more useful as a measure of fiscal structure: it identifies Member States that depend on taxes whose base the energy transition is designed to shrink.
Methodological note
Eurostat publishes environmental tax revenue as a share of total revenue from taxes and social contributions, excluding imputed social contributions. Environmental taxes cover energy, transport, pollution and resource taxes.
Values are for 2024, the most recent year with complete coverage of the 27 Member States at the extraction date.
The count of Member States above the EU share is derived by Silver Data Lab. Bulgaria's position on emissions per head comes from the greenhouse gas study elsewhere on this site, which is the only emissions series archived here; no emissions-per-unit-of-output series is held, so none is quoted. The Swedish carbon tax date and rate are matters of public record and not part of this extraction.
Source data
The underlying series can be inspected and re-downloaded from the Eurostat data browser. The filters below are the ones applied.
Share of environmental taxes in total tax revenues
sdg_17_50
- Filters applied:
- freq=A · tax=ENV · unit=PC_TSCO_X_ISCO · time=2024
- Extracted:
- 2026-08-11
- Source last updated:
- 2026-02-10
Download the data
The data the study you have just read is built on, exactly as it was downloaded and archived.
Yours as a Member.
Data downloadable by Members
How to cite
Record the vintage as well as the study: the figures on this page are the ones extracted on the dates below.
Silver Data Lab Research Desk (2026). Bulgaria Relies More on Green Taxes Than Any Other EU Country. Silver Data Lab, published 13 February 2026, last updated 11 October 2026. https://www.silverdatalab.com/studies/environmental-taxes-in-the-eu
- Data: Eurostat, Share of environmental taxes in total tax revenues (sdg_17_50), filters freq=A, tax=ENV, unit=PC_TSCO_X_ISCO, time=2024; extracted 2026-08-11; source last updated 2026-02-10. https://doi.org/10.2908/sdg_17_50
Silver Data Lab's analysis is licensed CC BY 4.0. The statistics remain their publisher's and keep its terms of reuse.
Ask the research desk
A question about this study — a definition, a filter, a break in the series, what the figures can and cannot support — answered by the desk that made the extraction.
Members can write to the research desk
Studies where the same country leads or trails
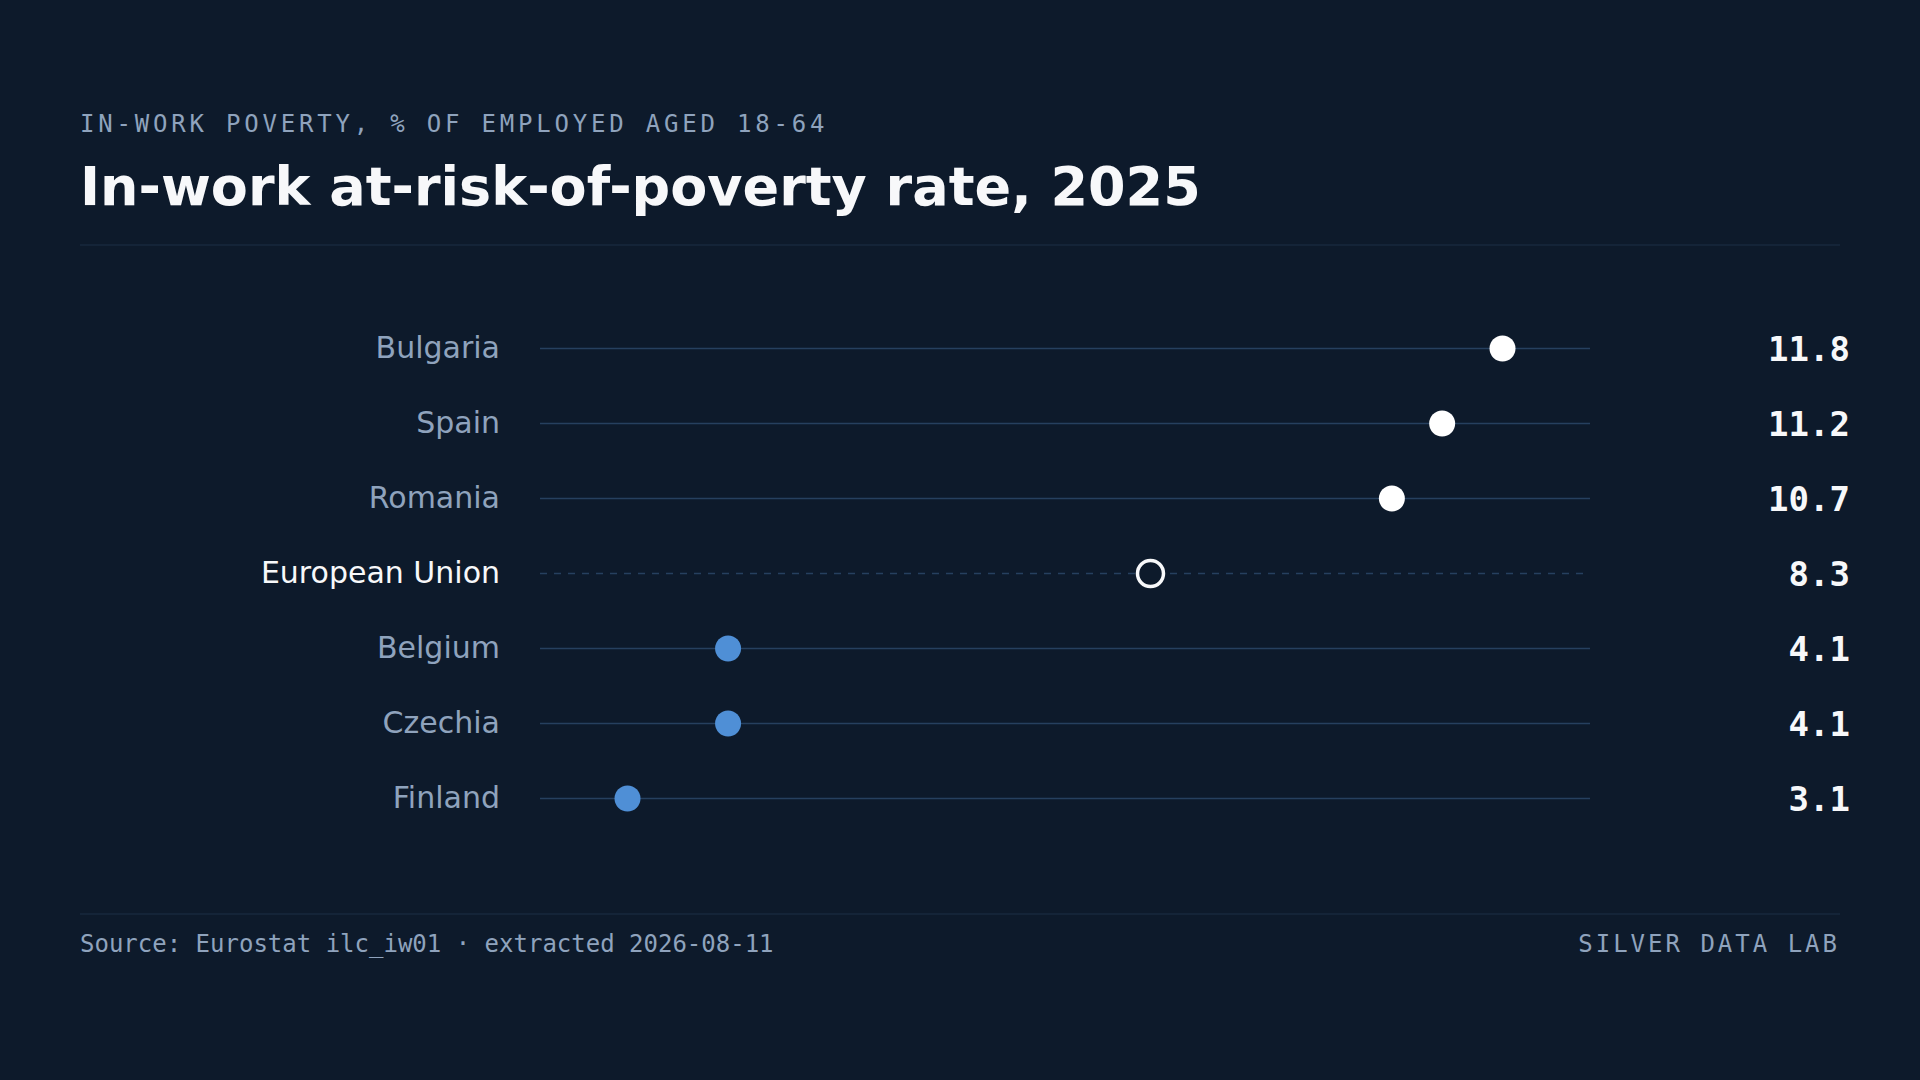
11.8% of Bulgarians With a Job Are Poor, the Highest Share in the EU
8.3% of employed people aged 18 to 64 in the EU lived below the at-risk-of-poverty line in 2025.
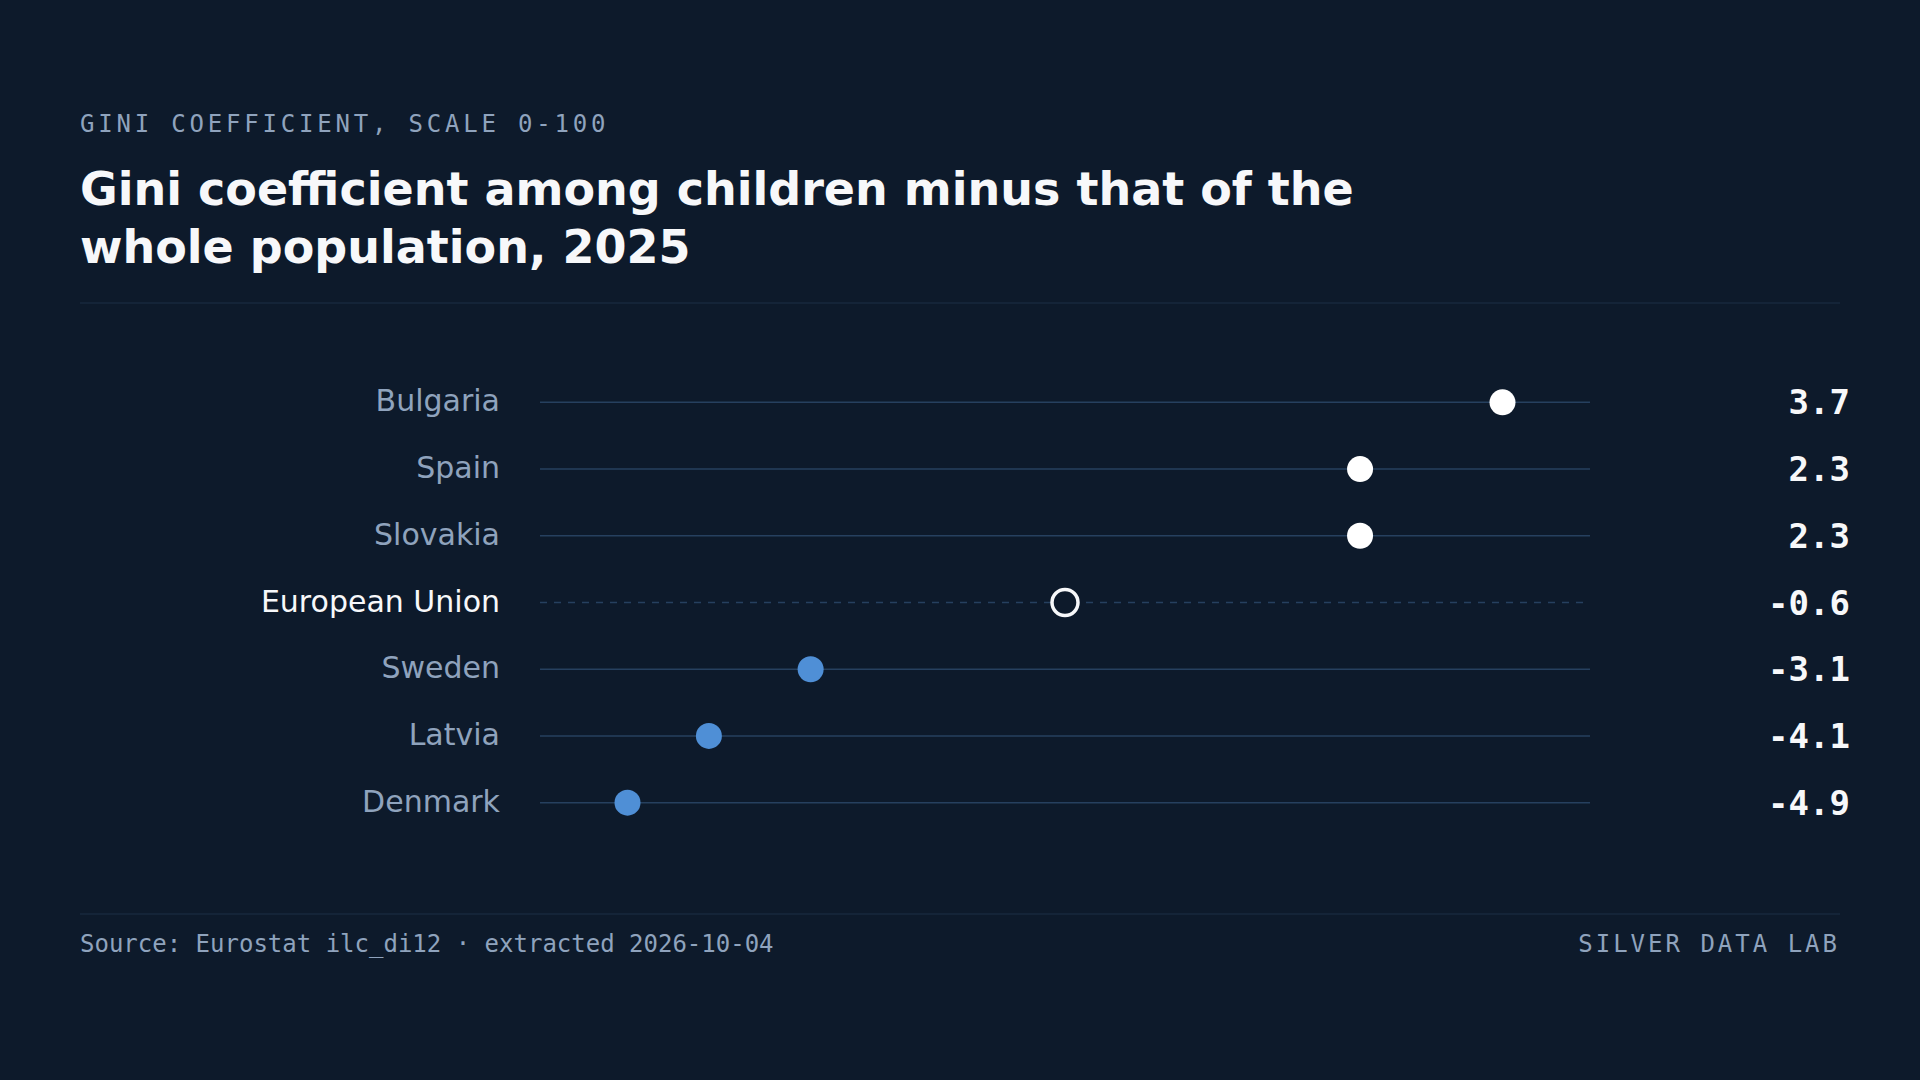
Among EU Children, Family Incomes Are Most Unequal in Bulgaria
Across the EU the Gini coefficient of disposable income among children under 18 was 28.6 in 2025, against 29.2 for the population as a whole.
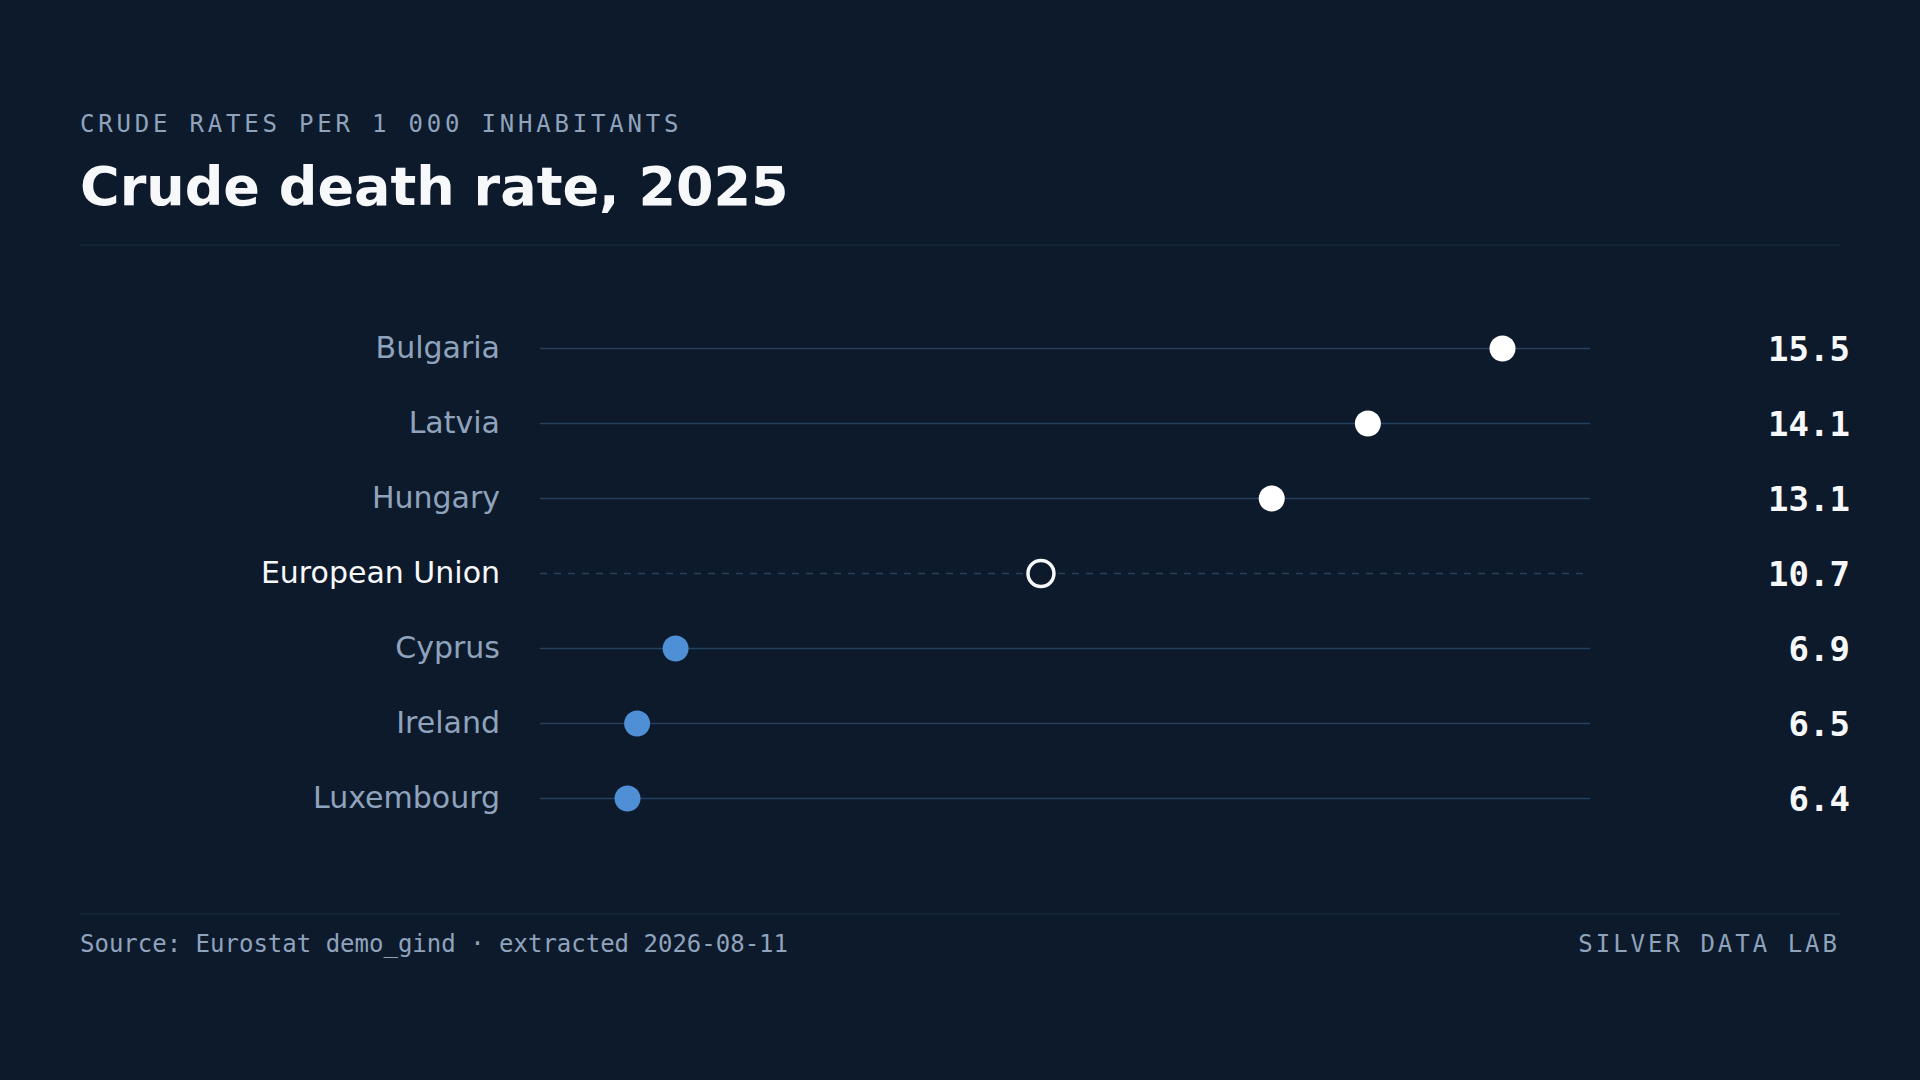
Deaths Outnumber Births in Twenty-One EU Countries
The EU recorded 7.7 births and 10.7 deaths per thousand inhabitants in 2025: a natural change of −3.0.