More EU Residence Permits Are Held for Family Reasons Than for Work
Silver Data Lab Research Desk · Statistical analysis · Published on 04 October 2026
- Data source
- Eurostat
- Reference period
- 31 December 2025
- Last updated
- 11 October 2026
Re-checked against the source on 04 October 2026. No value in its datasets has moved between the snapshots we hold. Every revision we have observed →
Key estimates
- 27,768,258 residence permits held by non-EU citizens were valid across the EU on 31 December 2025, a derived rise of 4.6% on the count a year earlier.
- Family reasons account for 32.4% of them, employment for 22.3% and education for 4.7%, each share derived from the published counts.
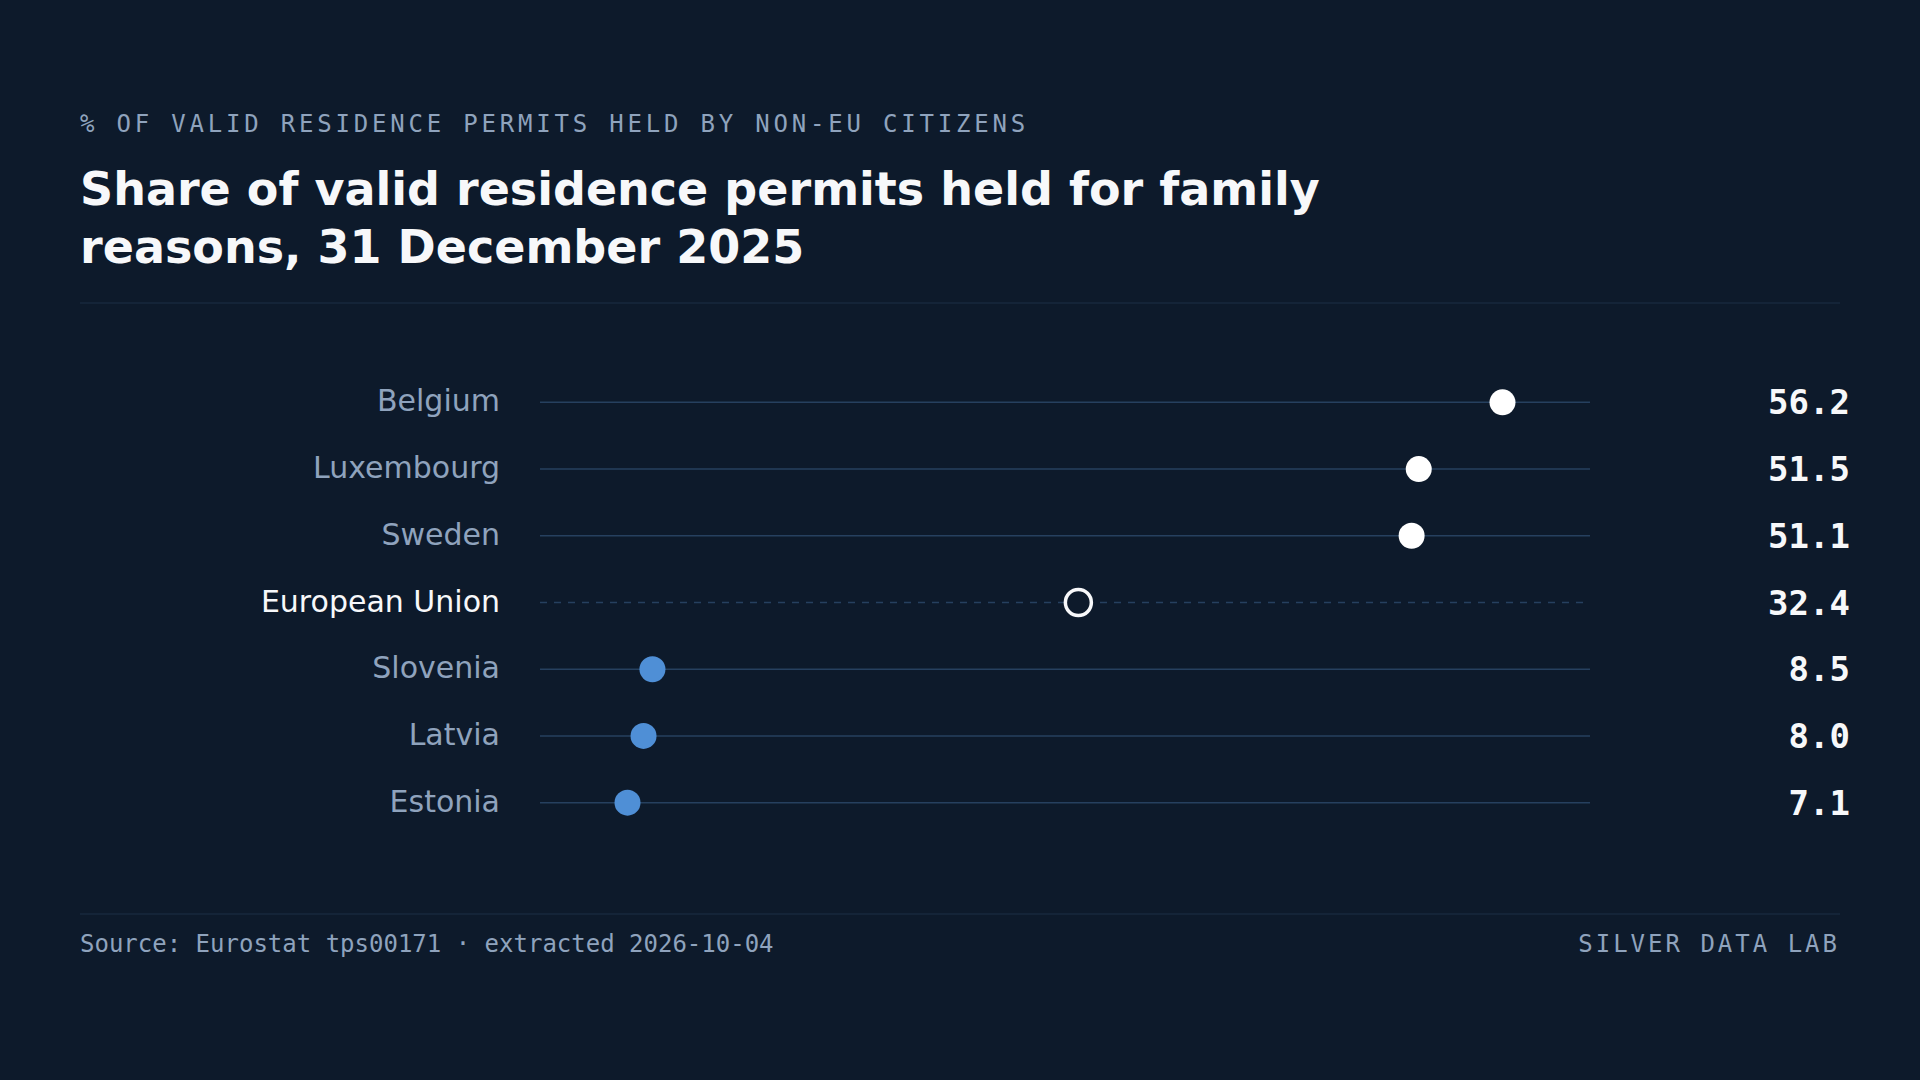
- On derived shares, family is the reason on more than half of all valid permits in Belgium (56.2%), Luxembourg (51.5%) and Sweden (51.1%).
- Work accounts for more than half in six Member States, by the same derivation: Croatia at 79.0%, Lithuania at 68.1%, Romania at 65.5%, Malta at 65.2%, Slovakia at 59.3% and Poland at 57.0%.
- In Germany, which holds 21.4% of the EU's valid permits, refugee status and subsidiary protection together account for 44.8%, a share derived from 1,398,249 and 1,263,385 permits.
Permits held, not people arriving
A residence permit is any authorisation, valid for at least three months, that allows a citizen of a country outside the EU to live legally in a Member State. Eurostat counts the people holding one that is still valid on 31 December, whether it was issued that year, renewed or changed from an earlier permit, and records the reason it was granted for.
That makes the figure a stock, everyone holding a permit on a single day, rather than a flow of arrivals over the year. Someone who arrived ten years ago and still holds a permit is in it; someone who has since become a citizen of the country is not. Citizens of other Member States need no permit and never appear. Nor do the people living in the Union under temporary protection, the status activated in 2022 for those displaced from Ukraine: Eurostat treats it as administratively different and keeps it out of every residence permit table.
On 31 December 2025 the count stood at 27,768,258, up 4.6% on a year earlier. Germany alone holds 5,935,591, France 4,419,080, Spain 4,296,727 and Italy 4,257,673; together the four account for 68.1% of the EU total, while Luxembourg's 68,865 is the smallest national figure. A raw count says how many permits a country holds, not why they were granted, so this study compares something else: the reason written on the permit.
Family before work, across the Union
Family reasons cover 9,003,763 permits, 32.4% of the EU total and the largest of the categories Eurostat aggregates for the Union. Employment follows with 6,193,012, or 22.3%, and education with 1,293,664, or 4.7%. A further 7,182,001, or 25.9%, are recorded under other reasons. The rest are permits for refugee status and for subsidiary protection, the status given to people who do not qualify as refugees but would face serious harm if returned. No EU figure exists for either on its own: Eurostat computes an EU aggregate only when every Member State reports, and Spain, Hungary, Malta and Austria do not report both. Their combined total is fixed all the same, because the published aggregate leaves it over: 4,095,818 permits, or 14.7%, which is exactly the protection permits of the Member States that do report them. Read that as what the Union identifies rather than all it holds — in Austria, Hungary and Malta the four categories above already exhaust the national total, so whatever protection those three grant is counted inside one of them.
The reason recorded is the one on the permit valid at the end of the year. A student who stays on to work and receives a work permit is counted under employment; a worker joined by a spouse adds a family permit, not a second work one.
Where most permits are for family
Belgium has the highest family share in the EU at 56.2%, followed by Luxembourg at 51.5% and Sweden at 51.1%. Those three are the only Member States where family accounts for more than half of all valid permits. Italy at 40.2%, Finland at 38.5%, Spain at 37.4% and Germany at 36.9% come next.
Family is the largest single reason in six Member States: the three above, Finland, Germany and Czechia. The Czech case is close to a tie, with 172,676 family permits against 172,327 under other reasons, a margin of 349.
At the other end, five Member States record a family share below 10%: Lithuania at 9.7%, Croatia at 9.4%, Slovenia at 8.5%, Latvia at 8.0% and Estonia at 7.1%. They reach that figure by two different routes, described below.
Where most permits are for work
In Croatia 79.0% of valid permits are held for employment, the highest share in the Union. Lithuania follows at 68.1%, Romania at 65.5%, Malta at 65.2%, Slovakia at 59.3% and Poland at 57.0%: six Member States where work accounts for more than half.
Work is the largest single reason in ten Member States, every one of them in the south or the east of the Union. Beyond the six, Hungary records 43.9%, Portugal 43.1%, Italy 42.6% and Cyprus 39.8%. Italy holds the largest number of work permits in absolute terms, 1,812,383, just ahead of its 1,712,906 family permits. In Croatia and Lithuania, by contrast, family permits are below a tenth of the total: there the low family share is the other side of a permit stock made up mostly of workers.
This site's study of the migrant employment gap looks at several of the same countries from the side of the labour market. It classifies people by country of birth, while this one counts permits by citizenship, so the two describe overlapping rather than identical populations and neither can be read as a test of the other.
Education, a small share almost everywhere
Education accounts for 4.7% of permits across the EU and for more than 10% in four Member States: Ireland at 19.0%, a figure Eurostat flags as of low reliability, Hungary at 17.5%, Slovakia at 11.3% and Finland at 10.5%. Greece at 0.3%, Croatia at 0.5% and Estonia at 0.6% record the lowest shares.
Germany, where protection outweighs family
Germany records 1,398,249 permits for refugee status and 1,263,385 for subsidiary protection. Together they make up 44.8% of Germany's valid permits, more than family's 36.9%. Of the 23 Member States that report both protection categories, it is the only one where the two combined outweigh every other reason.
Sweden follows at 20.4% for the two combined, then Belgium at 16.3%, the Netherlands at 16.0% and France at 14.4%. Spain reports refugee status but not subsidiary protection, and Hungary, Malta and Austria report neither, so their protection permits cannot be identified in the table.
Other reasons, a category with no breakdown
Other reasons cover 25.9% of permits across the EU, but in four Member States they are the majority: Estonia at 84.3%, Latvia at 83.7%, Austria at 74.3% and Slovenia at 64.1%. The table does not break the category down, so in those countries a ranking by family or work describes only a minority of the permits actually held. That is the second route to a low family share: there, a small family share may mean only that most permits carry a reason the table does not name.
Part of the category can be named. Citizens of the United Kingdom have counted as non-EU citizens since their country left the Union, and at the end of 2025 they held 919,297 valid permits, 3.3% of the EU total. Of those, 738,657 sit under other reasons, which is 10.3% of the whole category. In Spain the proportion is higher: 347,685 of its 1,877,269 permits for other reasons are held by UK citizens, 18.5%.
A larger total, a smaller family share
At the end of 2014 the EU count was 17,215,822. By the end of 2025 it had risen by 10,552,436, or 61.3%, growing in every year but one: the count at the end of 2020 was 207,553 below the one a year earlier. Over the same period the family share fell from 39.9% to 32.4%, and education permits more than doubled, from 613,449 to 1,293,664.
The largest single-year rise came between 2020 and 2021, when the total grew by 2,466,527. The transition period that followed the United Kingdom's departure ended on 31 December 2020, the date of the first of those two counts, and by the end of 2021 UK citizens held 863,242 valid permits. The increase is not theirs alone, and several national series break in other years, where a country changed how it compiles its count, so the long comparison describes direction more safely than size.
Share of valid residence permits held for family reasons, 31 December 2025
| Country | % of valid permits (derived) | Gap to EU figurepercentage points, derived |
|---|---|---|
| Belgium | 56.2 | +23.8 |
| Luxembourg | 51.5 | +19.1 |
| Sweden | 51.1 | +18.7 |
| European Unionaggregate | 32.4 | — |
| Slovenia | 8.5 | −23.9 |
| Latvia | 8.0 | −24.4 |
| Estonia | 7.1 | −25.3 |
This table as data: CSV · JSON
Every Member State for this indicator+
Members see every Member State for this indicator here, not only the rows the ranking prints. Become a Member
Embed this chart
Paste this code into a page. The frame carries the source and the extraction date, and links back to the study.
Share of valid residence permits held for employment, 31 December 2025
| Country | % of valid permits (derived) | Gap to EU figurepercentage points, derived |
|---|---|---|
| Croatia | 79.0 | +56.7 |
| Lithuania | 68.1 | +45.8 |
| Romania | 65.5 | +43.2 |
| Malta | 65.2 | +42.9 |
| Slovakia | 59.3 | +37.0 |
| Poland | 57.0 | +34.7 |
| European Unionaggregate | 22.3 | — |
| Latvia | 5.0 | −17.3 |
| Estonia | 4.2 | −18.1 |
| Austria | 3.0 | −19.3 |
This table as data: CSV · JSON
Every Member State for this indicator+
Members see every Member State for this indicator here, not only the rows the ranking prints. Become a Member
Embed this chart
Paste this code into a page. The frame carries the source and the extraction date, and links back to the study.
What these figures cannot tell you
- A count of permit-holders, not of migrants
- The table covers only non-EU citizens holding a permit valid for three months or more on 31 December. It leaves out citizens of other Member States, naturalised citizens, people staying for shorter periods and everyone under temporary protection, which Eurostat records in a separate collection. The unit is the person rather than the administrative decision, with exceptions Eurostat lists in its metadata.
- Other reasons are not the same category everywhere
- What a country files under other reasons depends on its own permit system, and the table does not break it down. The category holds the majority of permits in Estonia, Latvia, Austria and Slovenia and 3.3% of those in Germany. Spain publishes no subsidiary protection figure and Hungary, Malta and Austria no protection figures at all, so those permits cannot be told apart from the rest.
- The table's work row is empty
- tps00171 lists remunerated activities as a reason but carries no value for it in any country or year. The employment and protection shares here come from migr_resvalid, the full dataset the table is drawn from, which names the category employment and adds refugee status and subsidiary protection. The two agree exactly on every count they share for 2025.
- Breaks, flags and how the counts are compiled
- Eurostat flags every Irish value in tps00171 since 2021 as of low reliability; Ireland appears in no ranking and is named in the text only for its education share, with the flag stated. Hungary (2017), Portugal (2024) and, for other reasons, Italy (2016) carry breaks in series; Poland's 2018 values follow a different definition, Malta's 2017 values are estimated and provisional, and France's 2021 values, in the year of the largest rise, are provisional. Eurostat lists Denmark's stock of valid permits among the cases where the administrative register cannot supply the figure and an estimate is made, with an annex of its own on that data's quality. Each of these weighs on the EU totals compared across years.
Frequently asked questions
- How many non-EU citizens hold a residence permit in the EU?
- 27,768,258 valid residence permits were held by non-EU citizens on 31 December 2025. Eurostat counts the holders rather than administrative decisions, with exceptions it documents in its metadata. The figure excludes people under the temporary protection activated in 2022 for those displaced from Ukraine, whom Eurostat records in a separate collection.
- What is the most common reason for an EU residence permit?
- Family. 9,003,763 permits, or 32.4% of the EU total, were held for family reasons at the end of 2025, against 6,193,012 (22.3%) for employment and 1,293,664 (4.7%) for education; 7,182,001 (25.9%) are recorded under other reasons. The shares are derived from the published counts.
- In which EU countries are most residence permits held for work?
- Croatia, where 79.0% of valid permits are for employment, followed by Lithuania at 68.1%, Romania at 65.5%, Malta at 65.2%, Slovakia at 59.3% and Poland at 57.0%, each a derived share. Italy holds the most work permits in number, 1,812,383.
- How many residence permits in Germany are held for protection?
- Germany records 1,398,249 permits for refugee status and 1,263,385 for subsidiary protection, together 44.8% of its 5,935,591 valid permits and more than the 36.9% held for family reasons. Among the Member States that report both categories, Sweden is next at 20.4% for the two combined.
Methodological note
Eurostat counts the non-EU citizens who hold a residence permit valid on 31 December of each year, by the reason for which the permit was issued, from the administrative records of national authorities. The family share and the EU totals come from tps00171, which covers 2014 to 2025 for all 27 Member States and the EU aggregate; the employment and protection categories, and the counts for UK citizens, come from migr_resvalid, the dataset tps00171 is drawn from, for 2021 and 2025. All counts are for permits of any length of validity and citizens of all non-EU countries unless UK citizens are named. The two datasets carry identical values for the total and for family, education and other reasons in 2025.
The EU aggregate is Eurostat's own and, for 2025, equals the sum of the 27 national counts in every category for which it is published. No EU figure exists for refugee status or subsidiary protection separately. Their combined total is derived here as what the aggregate leaves over — the EU total less family, education, employment and other reasons — and checked against the sum of the national protection counts, which it equals to the person.
Silver Data Lab derived every percentage share in the study, each as one published count divided by the published total for the same country or for the EU; the combined protection share, as the sum of a country's refugee and subsidiary protection counts divided by its total; the changes in the EU total between years, in permits and in per cent; the comparison of education permits in 2014 and 2025; the shares of the EU total held by Germany, by the four largest countries and by UK citizens; the EU protection residual and its share; the UK citizens' share of other reasons; the margin between Czechia's two largest categories; and the counts of Member States above a threshold or with a given largest reason. Nothing else is computed.
Source data
This study draws on 2 datasets from Eurostat. Each can be inspected and re-downloaded from its catalogue, and the filters below are the ones applied.
All valid permits by reason on 31 December of each year
tps00171
- Filters applied:
- freq=A · duration=TOTAL · reason=TOTAL, FAM, EDUC, OCCUP, OTH · unit=PER · citizen=TOTAL
- Extracted:
- 2026-10-04
- Source last updated:
- 2026-09-28
All valid permits by reason, length of validity and citizenship on 31 December of each year
migr_resvalid
- Filters applied:
- freq=A · duration=TOTAL · reason=TOTAL, FAM, EDUC, EMP, RFG, SPROT, OTH · unit=PER · citizen=TOTAL, UK · time=2021, 2025
- Extracted:
- 2026-10-04
- Source last updated:
- 2026-09-28
Download the data
The data the study you have just read is built on, exactly as it was downloaded and archived.
Yours as a Member.
Data downloadable by Members
How to cite
Record the vintage as well as the study: the figures on this page are the ones extracted on the dates below.
Silver Data Lab Research Desk (2026). More EU Residence Permits Are Held for Family Reasons Than for Work. Silver Data Lab, published 04 October 2026, last updated 11 October 2026. https://www.silverdatalab.com/studies/residence-permits-in-the-eu
- Data: Eurostat, All valid permits by reason on 31 December of each year (tps00171), filters freq=A, duration=TOTAL, reason=TOTAL, FAM, EDUC, OCCUP, OTH, unit=PER, citizen=TOTAL; extracted 2026-10-04; source last updated 2026-09-28. https://doi.org/10.2908/tps00171
- Data: Eurostat, All valid permits by reason, length of validity and citizenship on 31 December of each year (migr_resvalid), filters freq=A, duration=TOTAL, reason=TOTAL, FAM, EDUC, EMP, RFG, SPROT, OTH, unit=PER, citizen=TOTAL, UK, time=2021, 2025; extracted 2026-10-04; source last updated 2026-09-28. https://doi.org/10.2908/migr_resvalid
Silver Data Lab's analysis is licensed CC BY 4.0. The statistics remain their publisher's and keep its terms of reuse.
Ask the research desk
A question about this study — a definition, a filter, a break in the series, what the figures can and cannot support — answered by the desk that made the extraction.
Members can write to the research desk
Studies where the same country leads or trails
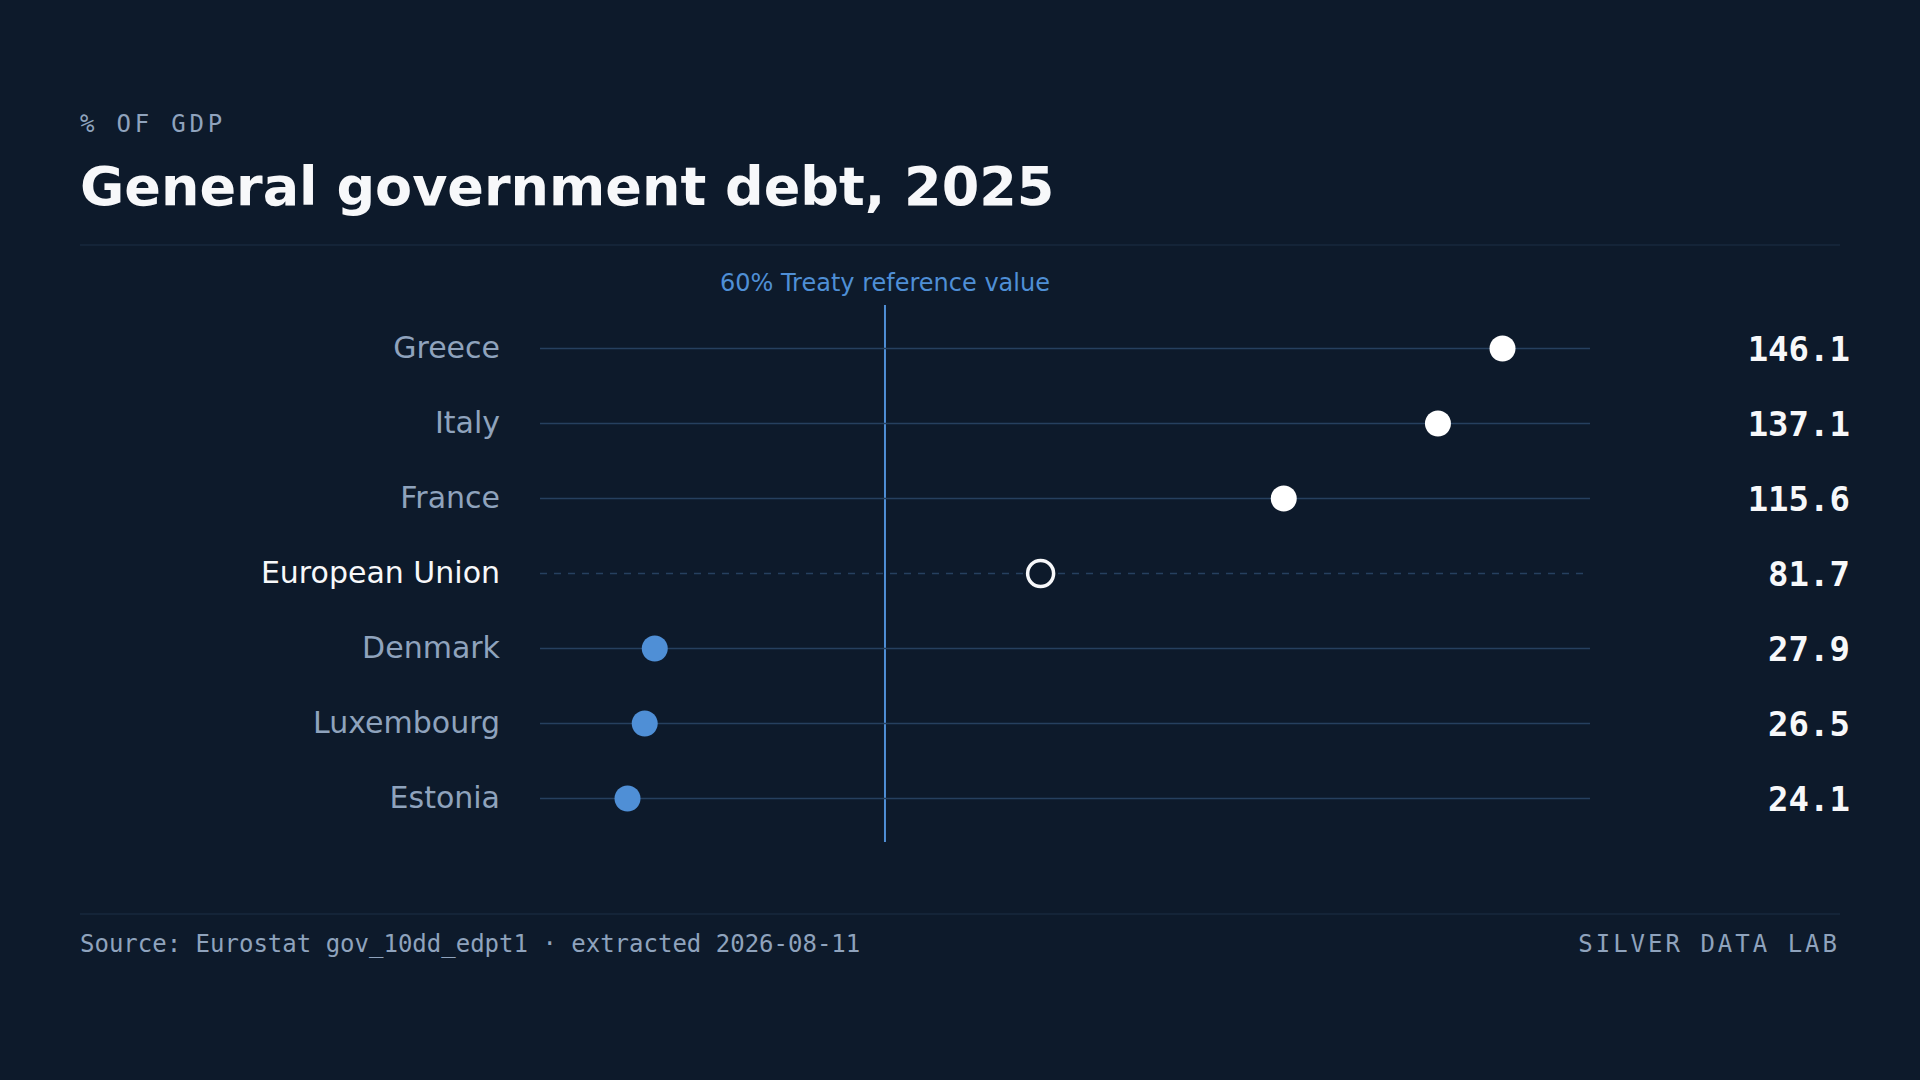
Greece Has the EU's Highest Debt Relative to GDP and a Budget Surplus
EU general government debt stood at 81.5% of GDP in 2025, against a Treaty reference value of 60%.
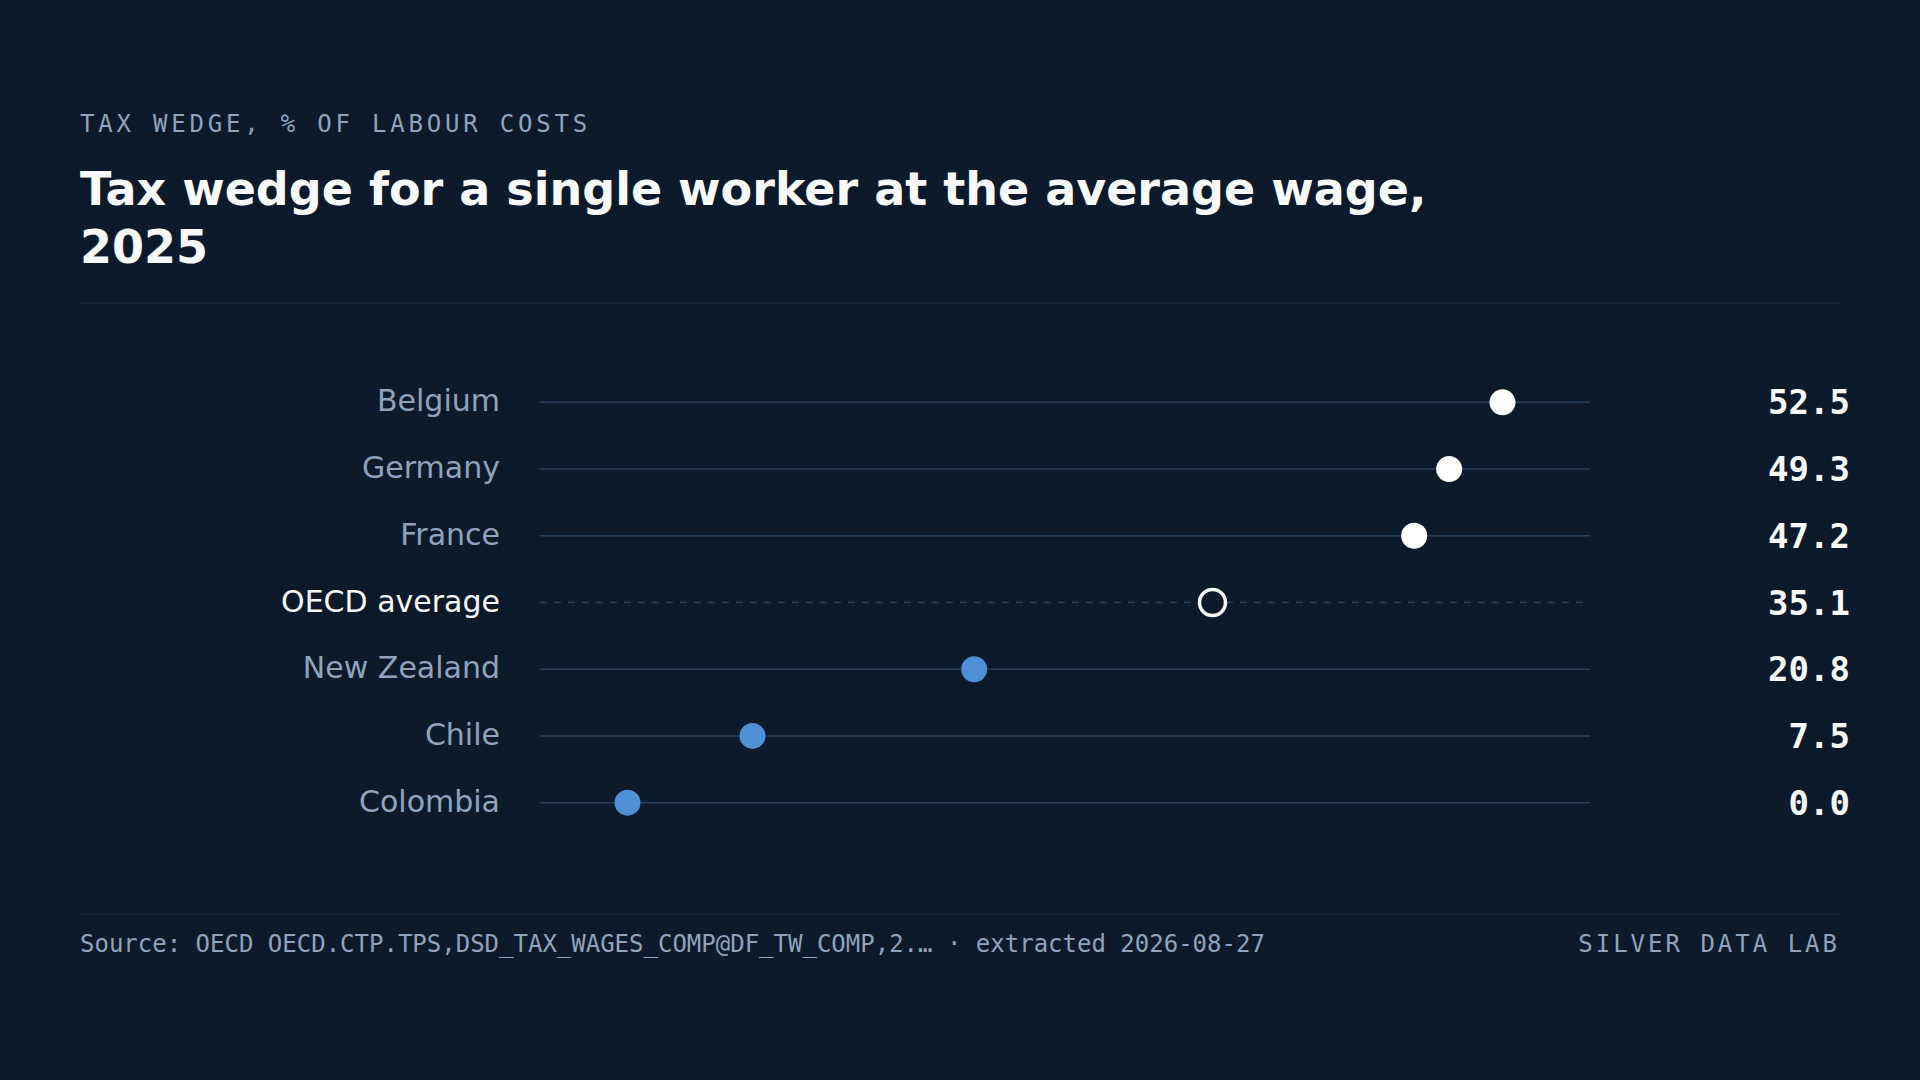
The Thirteen OECD Countries That Tax Labour Most Are All in the EU
The tax wedge — the share of total labour costs taken by income tax, social contributions and employer payroll taxes — was 41.7% for a single average-wage worker across the 22 EU members of the OECD in 2025, against an OECD average of 35.1%.
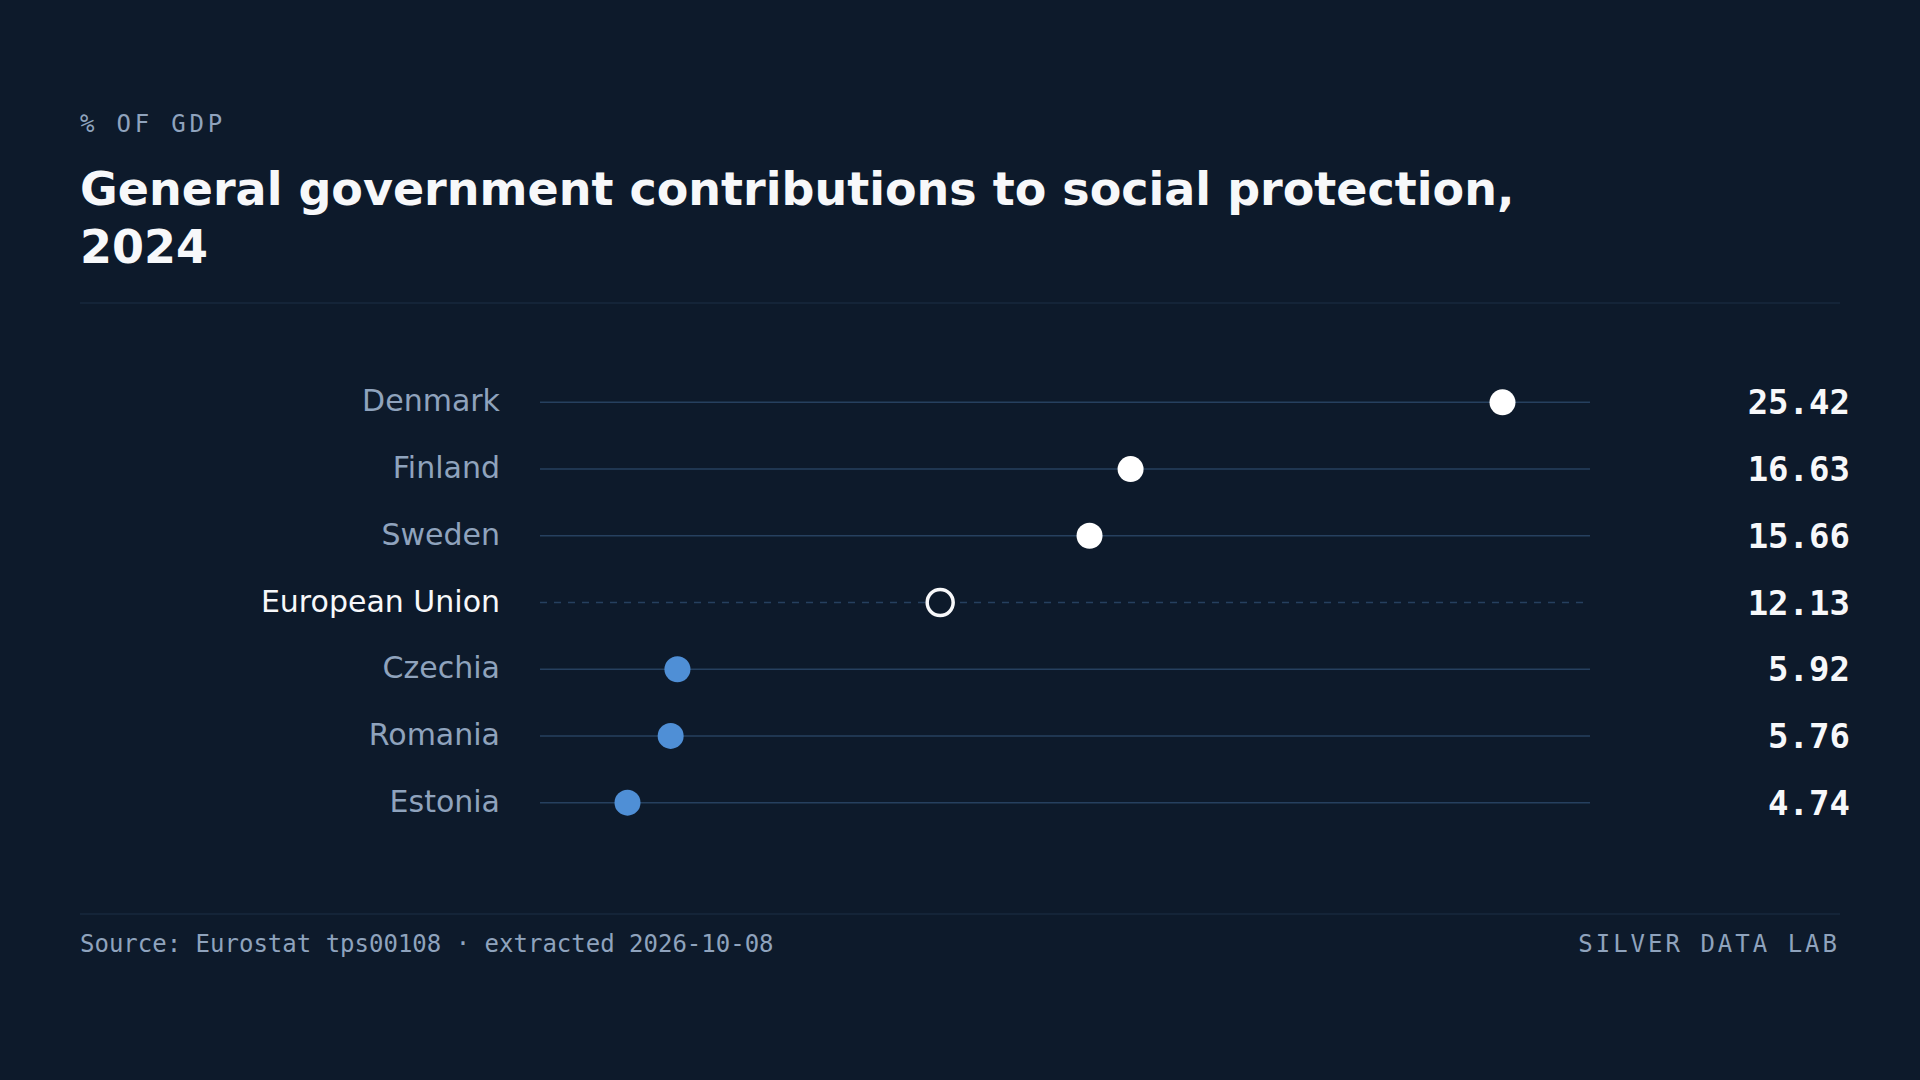
In 19 EU Countries the State Is the Single Biggest Source of Welfare Funds
Across the EU in 2024, social protection schemes received 12.13% of GDP from general government, 10.36% from employers and 6.15% from the people they cover, with a further 0.97% from other receipts; all four EU figures are provisional.