In 19 EU Countries the State Is the Single Biggest Source of Welfare Funds
Silver Data Lab Research Desk · Statistical analysis · Published on 04 October 2026
This study is open to members only
Its sources, filters and extraction date are declared above, as they are for every study. Sign in to read the analysis in full.
- Data source
- Eurostat
- Reference period
- 2024
- Last updated
- 11 October 2026
Re-checked against the source on 08 October 2026. 53 values in its datasets moved between snapshots, 12 of them figures stated on this page. Every revision we have observed →
Key estimates
- Across the EU in 2024, social protection schemes received 12.13% of GDP from general government, 10.36% from employers and 6.15% from the people they cover, with a further 0.97% from other receipts; all four EU figures are provisional.
- Denmark's general government contributions reach 25.42% of GDP, the highest in the Union, and supply 77.6% of what Danish schemes receive, the largest state share in the EU on a derived calculation.
- Estonian employers provide 71.3% of their country's social protection receipts, a derived share far above Czechia's 48.0%, the next highest; measured against GDP, Estonia's 12.46% comes second to France's provisional 13.48%.
- Romania collects 10.95% of GDP from protected persons, the most in the Union and 59.4% of its receipts on the derived shares, and 1.66% from employers, the least.
- General government is the largest of the four sources in 19 Member States, employers in six and protected persons in two, Romania and Slovenia: counts derived from the published values, some of them provisional.
Four sources of money
Every Member State runs social protection schemes: the pensions, health insurance, sickness and disability benefits, family allowances and unemployment benefits that together make up a welfare state. Eurostat records what those schemes receive under ESSPROS, the European System of integrated Social Protection Statistics, a common set of accounts to which every Member State reports. The money is sorted into four types according to who provides it, and each type is expressed as a share of the country's GDP.
The four are employers' social contributions; the contributions of protected persons, meaning the employees, self-employed people, pensioners and others who pay into the schemes that cover them; general government contributions, the money public authorities put into the schemes from taxes earmarked for the purpose or from general revenue; and other receipts, which cover property income, meaning the interest, dividends and rents the schemes earn on what they own, together with miscellaneous items.
Across the EU in 2024, general government put in 12.13% of GDP, employers 10.36%, protected persons 6.15% and other receipts 0.97%, all four of them provisional. Added together they come to 29.61% of GDP, a sum computed here, and every share of receipts quoted on this page is derived the same way, by dividing one type by that sum. The state is the biggest single payer, with 41.0% of the total, yet the two kinds of social contribution, added together in the same way, bring in 16.51% of GDP, or 55.8% of receipts. Taken as a whole, the Union still pays for social protection mainly through contributions rather than out of the public budget.
Behind the EU figure the national mixes diverge widely. At the edges of the table sit three countries, each leaning on a different payer.
Denmark: the public budget pays
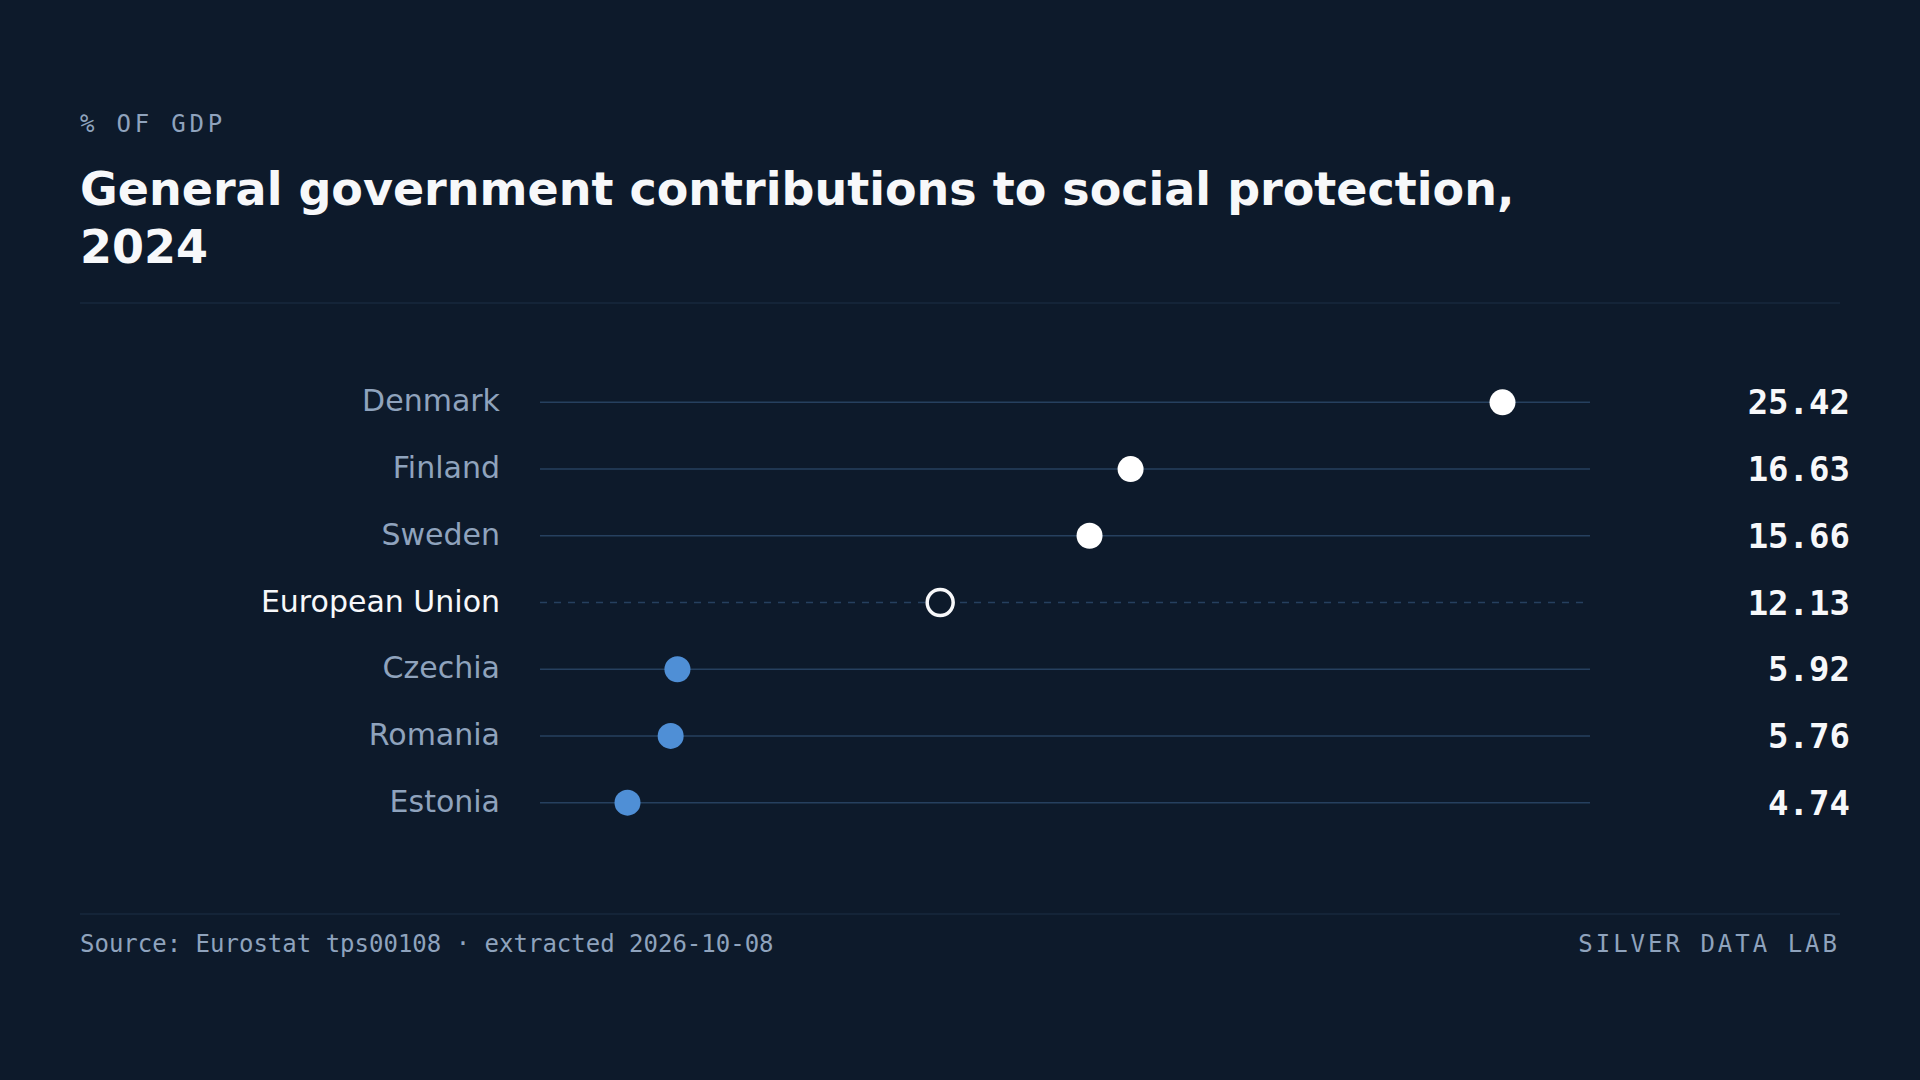
Denmark's general government contributions reach 25.42% of GDP, the highest figure in the Union; Finland is second at 16.63%. Danish employers contribute 3.91% of GDP and protected persons 2.62%, so the state supplies 77.6% of everything the Danish schemes receive, the largest share in the EU on the derived figures.
Finland and Sweden, the next two in absolute terms with Sweden at a provisional 15.66%, do not resemble Denmark. Swedish employers pay 11.89% of GDP, also provisional and the third-highest employer contribution in the EU, and Finnish employers 9.86%. In each, the state provides roughly half of receipts: 50.7% in Sweden and 49.9% in Finland.
Measured by share rather than by size, Denmark's nearest neighbour is Malta. Maltese general government contributions are a modest 9.75% of GDP, but the schemes there receive so little from anyone else that the state's part comes to 72.8% of the total. Ireland follows at 59.3%. Denmark, Malta, Ireland, Sweden and Italy are the only five Member States where the state provides more than half of receipts, and the last two cross that line on provisional values: Italy's share is 50.5%. Finland is the nearest country below it.
In six Member States the state on its own outweighs both kinds of contribution put together: Denmark, Finland, Ireland, Italy, Malta and Sweden.
Estonia: the employer pays
Estonian employers contribute 12.46% of GDP. That is not the highest figure in the Union: French employers pay 13.48%, a provisional value, and Sweden's 11.89% comes third. What sets Estonia apart is how little arrives from anyone else. Estonian protected persons pay 0.26% of GDP, the lowest figure in the Union, and the Estonian state 4.74%, also the lowest, so employers supply 71.3% of what Estonia's schemes receive, a derived share. No other Member State draws even half of its receipts from employers: Czechia comes closest at 48.0%, then Slovakia at 47.4%. France, for all the size of its employer contribution, takes 39.1% of its receipts from employers, a share computed from provisional values, because its state puts in more still, a provisional 14.80% of GDP.
Employers are the largest of the four sources in six Member States: Estonia, Czechia, Slovakia, Poland, Germany and the Netherlands. Spain was on that list for 2023 by four hundredths of a percentage point and leaves it for 2024 by fifteen hundredths, with 11.29% of GDP from the state against 11.14% from employers, both provisional. A margin that thin can be reversed by a revision.
The three lowest employer contributions are Romania's 1.66% of GDP, Malta's 2.37% and Lithuania's 2.88%. In Romania and Lithuania most contributions are recorded in the protected persons' column instead: 10.95% and 6.73% of GDP, both above the EU's 6.15%.
Romania and Slovenia: the insured pay
Romania collects 10.95% of GDP from protected persons, more than any other Member State, and they provide 59.4% of its schemes' receipts, also the highest share. Slovenia, at 9.50% of GDP and 39.7% of receipts, is the only other country where protected persons are the largest source. Germany's protected persons pay 9.86%, the second-highest amount and a provisional one, but German employers pay more, at 11.07%, also provisional.
Protected persons outpay employers in five Member States: Croatia, Hungary, Lithuania, Romania and Slovenia. In Cyprus and Luxembourg employers stay ahead by about a tenth of a point or less. At the bottom sit Ireland at 1.78%, Malta at 0.82% and Estonia at 0.26%.
Germany is the case of balance. On shares derived from its provisional figures, employers provide 34.2% of German receipts, the state 33.4% and protected persons 30.5%: of all 27, Germany shows the narrowest distance between the largest and the smallest of the three main sources, a spread of 3.7 percentage points against 7.5 in the Netherlands, the next most even.
The split can change within a year
Romania did not always look like this. In 2017 Romanian employers paid 6.76% of GDP and protected persons 4.48%. In 2018 the employers' figure was 1.93% and the protected persons' 10.28%. Added together, the two moved far less, from 11.24% to 12.21% of GDP, figures computed here.
Lithuania took a similar step a year later. Employers' contributions there fell from 9.30% of GDP in 2018 to 2.63% in 2019, while protected persons' contributions rose from 3.17% to 6.82% and general government contributions from 4.43% to 7.96%.
The table records these changes, not their causes. What it does establish is that the line between what employers pay and what the insured pay can shift by several points of GDP from one year to the next. That is the reason this page reads the two kinds of contribution together as well as apart: a ranking of employers' contributions alone can reorder countries without any change in how much their schemes collect.
The size of the total is another matter
What a country's schemes receive in total is a separate question from who supplies it. On the four types added together, French schemes receive 34.50% of GDP, a sum of provisional values, Finnish 33.36% and Dutch 33.04%, the three largest totals. Maltese schemes receive 13.39%, Irish 14.42% and Hungarian 16.49%, the three smallest.
Ireland's figure needs its denominator attached. Irish GDP includes profits and intellectual-property income of multinational groups with little counterpart in domestic activity, so any ratio to it understates the domestic effort. The shares used above do not depend on GDP, which is why Ireland's 59.3% from the state can be set beside Denmark's 77.6% even where the ratios to GDP cannot.
Other receipts are the smallest of the four types in every Member State, and 0.97% of GDP across the EU. They count for most in the Netherlands, at 4.49% of GDP and 13.6% of Dutch receipts, the highest share in the Union, followed by Cyprus at 2.47% of GDP and 11.0% of receipts.
General government contributions to social protection, 2024
| Country | % of GDP | Gap to EU averagepercentage points, derived |
|---|---|---|
| Denmark | 25.42 | +13.3 |
| Finland | 16.63 | +4.5 |
| Sweden | 15.66p | +3.5 |
| European Unionaggregate | 12.13p | — |
| Czechia | 5.92 | −6.2 |
| Romania | 5.76 | −6.4 |
| Estonia | 4.74 | −7.4 |
Flags carried by the source on these values: p provisional
This table as data: CSV · JSON
Every Member State for this indicator+
Members see every Member State for this indicator here, not only the rows the ranking prints. Become a Member
Employers' social contributions, 2024
| Country | % of GDP | Gap to EU averagepercentage points, derived |
|---|---|---|
| France | 13.48p | +3.1 |
| Estonia | 12.46 | +2.1 |
| Sweden | 11.89p | +1.5 |
| European Unionaggregate | 10.36p | — |
| Lithuania | 2.88 | −7.5 |
| Malta | 2.37 | −8.0 |
| Romania | 1.66 | −8.7 |
Flags carried by the source on these values: p provisional
This table as data: CSV · JSON
Every Member State for this indicator+
Members see every Member State for this indicator here, not only the rows the ranking prints. Become a Member
Social contributions paid by protected persons, 2024
| Country | % of GDP | Gap to EU averagepercentage points, derived |
|---|---|---|
| Romania | 10.95 | +4.8 |
| Germany | 9.86p | +3.7 |
| Slovenia | 9.50 | +3.4 |
| European Unionaggregate | 6.15p | — |
| Ireland | 1.78 | −4.4 |
| Malta | 0.82 | −5.3 |
| Estonia | 0.26 | −5.9 |
Flags carried by the source on these values: p provisional
This table as data: CSV · JSON
Every Member State for this indicator+
Members see every Member State for this indicator here, not only the rows the ranking prints. Become a Member
Share of social protection receipts provided by general government, 2024
| Country | % of receipts, derived | Gap to EU averagepercentage points, derived |
|---|---|---|
| Denmark | 77.6 | +36.6 |
| Malta | 72.8 | +31.8 |
| Ireland | 59.3 | +18.3 |
| European Unionaggregate | 41.0 | — |
| Czechia | 28.3 | −12.7 |
| Slovenia | 27.5 | −13.5 |
| Estonia | 27.1 | −13.9 |
This table as data: CSV · JSON
Every Member State for this indicator+
Members see every Member State for this indicator here, not only the rows the ranking prints. Become a Member
Share of social protection receipts provided by employers, 2024
| Country | % of receipts, derived | Gap to EU averagepercentage points, derived |
|---|---|---|
| Estonia | 71.3 | +36.3 |
| Czechia | 48.0 | +13.0 |
| Slovakia | 47.4 | +12.4 |
| European Unionaggregate | 35.0 | — |
| Lithuania | 15.4 | −19.6 |
| Denmark | 11.9 | −23.1 |
| Romania | 9.0 | −26.0 |
This table as data: CSV · JSON
Every Member State for this indicator+
Members see every Member State for this indicator here, not only the rows the ranking prints. Become a Member
What these figures cannot tell you
- Receipts, not spending
- The table records the money social protection schemes take in during a year, not what they pay out or on which benefits. A scheme can receive more or less than it spends in a given year, so these figures describe how protection is funded and should not be read as the size of the welfare state.
- A ratio to GDP moves with GDP
- Every value is divided by the country's GDP. Where GDP is swollen by multinational profit and intellectual-property flows, as in Ireland, the ratios look small; in a year when output falls they rise without anyone paying more. The shares of receipts quoted on this page are derived from the four published values and do not depend on GDP.
- Who is recorded as paying is not who bears the cost
- ESSPROS assigns a contribution to whoever pays it into the scheme. An employer's contribution and an employee's contribution can be two labels for the same cost of a job, and the Romanian and Lithuanian series show the split between them moving by several points of GDP within a year. Comparisons of employers' contributions alone are fragile for that reason.
- Provisional and estimated values, and two series breaks
- The EU aggregate is provisional from 2020 to 2024, and its three main types are estimated for 2013 to 2019. The 2024 values for Germany, Greece, Spain, France, Italy and Sweden are provisional and Latvia's are estimated, so several findings here rest on figures Eurostat may still revise: France's lead among employers, the shares of more than half from the state in Sweden and Italy, Spain's state ahead of its employers, and the balance described for Germany. Hungary's series, and the EU's other receipts, carry a break in 2015, so values before and after that year are not fully comparable; no comparison on this page spans it.
Frequently asked questions
- How is social protection financed in the EU?
- In 2024 the schemes received 12.13% of GDP from general government, 10.36% from employers, 6.15% from protected persons and 0.97% from other receipts, all four provisional at EU level. The state is the largest single payer, at 41.0% of receipts on the derived shares, but employers' and protected persons' contributions together provide 55.8%.
- Which EU country relies most on the public budget for social protection?
- Denmark. Its general government contributions were 25.42% of GDP in 2024, the highest in the EU, and 77.6% of what Danish schemes received, a share derived from the four published values. On that share Malta follows at 72.8% and Ireland at 59.3%; Sweden at 50.7% and Italy at 50.5% also pass half, both on provisional figures.
- Where do employers pay the most social contributions?
- Against GDP, in France, at 13.48% in 2024, a provisional figure, followed by Estonia at 12.46% and Sweden at a provisional 11.89%; the lowest are Romania at 1.66%, Malta at 2.37% and Lithuania at 2.88%. As a share of what the schemes receive, Estonia is far ahead: its employers provide 71.3% of receipts, a derived share, against 48.0% in Czechia, the next highest.
- Do employees or employers pay more towards social protection?
- Across the EU employers do: 10.36% of GDP in 2024 against 6.15% from protected persons, both provisional, the latter including employees, the self-employed and pensioners. Protected persons pay more than employers in five Member States, Croatia, Hungary, Lithuania, Romania and Slovenia, and the gap is widest in Romania, at 10.95% against 1.66%.
Methodological note
Eurostat's table of social protection receipts by type gives, for each country and year, what all social protection schemes together received from four sources — employers' social contributions, protected persons' social contributions, general government contributions and other receipts — each as a percentage of GDP. The data are compiled under ESSPROS and cover 2013 to 2024.
The rankings and the text use 2024, the latest year, complete for all 27 Member States and the EU aggregate since Eurostat's release of 7 October 2026. Earlier years appear only where the text describes a change: 2023 for the order of the two largest sources in Spain, and 2017 to 2019 for Romania and Lithuania. The EU figures are Eurostat's own aggregate, used as published.
Silver Data Lab derived the following from the published values and nothing else: the sum of the four receipt types for each country and for the EU; each type's share of that sum, which gives the two rankings of general government and employer shares and the shares of protected persons and other receipts quoted in the text; the counts of Member States in which a given source is the largest, provides more than half of receipts, or exceeds another source; the combined social contributions, employers' plus protected persons', and their share of receipts; the margins between two sources quoted for Spain, Cyprus and Luxembourg, and the comparison of the protected persons' margin over employers that places Romania's as the widest; and the distance between the largest and smallest shares of the three main sources quoted for Germany and the Netherlands. The table publishes no total of its own. Because each type is published rounded to two decimals, a sum computed here carries a rounding error of up to two hundredths of a point; shares are rounded to one decimal.
Source data
The underlying series can be inspected and re-downloaded from the Eurostat data browser. The filters below are the ones applied.
Social protection receipts by type as percentage of GDP
tps00108
- Filters applied:
- freq=A · unit=PC_GDP · sptype=SCO_EMPL, SCO_PER_PRO, GOV_GEN, REC_OTH
- Extracted:
- 2026-10-08
- Source last updated:
- 2026-10-07
Download the data
The data the study you have just read is built on, exactly as it was downloaded and archived.
Yours as a Member.
Data downloadable by Members
How to cite
Record the vintage as well as the study: the figures on this page are the ones extracted on the dates below.
Silver Data Lab Research Desk (2026). In 19 EU Countries the State Is the Single Biggest Source of Welfare Funds. Silver Data Lab, published 04 October 2026, last updated 11 October 2026. https://www.silverdatalab.com/studies/social-protection-financing-in-the-eu
- Data: Eurostat, Social protection receipts by type as percentage of GDP (tps00108), filters freq=A, unit=PC_GDP, sptype=SCO_EMPL, SCO_PER_PRO, GOV_GEN, REC_OTH; extracted 2026-10-08; source last updated 2026-10-07. https://doi.org/10.2908/tps00108
Silver Data Lab's analysis is licensed CC BY 4.0. The statistics remain their publisher's and keep its terms of reuse.
Ask the research desk
A question about this study — a definition, a filter, a break in the series, what the figures can and cannot support — answered by the desk that made the extraction.
Members can write to the research desk
Studies where the same country leads or trails
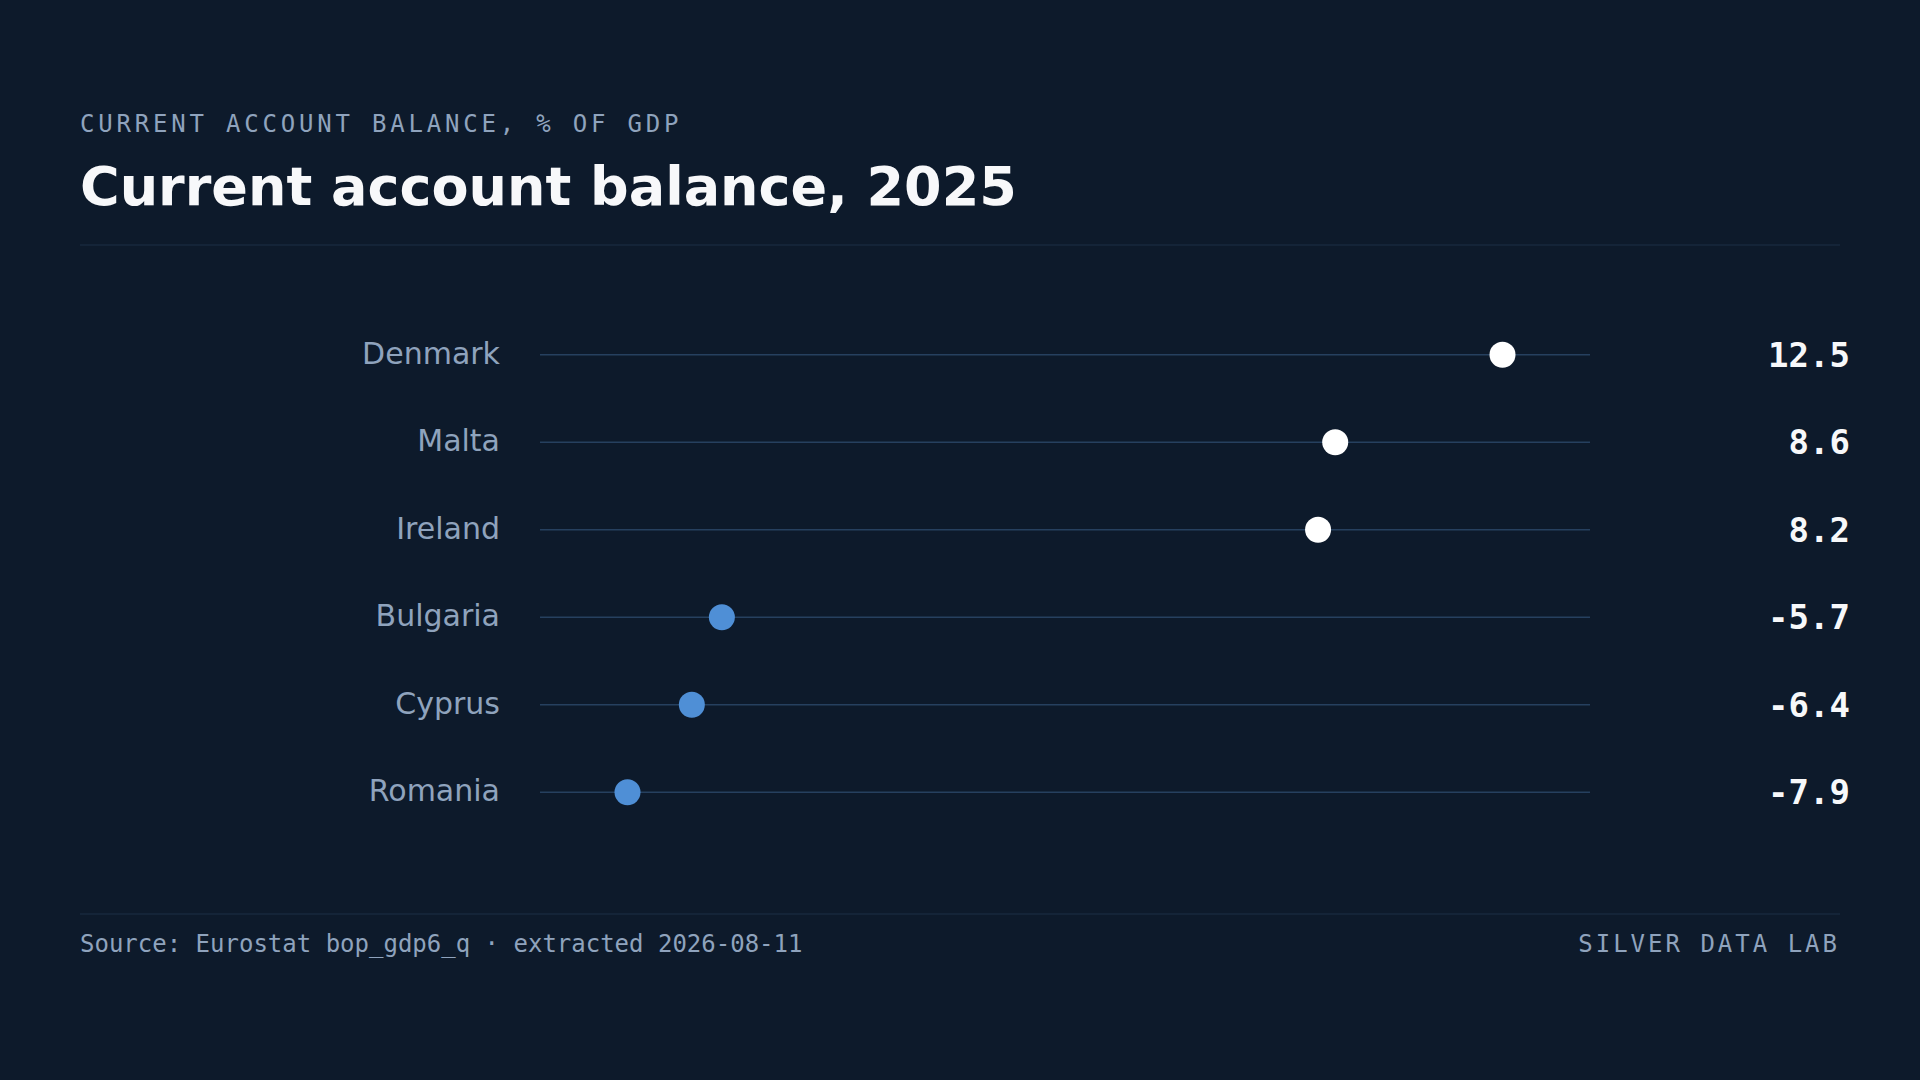
Denmark Has the EU's Biggest Surplus With the World, at 12.3% of GDP
Denmark ran a current account surplus worth 12.3% of GDP in 2025, the largest in the Union.
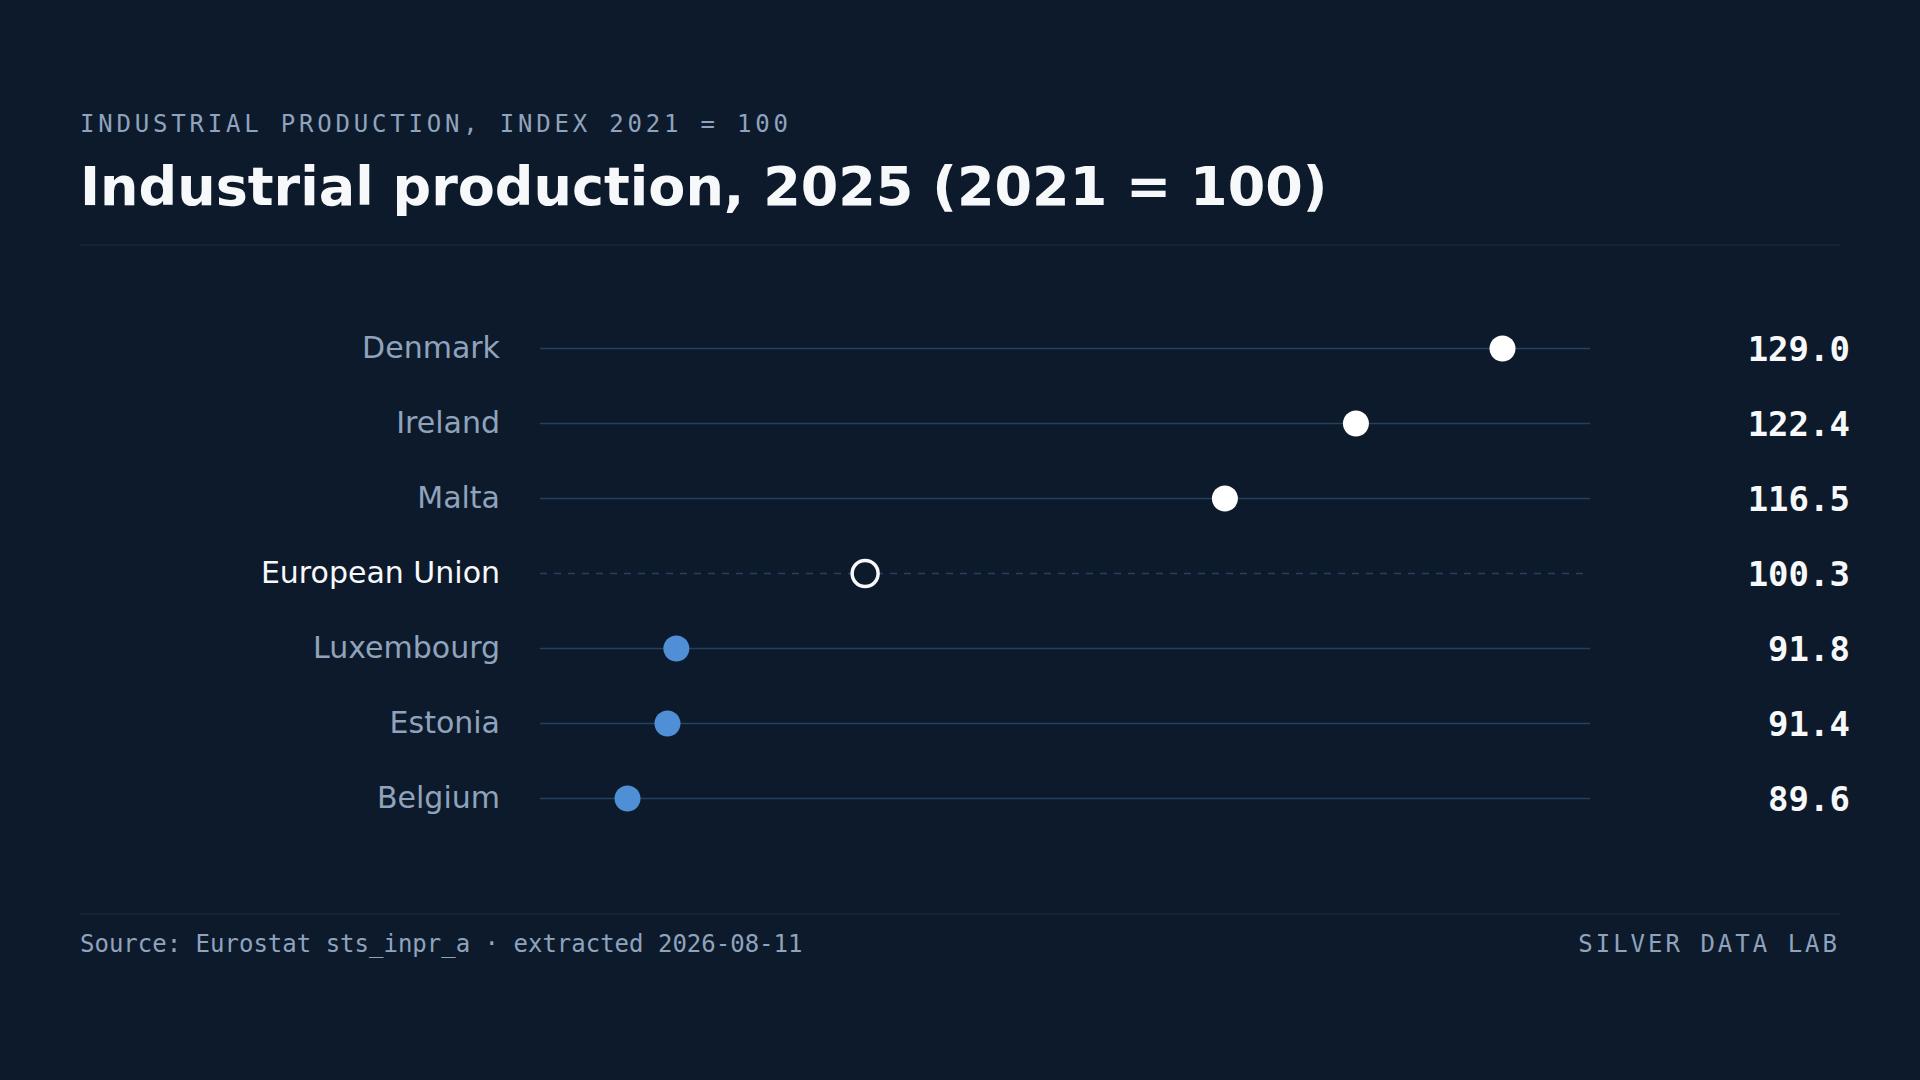
EU Industrial Output Is Where It Was Four Years Ago
EU industrial production in 2025 stood at 100.4 against a 2021 base of 100 — output is essentially unchanged after four years.
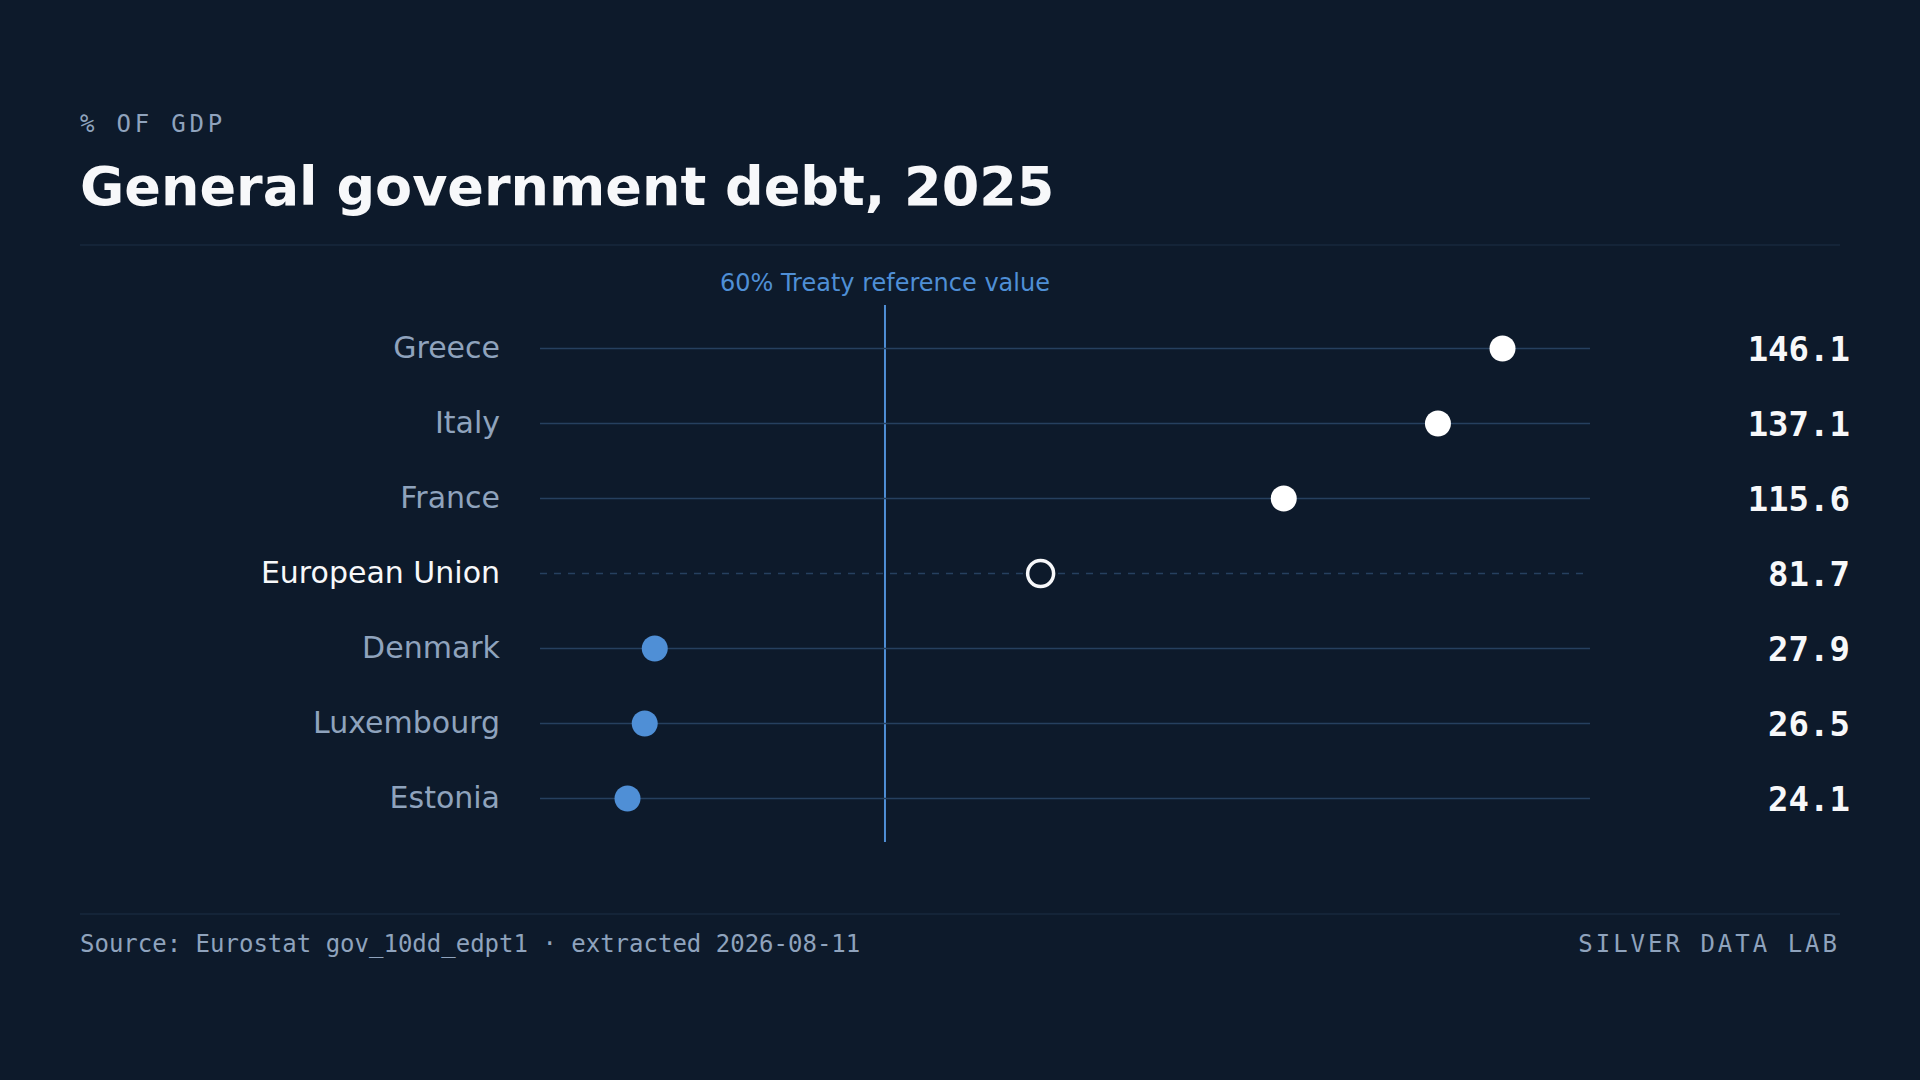
Greece Has the EU's Highest Debt Relative to GDP and a Budget Surplus
EU general government debt stood at 81.5% of GDP in 2025, against a Treaty reference value of 60%.