Only 9.1% of Romanian Vocational Graduates Had a Month's Workplace Training
Silver Data Lab Research Desk · Statistical analysis · Published on 25 October 2026
This study is open to members only
Its sources, filters and extraction date are declared above, as they are for every study. Sign in to read the analysis in full.
- Data source
- Eurostat
- Reference period
- 2025
- Last updated
- 25 October 2026
Re-checked against the source on 25 October 2026. No value in its datasets has moved between the snapshots we hold. Every revision we have observed →
Key estimates
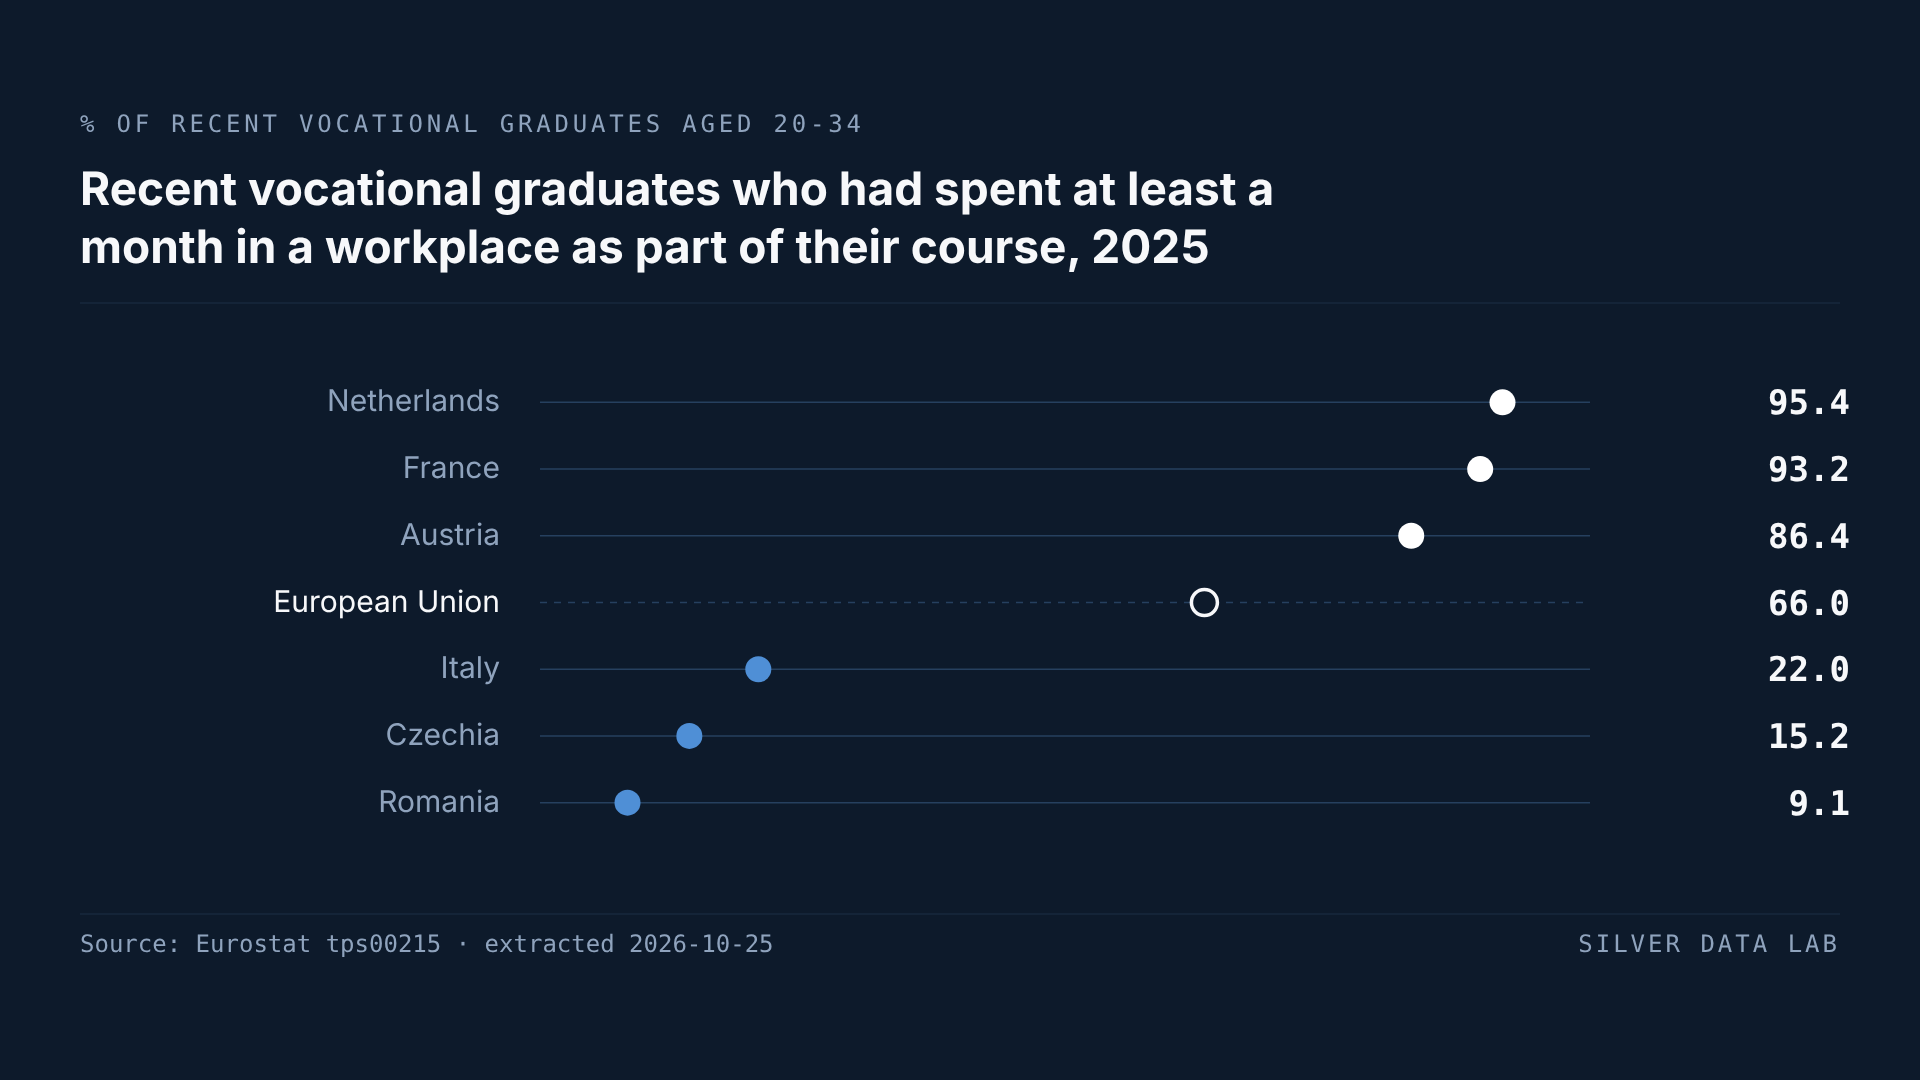
- In 2025, 9.1% of Romania's recent vocational graduates aged 20 to 34 had spent at least a month in a real workplace as part of their course, and Romania has had the lowest share of any Member State with a published figure in every year since 2021.
- In the Netherlands the share is 95.4%, more than ten times Romania's by derived ratio; across the EU it is 66.0%, about two recent vocational graduates in three.
- Of the 17 Member States whose 2025 figure Eurostat does not flag as of low reliability, nine are above the EU figure and eight below it: France at 93.2% and Austria at 86.4% follow the Netherlands, and Czechia at 15.2% and Italy at 22.0% are the lowest after Romania.
- Among those 17, placements of seven months or more are the larger part only in the Netherlands, Austria and Denmark, where 83.5%, 72.2% and 68.3% of recent vocational graduates had one, Denmark's value marking a break in its series; in the other 14, placements of one to six months make up more than half of the share, by derived comparison.
- Italy's share fell from 31.8% in 2021 to 22.0% in 2025 without rising in any year, a derived fall of 9.8 points and the largest among the ten Member States whose series has no break or reliability flag since 2021; Lithuania's rose most, from 48.7% to 62.1%.
From nearly all to fewer than one in ten
In 2025, 9.1% of Romania's recent vocational graduates had spent at least a month working in a real workplace as part of their course. In the Netherlands the figure was 95.4%, more than ten times as high: the ratio between the two, 10.5, is derived here from the shares Eurostat publishes. Across the European Union it was 66.0%, about two recent vocational graduates in three. The shares are Eurostat's; every ratio, every change between years and every count of Member States on this page is Silver Data Lab's arithmetic on them.
Who the figures describe
Vocational courses are the ones that prepare people for a particular occupation or trade, rather than general schooling. The population here is people aged 20 to 34 whose highest qualification is a vocational one from the later years of secondary education, or from a course taken after them that falls short of higher education, and who obtained it in the three years before they were interviewed. Eurostat counts them whether or not they have gone on to further education or training since, so the figure describes people who hold the qualification, not people still working towards it.
What counts is a placement: work experience at a workplace, in a company, a public body or a non-profit organisation, that formed part of the programme leading to the qualification and lasted at least a month. Whether it was compulsory or chosen makes no difference. Practical training given entirely inside a school does not count, however much of it a course contains. Eurostat calls the result the exposure of vocational graduates to work-based learning.
The figures come from the EU Labour Force Survey, which interviews people living in private households in every Member State, so each share is an estimate drawn from a sample.
Where a placement is the norm, and where it is not
Seventeen Member States have a 2025 figure that Eurostat does not flag as of low reliability, and every count and ranking below is taken over them. The Netherlands comes first at 95.4%, ahead of France at 93.2% and Austria at 86.4%. Portugal records 80.9%, Denmark 79.9%, a value that marks a break in its series, and Finland 79.6%, so six of the 17 are above 75%. Slovenia at 72.0%, Estonia at 68.2% and Sweden at 67.3% complete the nine above the EU figure.
Eight are below it. Lithuania records 62.1%, and Belgium at 51.6% and Slovakia at 50.7% sit just above one in two. Croatia's share is 38.7% and Greece's 25.8%. Italy at 22.0%, Czechia at 15.2% and Romania at 9.1% are the three lowest. Romania's share has stayed between 7.1% and 9.1% in each of the five years the table covers, and in each of them it is the lowest of any Member State with a published value, flagged values included.
Seven Member States have a 2025 value that Eurostat marks as of low reliability, and they are left out of the counts: Germany at 93.0%, Spain at 91.8%, Poland at 67.5%, Malta at 50.6%, Hungary at 43.1%, Ireland at 29.9% and Cyprus at 25.0%. None of them falls below Italy, and Germany and Spain would sit between France and Austria; Germany's value carries the flag in every year of the table. Bulgaria, Latvia and Luxembourg have no published value for 2025. Their cells are empty in the source, which is not the same as zero.
What the ranking cannot explain
The table records whether recent graduates had a placement, not why their programmes did or did not include one. Because training given inside a school is outside the definition, a country whose vocational courses teach practical skills mainly in school workshops would record a low share whatever the amount of practical training those courses contain. This study gives no reason for any country's position, and the figures say nothing about the quality of any country's vocational courses.
A month counts the same as a year
In the headline share a placement of one month counts the same as one lasting a year or more. The dataset the table is drawn from, edat_lfs_9919, divides the same share into placements of one to six months and placements of seven months or more. Across the EU in 2025, 39.0% of recent vocational graduates had a placement of seven months or more and 26.9% one of one to six months, and the two add up to the headline 66.0% to within rounding.
Long placements are the larger part in three of the 17 Member States. In the Netherlands, 83.5% of recent vocational graduates had one lasting seven months or more and 11.9% a shorter one. In Austria the two figures are 72.2% and 14.2%, and in Denmark, where both values mark a break in the series, 68.3% and 11.5%. In each of the other 14, placements of one to six months account for more than half of the headline share, a comparison derived from the two published figures.
France, second on the headline figure, is one of the 14: 54.2% of its recent vocational graduates had a placement of one to six months and 39.0% one of seven months or more. Portugal's 80.9% includes 70.4% with a placement of one to six months, Slovenia's 72.0% includes 62.2% and Lithuania's 62.1% includes 60.4%. Italy's 22.0% is nearly all short placements: 20.7% of its recent vocational graduates had one of one to six months.
At EU level the longer placements are the larger group, 39.0% against 26.9%. The EU figure is Eurostat's estimate for the Union as a whole, including the ten Member States left out of this comparison, so it need not follow the pattern of the 17. Where a Member State's figure for long or short placements carries a low-reliability flag or is withheld, it is not used.
Five years, and ten series that can be followed
The table begins in 2021, when the EU Labour Force Survey moved to a new legal framework, and Eurostat marks every 2021 value as a break in series, so no figure here is set against an earlier year. Among the Member States with published values, the series of ten break again later: Slovakia in 2022, Poland and Slovenia in 2023, Belgium, Germany, Ireland, Greece, Spain and France in 2024, and Denmark in 2025. Others carry a low-reliability flag in at least one year or have years without a value. Only ten series have a value in every year, no break after 2021 and no low-reliability flag, those of Czechia, Estonia, Croatia, Italy, Lithuania, the Netherlands, Austria, Portugal, Romania and Sweden. Change is measured for them alone, in percentage points, the difference between two percentages.
Between 2021 and 2025, five of the ten shares rose and five fell. Italy's fell furthest: from 31.8% to 25.9% in 2022, the same in 2023, then 24.7% in 2024 and 22.0% in 2025, a fall of 9.8 points, and Italy is the one Member State of the ten whose share did not rise in any year. Czechia's fell by 6.0 points, from 21.2% to 15.2%, Austria's by 5.4, from 91.8% to 86.4%, and Estonia's by 5.3, from 73.5% to 68.2%, after reaching 83.7% in 2023. Croatia's has barely moved, staying between 38.3% and 39.7%, and the Dutch share has stayed between 94.3% and 95.4%. Lithuania's rose most, by 13.4 points from 48.7% to 62.1%, ahead of Portugal's 4.1, from 76.8% to 80.9%.
The EU figure went from 60.3% in 2021 and 60.1% in 2022 to 64.4% in 2023, 65.2% in 2024 and 66.0% in 2025. Most of that rise, 5.1 of its 5.9 points since 2022, came in the two years in which the Polish and French series break. Poland's share went from 16.3% in 2022 to 58.4% in 2023, a value flagged both as a break and as of low reliability, and France's from 68.3% in 2023 to 82.4% in 2024, again at a break; Slovenia's series also breaks in 2023, five more break in 2024 and Denmark's in 2025. The EU series itself carries no flag after 2021, but this study does not present its rise as progress, because the figures cannot separate a change in what graduates did from the effect of those breaks.
Recent vocational graduates who had spent at least a month in a workplace as part of their course, 2025
| Country | % of recent vocational graduates aged 20-34 | Gap to EU figurepercentage points, derived |
|---|---|---|
| Netherlands | 95.4 | +29.4 |
| France | 93.2 | +27.2 |
| Austria | 86.4 | +20.4 |
| European Unionaggregate | 66.0 | — |
| Italy | 22.0 | −44.0 |
| Czechia | 15.2 | −50.8 |
| Romania | 9.1 | −56.9 |
This table as data: CSV · JSON
Every Member State for this indicator+
Members see every Member State for this indicator here, not only the rows the ranking prints. Become a Member
Change in the share of recent vocational graduates with at least a month in a workplace, 2021 to 2025
| Country | percentage points (derived) |
|---|---|
| Lithuania | 13.4 |
| Portugal | 4.1 |
| Romania | 2.0 |
| Sweden | 1.4 |
| Netherlands | 0.3 |
| Croatia | -0.8 |
| Estonia | -5.3 |
| Austria | -5.4 |
| Czechia | -6.0 |
| Italy | -9.8 |
This table as data: CSV · JSON
Every Member State for this indicator+
Members see every Member State for this indicator here, not only the rows the ranking prints. Become a Member
What these figures cannot tell you
- Recent graduates aged 20 to 34
- The population is people aged 20 to 34 whose highest completed qualification is a vocational one at upper secondary level or at the post-secondary level below higher education, obtained in the previous three years. Nobody under 20 is in it, whenever they qualified, and someone who has since completed a higher qualification has left it. Eurostat counts these graduates whether or not they are in education or training now, so the figure describes the programmes they finished, not the courses on offer today.
- A month in a workplace, not practical training as such
- The indicator records work experience of at least a month at a workplace that formed part of the programme, compulsory or optional. Practical training given entirely in a school does not count, and in the headline share a placement of one month counts the same as one lasting years. A low share therefore says that few recent graduates had such a placement, not that their courses lacked practical training. The split by length comes from the source dataset, edat_lfs_9919, and only for 2025.
- Seven values of low reliability, three missing
- Eurostat flags seven of the 2025 national values as of low reliability, those of Germany, Ireland, Spain, Cyprus, Hungary, Malta and Poland, and publishes none for Bulgaria, Latvia or Luxembourg. Every count, ordering and comparison here is taken over the 17 Member States that remain; the flagged values are quoted with the flag and never ranked. The figures for long and short placements are flagged or withheld more often still, and only values without a low-reliability flag are used.
- A short series with many breaks
- The series starts in 2021, the first year of the EU Labour Force Survey's new framework, and the series of ten Member States with published values break again between 2022 and 2025. Change is measured only for the ten Member States with a value in every year, no later break and no low-reliability flag. The rise in the EU figure from 2022 is not read as progress, because most of it coincides with the Polish and French breaks.
- Survey answers, and national classifications
- The shares are estimates from a household survey, based on what was reported about each person's course, not on school or employer records. Which qualifications count as vocational at these levels follows the international classification of education as each country applies it. Eurostat's metadata records, for instance, that the qualification awarded by Austria's higher technical and vocational colleges has been classified at the first level of tertiary education since 2014, which places its holders outside this population.
- Women and men
- Eurostat also publishes the share for women and for men, 65.3% and 66.5% at EU level in 2025. Several national values by sex carry a low-reliability flag or are withheld, and the study draws no comparison between women and men.
Frequently asked questions
- What share of vocational graduates in the EU train in a real workplace?
- 66.0% in 2025: about two in three people aged 20 to 34 who had obtained a vocational qualification below higher education in the previous three years had spent at least a month in a workplace as part of their course. Practical training given entirely inside a school is not counted.
- Which EU country has the highest share?
- The Netherlands, at 95.4%, among the 17 Member States whose 2025 figure Eurostat does not flag as of low reliability; France follows at 93.2% and Austria at 86.4%. Germany's 93.0% and Spain's 91.8% carry that flag and are not ranked here.
- Why is Romania's share so low?
- The table does not say, and this study offers no reason. It shows that Romania had the lowest share of any Member State with a published figure in each year from 2021 to 2025, between 7.1% and 9.1%. Because practical training inside a school is outside the definition, the figure measures time spent in a workplace, not how much practical training a course contains.
- Does a short placement count the same as a long one?
- In the headline figure, yes: a month counts like a year. The source dataset separates them, and across the EU in 2025, 39.0% of recent vocational graduates had a placement of seven months or more and 26.9% one of one to six months. Among the 17 Member States compared here, long placements are the larger part only in the Netherlands, Austria and Denmark.
- Is the share rising?
- The EU figure went from 60.1% in 2022 to 66.0% in 2025, but most of the rise coincides with breaks in the Polish and French series and it is not read here as progress. Of the ten Member States whose series can be followed with no break or reliability flag, five rose and five fell; Italy's share fell most, by a derived 9.8 points to 22.0%.
- Are the people counted still in education?
- Some may be. Eurostat counts recent graduates whether or not they have since gone on to further education or training, so the figure describes the vocational programmes they completed, not the courses they may be taking now.
Methodological note
The study measures the share of people aged 20 to 34 whose highest qualification is an upper secondary or post-secondary non-tertiary vocational one (ISCED 2011 levels 35 and 45), obtained in the three years before the survey, who report work experience of at least one month at a workplace as part of the programme that led to it, as Eurostat publishes it in table tps00215 for every year from 2021 to 2025, for both sexes together and for women and men separately. The values come from the EU Labour Force Survey, cover people in private households, and are drawn from the dataset edat_lfs_9919, which also divides the same share into work experience of one to six months and of seven months or more; that division is read from edat_lfs_9919 for 2025, and every tps00215 value for the two sexes together equals the edat_lfs_9919 value for the same country and year. The EU figure is Eurostat's own value for the 27 Member States.
The shares are quoted as Eurostat publishes them, with Denmark's 2025 break, France's 2024 break and Poland's 2023 break and low reliability stated where those values are named, and the seven flagged 2025 values identified as such. Silver Data Lab derived the following, and nothing else: the ratio of the Dutch share to the Romanian one; the description of the EU share as about two in three; the EU figure's rise from 2022 to 2024 and to 2025, in percentage points; the change in percentage points between 2021 and 2025, and the years in which each share rose, for the ten Member States whose series has a value in every year, no break after 2021 and no low-reliability flag; the ranges of the Romanian, Croatian and Dutch shares over the five years; the comparison of each Member State's share of placements of one to six months with half its headline share, and of Italy's with the whole of it, and of the Dutch, Austrian and Danish shares of placements of seven months or more with half of theirs; the check that the two EU bands add up to the EU headline share to within rounding; and the numbers of Member States above or below the EU figure, above 75%, with a break in their series after 2021, with a share that rose or fell, or in which long or short placements are the larger part. Every count, rank and superlative is taken over the 17 Member States whose 2025 value carries no low-reliability flag; Germany, Ireland, Spain, Cyprus, Hungary, Malta and Poland are flagged, and Bulgaria, Latvia and Luxembourg have no value. Romania's place as the lowest in each year, and the place where each flagged 2025 value would fall, are checked against every Member State with a published value, flagged ones included. Eurostat's metadata names this indicator among those for which the Council Resolution on a strategic framework for European cooperation in education and training towards the European Education Area and beyond (2021-2030) sets an EU-level target; neither the metadata nor the table gives the target's value, and none is stated here.
Source data
This study draws on 2 datasets from Eurostat. Each can be inspected and re-downloaded from its catalogue, and the filters below are the ones applied.
Exposure of VET graduates to work-based learning
tps00215
- Filters applied:
- freq=A · training=TOTAL · workstud=WE · duration=Y_LE3 · isced11=ED35_45 · age=Y20-34 · unit=PC · sex=T, F, M
- Extracted:
- 2026-10-25
- Source last updated:
- 2026-09-10
Population aged 20-34 in private households with work experience while studying by educational attainment level and years since completion of highest level of education
edat_lfs_9919
- Filters applied:
- freq=A · training=TOTAL · workstud=WE, SHORT, LONG · duration=Y_LE3 · isced11=ED35_45 · age=Y20-34 · sex=T · unit=PC
- Extracted:
- 2026-10-25
- Source last updated:
- 2026-09-10
Download the data
The data the study you have just read is built on, exactly as it was downloaded and archived.
Yours as a Member.
Data downloadable by Members
How to cite
Record the vintage as well as the study: the figures on this page are the ones extracted on the dates below.
Silver Data Lab Research Desk (2026). Only 9.1% of Romanian Vocational Graduates Had a Month's Workplace Training. Silver Data Lab, published 25 October 2026, last updated 25 October 2026. https://www.silverdatalab.com/studies/work-based-learning-in-the-eu
- Data: Eurostat, Exposure of VET graduates to work-based learning (tps00215), filters freq=A, training=TOTAL, workstud=WE, duration=Y_LE3, isced11=ED35_45, age=Y20-34, unit=PC, sex=T, F, M; extracted 2026-10-25; source last updated 2026-09-10. https://doi.org/10.2908/tps00215
- Data: Eurostat, Population aged 20-34 in private households with work experience while studying by educational attainment level and years since completion of highest level of education (edat_lfs_9919), filters freq=A, training=TOTAL, workstud=WE, SHORT, LONG, duration=Y_LE3, isced11=ED35_45, age=Y20-34, sex=T, unit=PC; extracted 2026-10-25; source last updated 2026-09-10. https://doi.org/10.2908/edat_lfs_9919
Silver Data Lab's analysis is licensed CC BY 4.0. The statistics remain their publisher's and keep its terms of reuse.
Ask the research desk
A question about this study — a definition, a filter, a break in the series, what the figures can and cannot support — answered by the desk that made the extraction.
Members can write to the research desk
Studies where the same country leads or trails
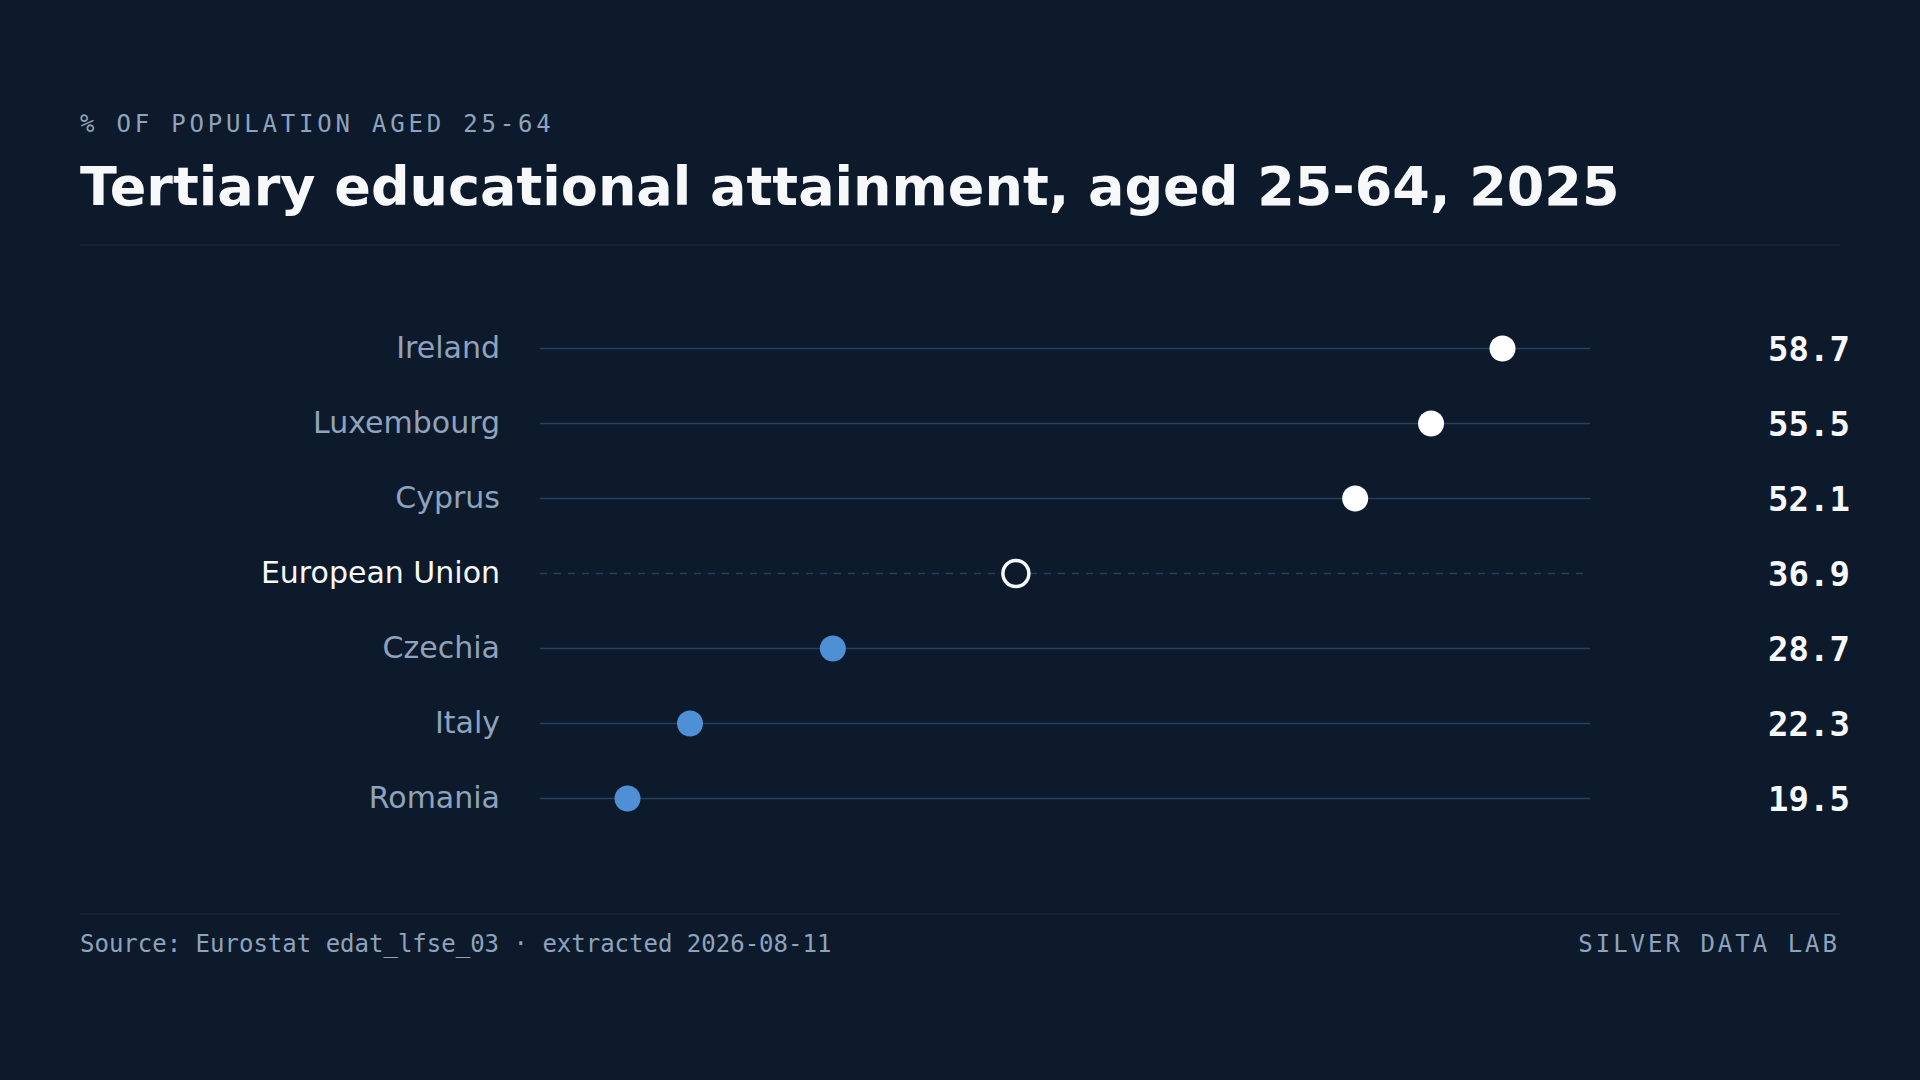
A Degree Is Three Times as Common Among Adults in Ireland as in Romania
36.9% of people aged 25 to 64 in the EU held a tertiary qualification in 2025.
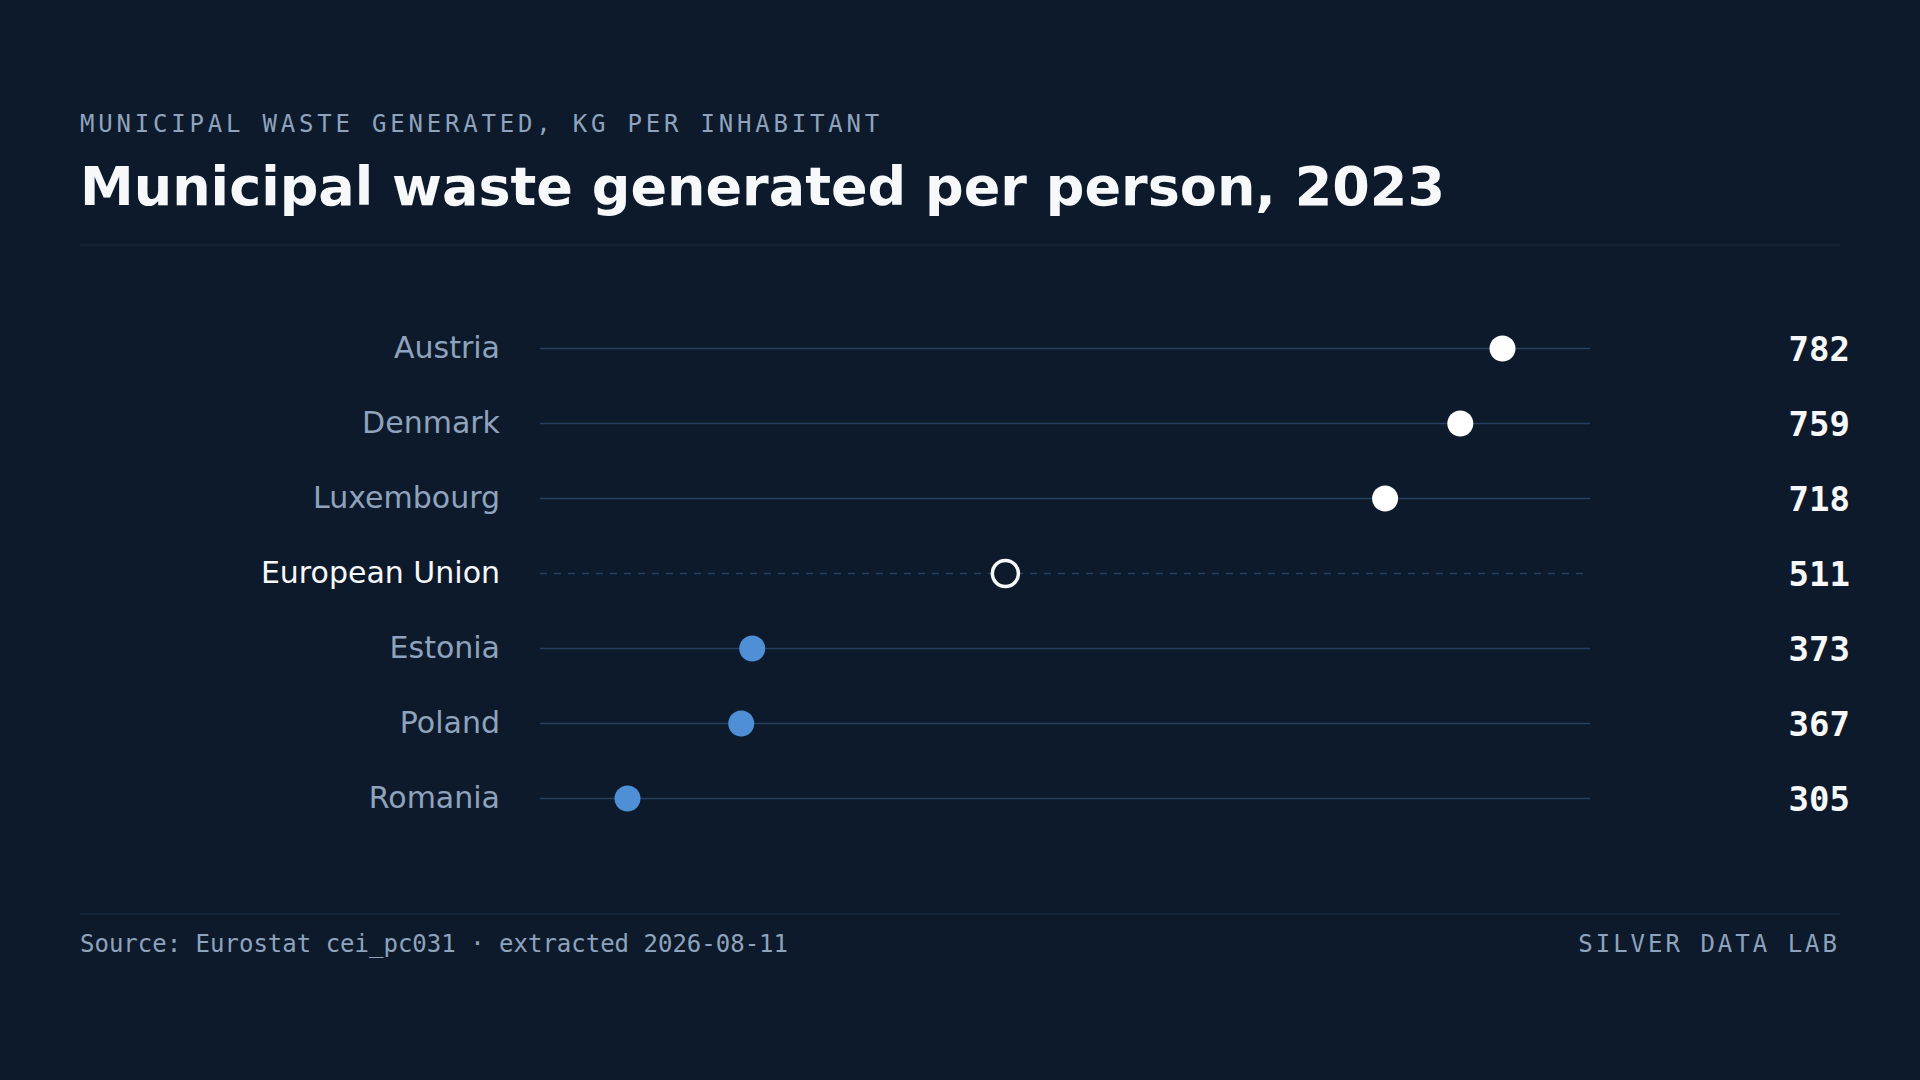
Austria Produces More Rubbish per Person Than Any Other EU Country
The EU generated 510 kg of municipal waste per inhabitant in 2023 — about 1.4 kg per person per day.
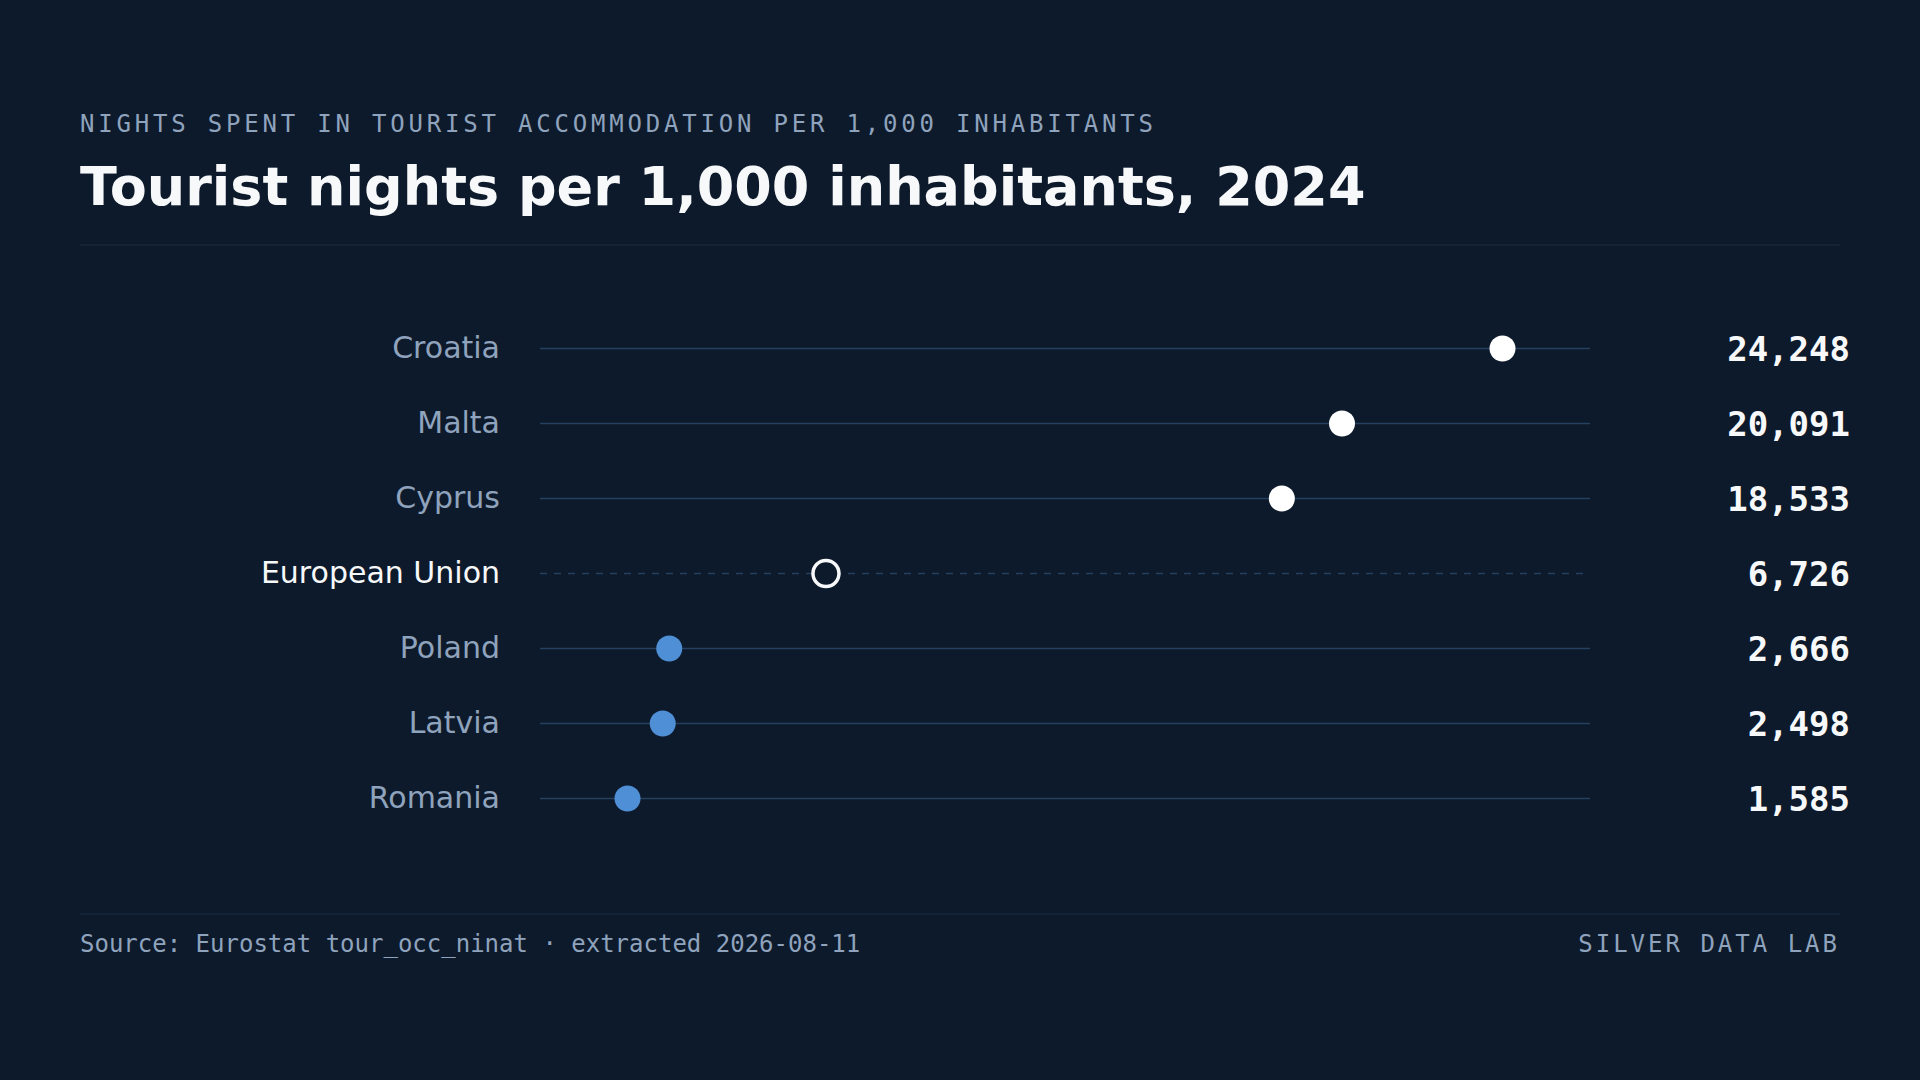
For Its Population, Croatia Has the Most Tourist Overnight Stays in the EU
The EU recorded 6,978 tourist nights per 1,000 inhabitants in 2025, about 7.0 nights per resident.