Micro-Enterprises Employ Nearly Half of Slovakia's Business Workforce and Under a Fifth of Germany's
Silver Data Lab Research Desk · Statistical analysis · Published on 17 September 2026
- Data source
- Eurostat
- Reference period
- 2024
- Last updated
- 17 September 2026
Re-checked against the source on 17 September 2026. No value in its datasets has moved between the snapshots we hold. Every revision we have observed →
Key estimates
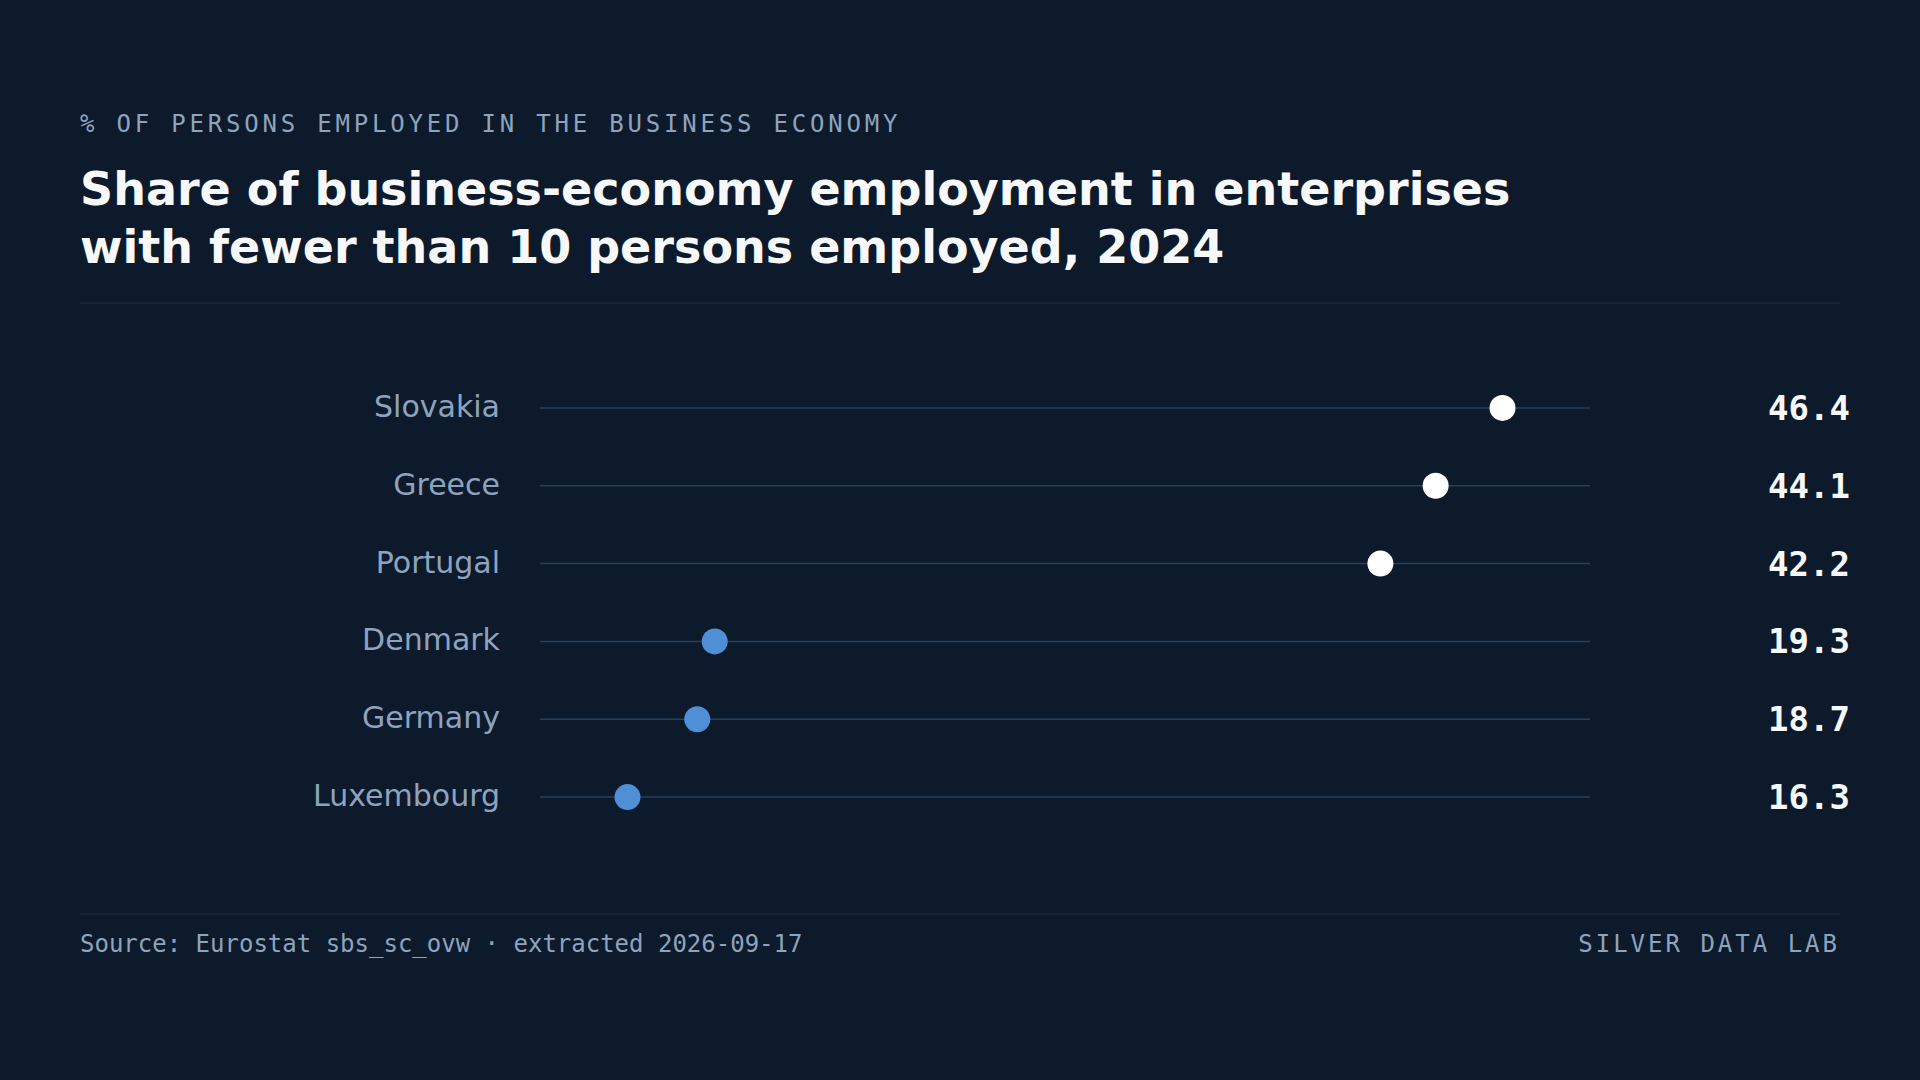
- Enterprises with fewer than 10 persons employed account for 46.4% of business-economy employment in Slovakia, 44.1% in Greece, 42.2% in Portugal and 41.1% in Estonia, shares derived here from Eurostat's 2024 counts.
- Luxembourg at 16.3%, Germany at 18.7% and Denmark at 19.3% are the only Member States where micro-enterprises employ fewer than one worker in five.
- Large enterprises of 250 or more employ 46.1% of France's business workforce and 44.5% of Germany's, against 17.4% in Greece and 18.2% in Cyprus.
- The average enterprise in Germany employs 12 people; in Czechia, Estonia, Portugal and Slovakia it employs 3.
- Eighteen of the 27 Member States have at least 30% of their business-economy employment in micro-enterprises.
Counting the people, not the firms
Almost every enterprise in Europe is small: the vast majority of firms in any Member State employ fewer than ten people. Counted that way the Union looks uniform. Counted by where people work, it does not.
Eurostat's structural business statistics report, for each size class of enterprise, how many people are employed in it. Dividing the micro-enterprise figure by the total for the business economy gives the share of a country's business workforce that works in firms with fewer than ten people. That share, computed here from the two published counts, runs from 16.3% to 46.4% across the Union.
Where the workforce is in small firms
Slovakia records 46.4%, Greece 44.1%, Portugal 42.2% and Estonia 41.1%: four Member States where more than two fifths of business-economy employment is in micro-enterprises. Italy at 39.9%, Cyprus and Hungary at 39.1%, Poland at 37.7% and Slovenia at 37.0% follow.
Eighteen Member States are at or above 30%. The group spans the Mediterranean, most of central and eastern Europe and the Baltic states, and it contains countries at very different income levels: Italy and Slovenia alongside Bulgaria and Romania.
Where it is in large ones
Luxembourg at 16.3%, Germany at 18.7% and Denmark at 19.3% are the three Member States below 20%. Finland at 23.1%, Sweden at 24.7%, Ireland at 26.5% and France at 26.7% come next, then Austria and the Netherlands at 28.3%.
The other end of the size distribution tells the same story from the opposite side. Enterprises with 250 or more persons employed account for 46.1% of France's business-economy workforce, 44.5% of Germany's, 43.5% of Sweden's and 40.8% of the Netherlands'. In Greece the figure is 17.4%, in Cyprus 18.2%, in Estonia 18.4%. Portugal publishes no count for its largest firms, so its share cannot be derived.
Germany and Greece are the clearest pair. In Germany, large enterprises employ more than twice as many people as micro-enterprises; in Greece, micro-enterprises employ more than twice as many as large ones.
Three people, or twelve
Eurostat also publishes the average number of persons employed per enterprise, rounded to whole numbers. Germany records 12, Luxembourg 8, and Austria, Denmark and Ireland 6. Czechia, Estonia, Portugal and Slovakia record 3, and most of the Union sits at 4 or 5.
The average is pulled down by the sheer number of one-person firms, which is why the employment share is the better guide to where work happens. But the two measures agree on the ordering: the countries where the typical firm is smallest are the countries where the most people work in small firms.
What the size of a firm does not decide
Firm size is not a verdict on an economy. Micro-enterprises include the self-employed professional, the family restaurant and the software start-up alike, and a large share of them can reflect a strong service sector, a tradition of independent trades, or a shortage of the mid-sized firms that grow into large ones. The countries with the most employment in large enterprises are also the countries with the largest manufacturing groups, and much of the difference in this ranking is the difference between economies built around industrial firms and economies built around shops, services and trades.
Share of business-economy employment in enterprises with fewer than 10 persons employed, 2024
| Country | % of persons employed |
|---|---|
| Slovakia | 46.4 |
| Greece | 44.1 |
| Portugal | 42.2 |
| Denmark | 19.3 |
| Germany | 18.7 |
| Luxembourg | 16.3 |
This table as data: CSV · JSON
Every Member State for this indicator+
Members see every Member State for this indicator here, not only the rows the ranking prints. Become a Member
Embed this chart
Paste this code into a page. The frame carries the source and the extraction date, and links back to the study.
Share of business-economy employment in enterprises with 250 or more persons employed, 2024
| Country | % of persons employed |
|---|---|
| France | 46.1 |
| Germany | 44.5 |
| Sweden | 43.5 |
| Estonia | 18.4 |
| Cyprus | 18.2 |
| Greece | 17.4 |
This table as data: CSV · JSON
Every Member State for this indicator+
Members see every Member State for this indicator here, not only the rows the ranking prints. Become a Member
Embed this chart
Paste this code into a page. The frame carries the source and the extraction date, and links back to the study.
What these figures cannot tell you
- A derived share
- Eurostat publishes the number of persons employed in each size class and in total. The shares here are the micro-enterprise and large-enterprise counts divided by the total for the business economy, computed by Silver Data Lab and labelled as derived wherever they appear.
- No EU aggregate for 2024
- At the extraction date the dataset carried no EU-wide value for 2024 in the series used here, so the rankings show no reference row and the text quotes no EU share. Portugal's count for enterprises of 250 or more is not published, so its large-enterprise share is absent.
- The business economy is not the whole economy
- The aggregate used covers industry, construction and market services and excludes agriculture, public administration and membership organisations. Public employment, which is large and concentrated in big units, is outside it, so the shares describe the private sector rather than all work.
- An enterprise is a statistical unit
- Eurostat defines an enterprise as the smallest combination of legal units with a degree of autonomy in decision-making. Member States apply that definition to their business registers in different ways, and a subsidiary of a foreign group may count as a large enterprise in one country and as part of one in another. Small differences in the ranking should not be over-read.
Frequently asked questions
- In which EU country do most people work for small firms?
- Slovakia, where 46.4% of business-economy employment in 2024 was in enterprises with fewer than 10 persons employed, followed by Greece at 44.1%, Portugal at 42.2% and Estonia at 41.1%. The shares are derived from Eurostat's published counts.
- Where do large enterprises employ the most people?
- France, where enterprises with 250 or more persons employed account for 46.1% of the business-economy workforce, then Germany at 44.5%, Sweden at 43.5% and the Netherlands at 40.8%. In Greece the figure is 17.4%.
- How big is the average European enterprise?
- Small. Eurostat's average number of persons employed per enterprise is 12 in Germany, 8 in Luxembourg and 6 in Austria, Denmark and Ireland; it is 3 in Czechia, Estonia, Portugal and Slovakia, and 4 or 5 in most other Member States.
- Is a large share of micro-enterprises a sign of weakness?
- Not on its own. The share reflects the balance between industry and services, the tradition of independent trades and the number of mid-sized firms, and it groups Italy and Slovenia with Bulgaria and Romania. It says where people work, not how well the economy performs.
Methodological note
Eurostat's structural business statistics publish, for each Member State and each employment size class, the number of persons employed and the average number of persons employed per enterprise. This study uses the 2024 figures for the business economy, the aggregate covering industry, construction and market services except public administration and membership organisations, and the size classes of fewer than 10 persons employed, 250 or more, and the total.
The micro-enterprise share is the number of persons employed in enterprises with fewer than 10 persons divided by the total for the business economy; the large-enterprise share is the same calculation for enterprises with 250 or more. Both are computed by Silver Data Lab and labelled as derived. The average size of an enterprise is used as published, in whole persons. The counts of Member States above 30% and below 20% follow from the derived shares.
Values cover all 27 Member States for the micro-enterprise share and 26 for the large-enterprise share. The extraction carries no EU aggregate for 2024, so none is shown.
Source data
The underlying series can be inspected and re-downloaded from the Eurostat data browser. The filters below are the ones applied.
Enterprise statistics by size class and NACE Rev. 2 activity (from 2021 onwards)
sbs_sc_ovw
- Filters applied:
- freq=A · indic_sbs=EMP_NR, EMP_ENT_NR · nace_r2=B-S_X_O_S94 · size_emp=TOTAL, 0-9, 10-19, 20-49, 50-249, GE250 · time=2024
- Extracted:
- 2026-09-17
- Source last updated:
- 2026-09-15
Download the data
The data the study you have just read is built on, exactly as it was downloaded and archived.
Yours as a Member.
Data downloadable by Members
How to cite
Record the vintage as well as the study: the figures on this page are the ones extracted on the dates below.
Silver Data Lab Research Desk (2026). Micro-Enterprises Employ Nearly Half of Slovakia's Business Workforce and Under a Fifth of Germany's. Silver Data Lab, published 17 September 2026, last updated 17 September 2026. https://www.silverdatalab.com/studies/enterprise-size-in-the-eu
- Data: Eurostat, Enterprise statistics by size class and NACE Rev. 2 activity (from 2021 onwards) (sbs_sc_ovw), filters freq=A, indic_sbs=EMP_NR, EMP_ENT_NR, nace_r2=B-S_X_O_S94, size_emp=TOTAL, 0-9, 10-19, 20-49, 50-249, GE250, time=2024; extracted 2026-09-17; source last updated 2026-09-15. https://doi.org/10.2908/sbs_sc_ovw
Silver Data Lab's analysis is licensed CC BY 4.0. The statistics remain their publisher's and keep its terms of reuse.
Ask the research desk
A question about this study — a definition, a filter, a break in the series, what the figures can and cannot support — answered by the desk that made the extraction.
Members can write to the research desk
Studies where the same country leads or trails
France Manufactures a Smaller Share of Its Economy Than Bulgaria
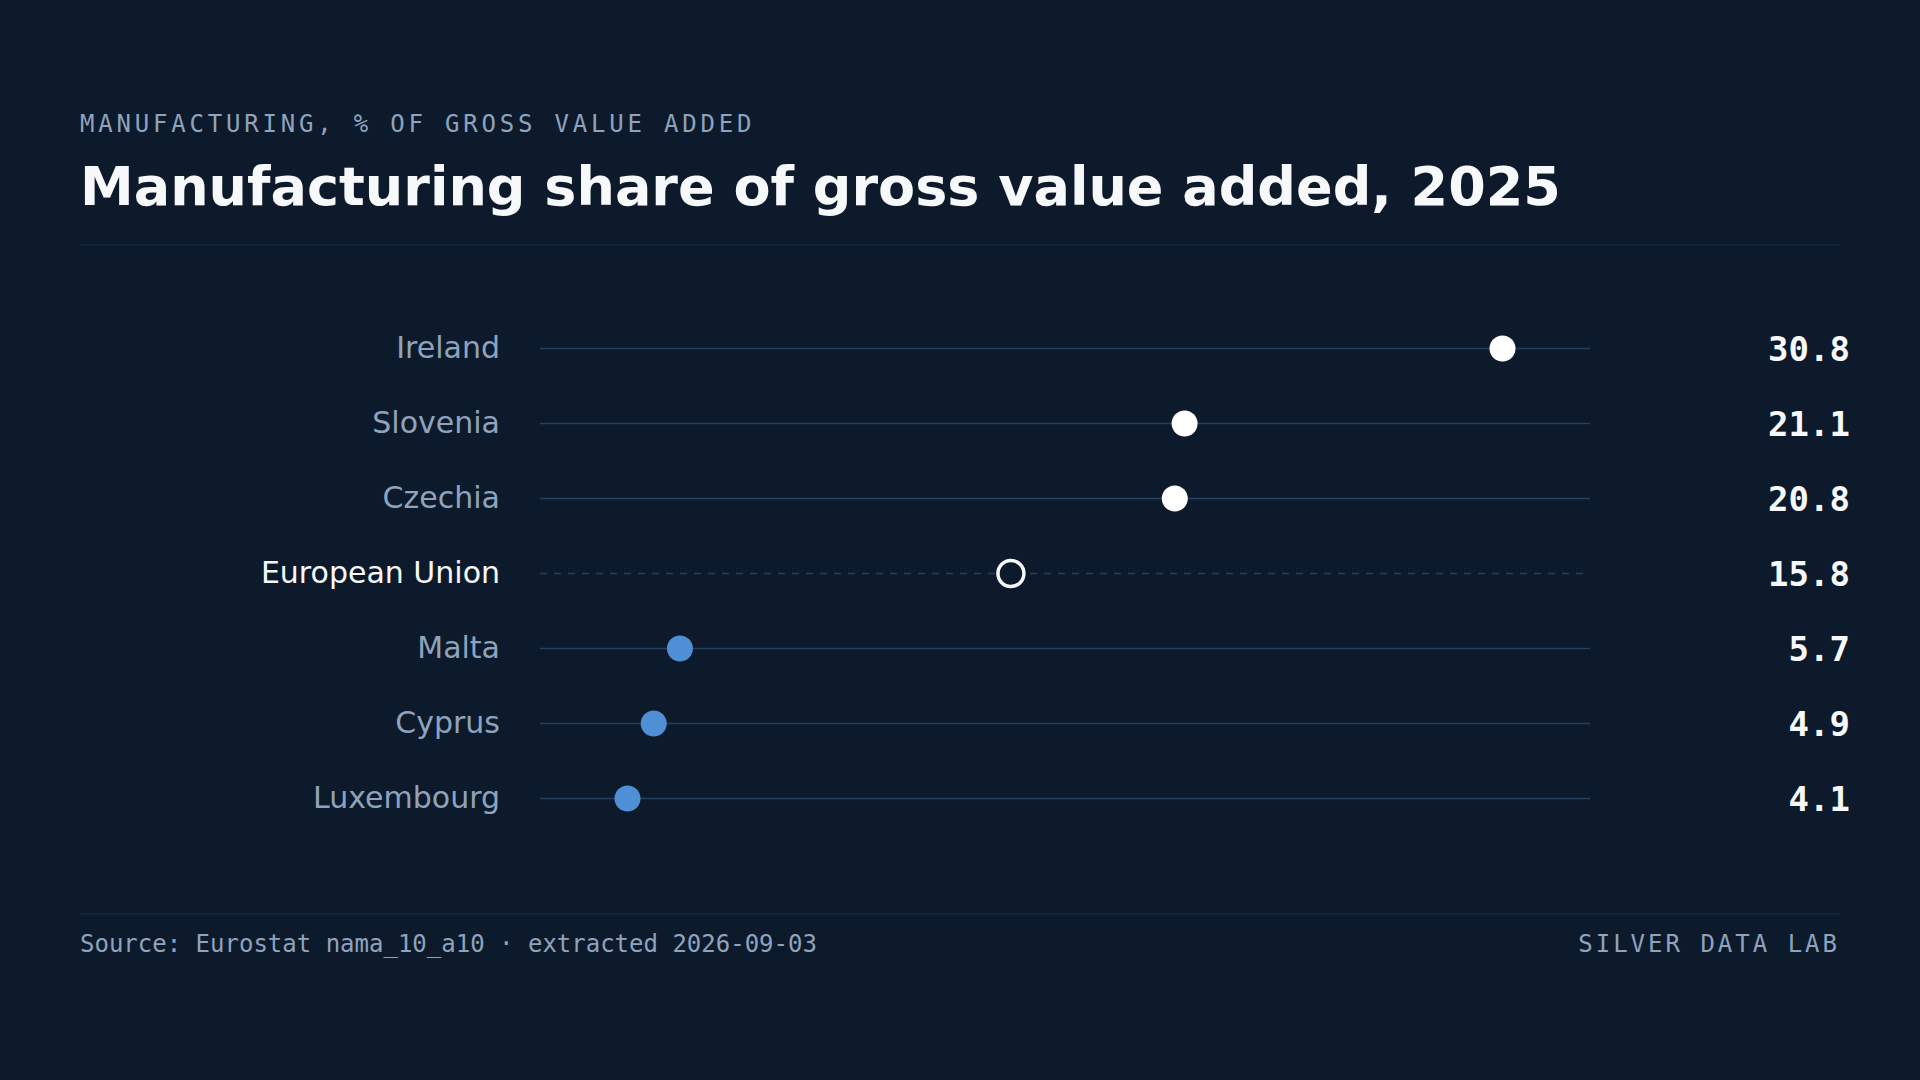
Manufacturing accounted for 15.8% of gross value added in the EU in 2025.
Germany Is the Only EU Country Where Most People Do Not Own Their Home
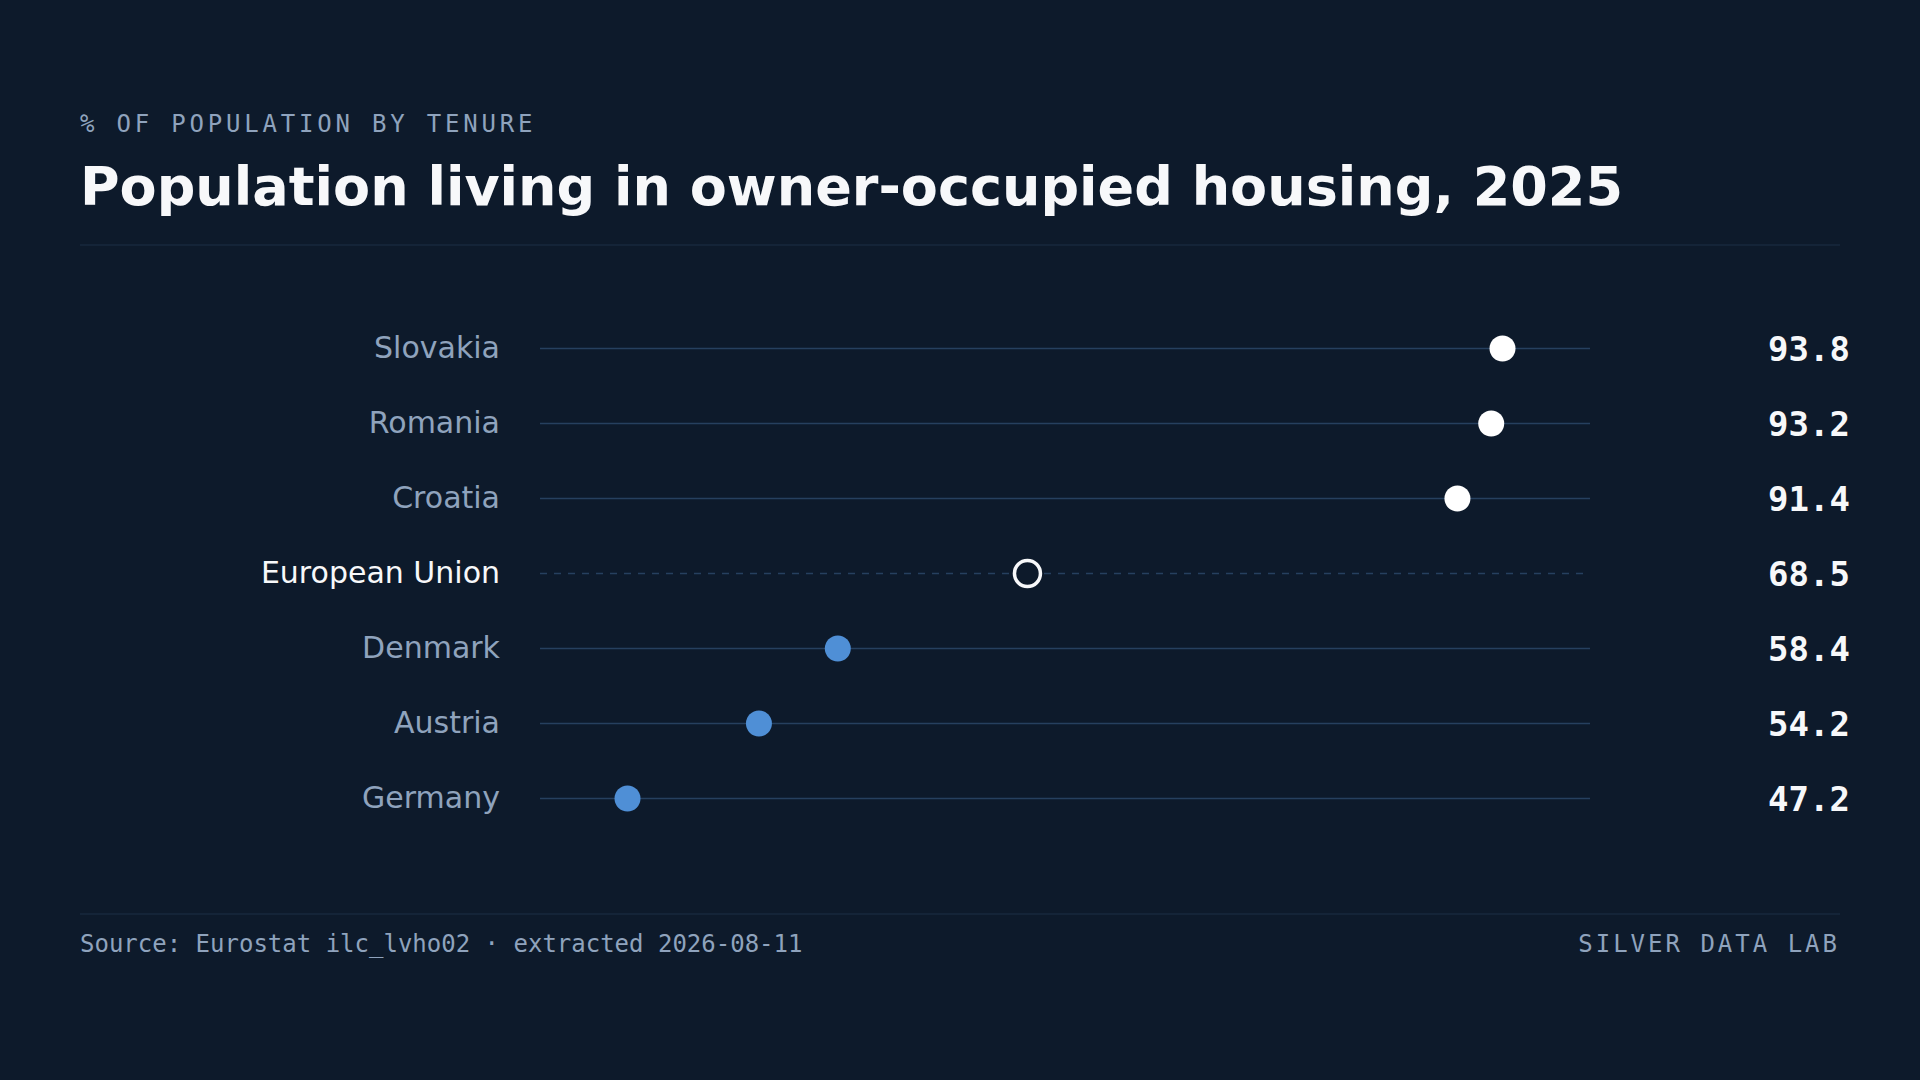
68.5% of the EU population lived in a home owned by their household in 2025.
In Luxembourg, Women Are Paid More Than Men
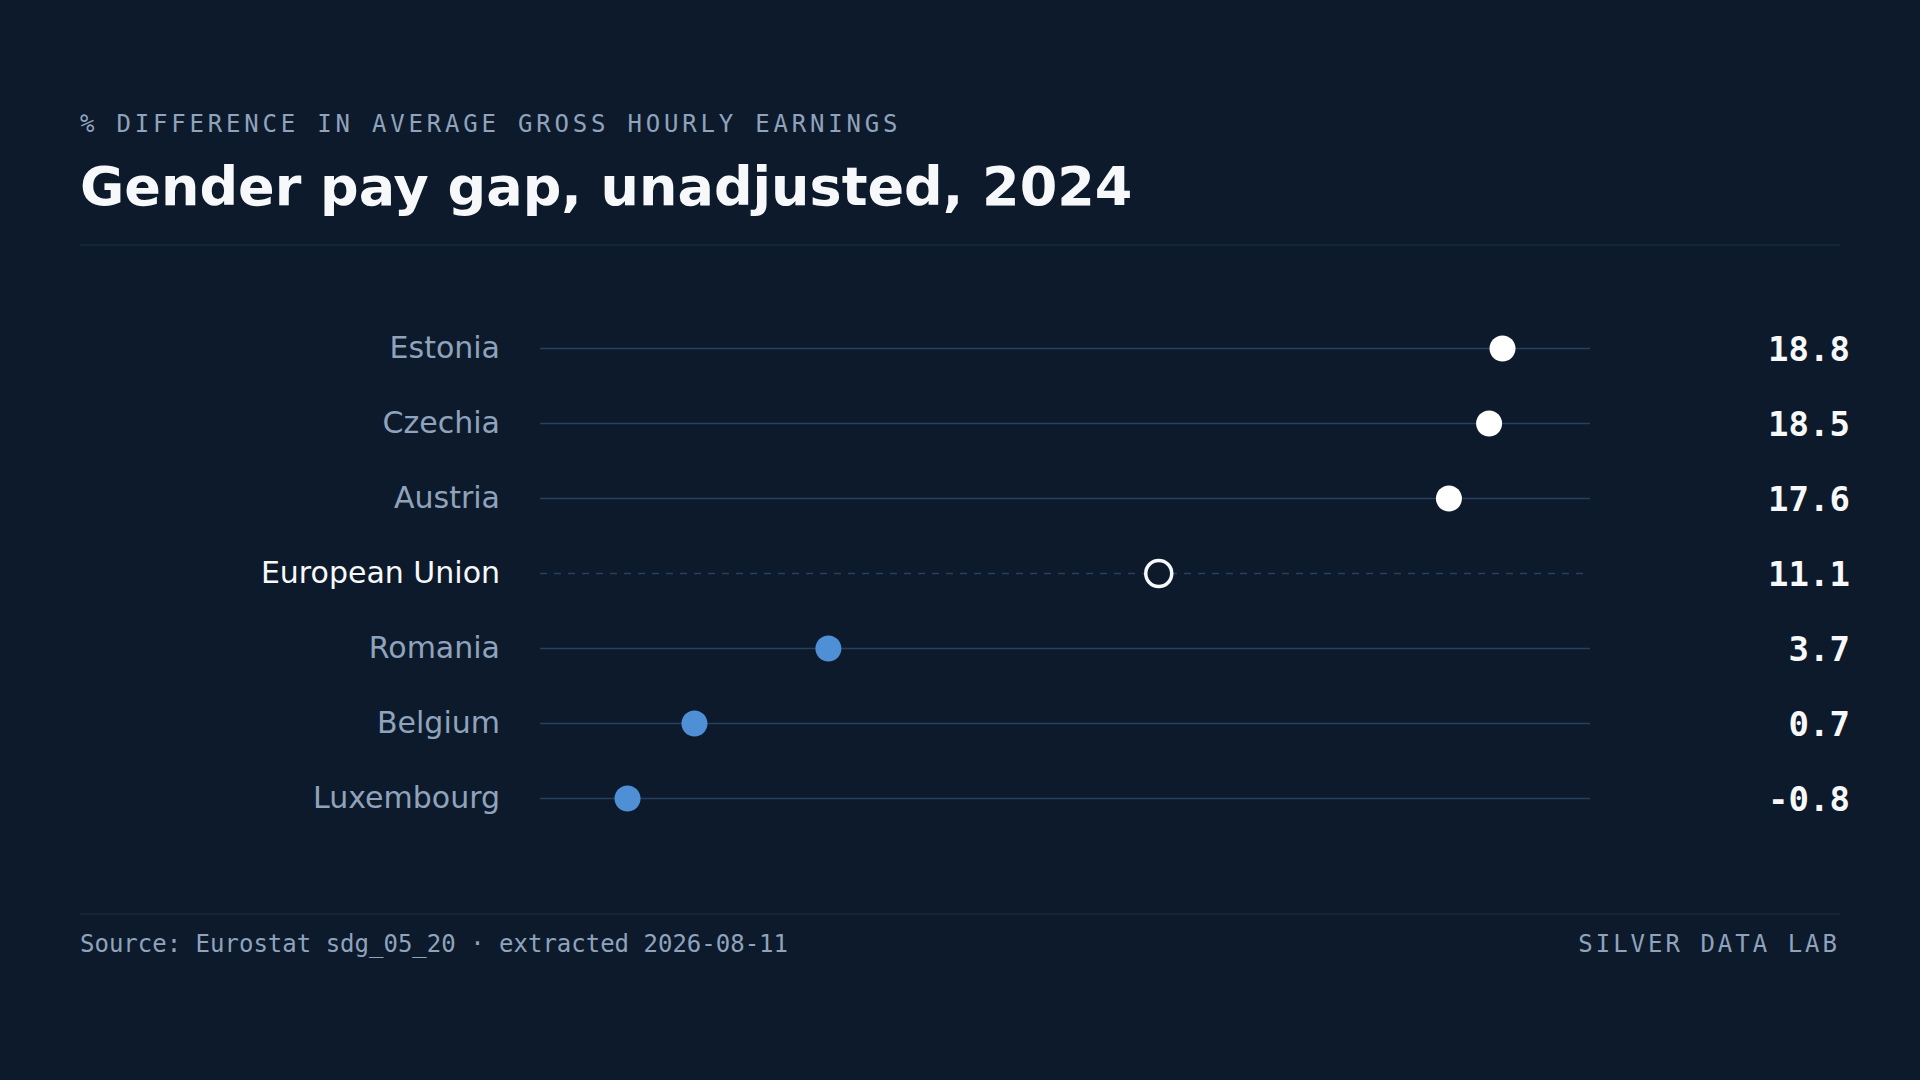
Women in the EU earned 11.1% less per hour than men in 2024, before any adjustment for occupation or hours.