Germany Is the Only EU Country Where Most People Do Not Own Their Home
Silver Data Lab Research Desk · Statistical analysis · Published on 14 June 2026
- Data source
- Eurostat
- Reference period
- 2025
- Last updated
- 03 September 2026
Re-checked against the source on 21 October 2026. No value in its datasets has moved between the snapshots we hold. Every revision we have observed →
Key estimates
- 68.5% of the EU population lived in a home owned by their household in 2025.
- Slovakia records 93.8%, Romania 93.2% and Croatia 91.4% — more than nine people in ten.
- Germany records 47.2%, the only Member State where owners are a minority.
- 46.8% of Germans rent at market prices, against an EU figure of 20.8%.
- The eight highest ownership rates in the Union are all in central and eastern Europe.
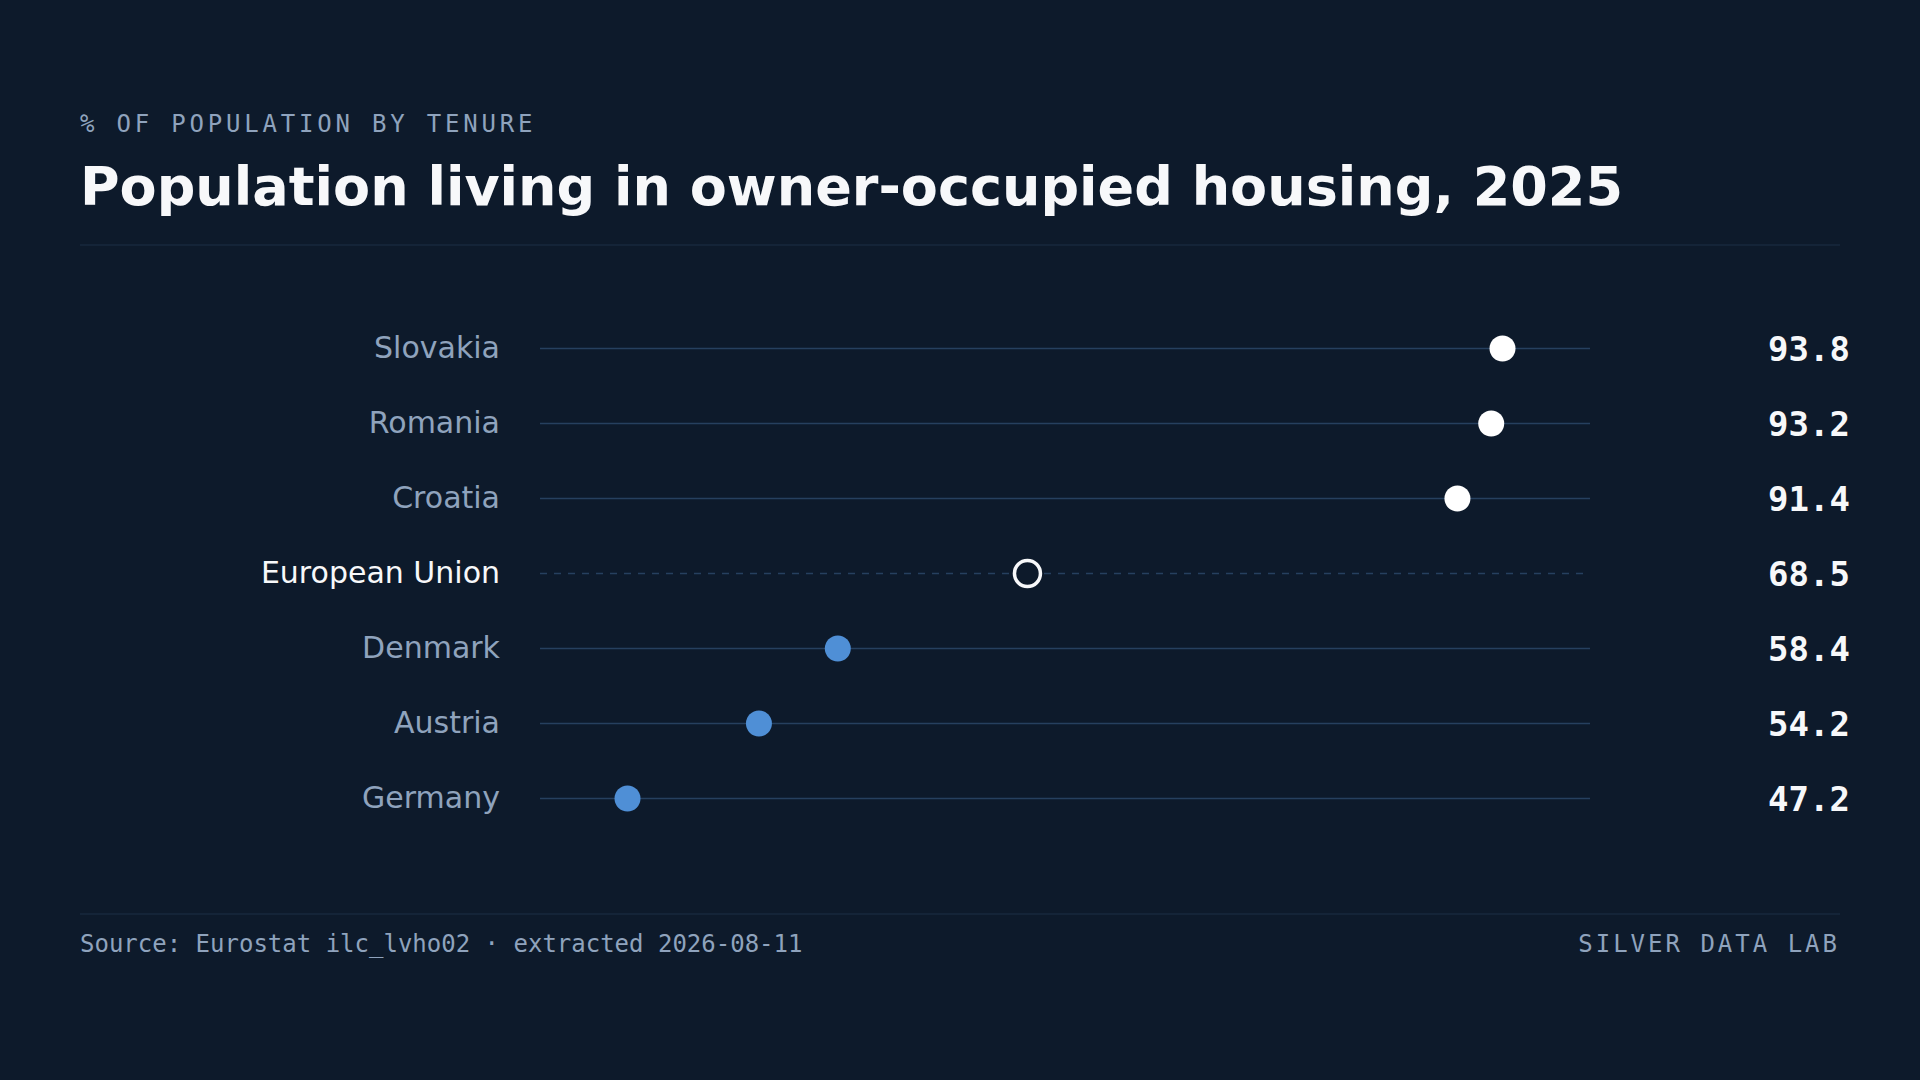
One market that works completely differently from the others
Housing tenure divides Europe more sharply than almost any other social statistic. Across the EU, 68.5% of people lived in a home their household owned in 2025. Behind that figure sit national rates from 93.8% down to 47.2%.
Germany is the only Member State where owners are a minority.
The ownership belt
Slovakia records 93.8%, Romania 93.2%, Croatia 91.4%, Hungary 89.8% and Poland 87.2%. Lithuania at 86.5%, Bulgaria at 86.1% and Latvia at 82.2% complete a group of eight, all in central and eastern Europe, all above 82%.
The concentration is not coincidental. Housing stock in these countries was largely transferred to sitting tenants during the privatisations of the early 1990s, producing ownership rates that reflect a one-off transfer rather than a functioning purchase market. A high rate here describes how housing was distributed thirty years ago at least as much as how it is bought today.
Germany, and the rental alternative
Germany records 47.2% ownership and 46.8% renting at market prices — the highest market rental share in the Union, against an EU figure of 20.8%.
The other large rental sectors are Denmark's, at 41.4% market renting against 58.4% ownership, Sweden's at 34.9% against 64.6%, and Austria's at 30.8% against 54.2%.
These are among the Union's wealthiest Member States. Low ownership here is not an affordability failure in the sense the ranking might suggest; it is a housing system in which renting is a long-term arrangement with substantial tenant protection rather than a stage before buying.
Why the ranking should not be read as a league table
An ownership rate above 90% and one below 50% can both describe functioning housing systems, and both can conceal problems. High ownership in a country where the stock was given away tells you little about whether a young household today can buy. High renting in a country with regulated, secure tenancies is a different condition from high renting in one without them.
Tenure describes the structure of a housing market. Whether that market serves the people in it is measured by overcrowding, housing cost burden and deprivation — indicators published separately, and which rank Member States differently.
Population living in owner-occupied housing, 2025
| Country | % of population | Gap to EU averagepercentage points, derived |
|---|---|---|
| Slovakia | 93.8 | +25.3 |
| Romania | 93.2 | +24.7 |
| Croatia | 91.4 | +22.9 |
| European Unionaggregate | 68.5 | — |
| Denmark | 58.4 | −10.1 |
| Austria | 54.2 | −14.3 |
| Germany | 47.2 | −21.3 |
This table as data: CSV · JSON
Every Member State for this indicator+
Members see every Member State for this indicator here, not only the rows the ranking prints. Become a Member
Embed this chart
Paste this code into a page. The frame carries the source and the extraction date, and links back to the study.
What these figures cannot tell you
- Ownership includes households with a mortgage
- Owner-occupiers are counted whether or not they have outstanding debt on the property. A country where most owners hold large mortgages and one where most own outright appear identically in this figure.
- The eastern rates reflect a historical transfer
- Ownership rates above 85% across central and eastern Europe largely originate in the privatisation of public housing stock to sitting tenants in the 1990s. The rate describes the result of that transfer, not the accessibility of buying a home today.
- Tenure says nothing about housing quality
- A high ownership rate is compatible with overcrowding, disrepair and unaffordable costs. Those are measured by separate indicators which produce different rankings.
- Reduced-price and free accommodation is a third category
- The two categories used here — owners and market renters — do not sum to 100%. The remainder rent at reduced prices or occupy accommodation free of charge, which is a substantial share in some Member States.
Frequently asked questions
- What share of Europeans own their home?
- 68.5% of the EU population lived in owner-occupied housing in 2025, counting both outright owners and those with a mortgage.
- Which EU country has the highest home ownership?
- Slovakia, at 93.8% in 2025, followed by Romania at 93.2% and Croatia at 91.4%. The eight highest rates in the Union are all in central and eastern Europe, largely reflecting the privatisation of public housing in the 1990s.
- Which EU country has the lowest home ownership?
- Germany, at 47.2% in 2025 — the only Member State where owners are a minority. Austria follows at 54.2% and Denmark at 58.4%.
- Does low home ownership mean a housing problem?
- Not by itself. Germany, Denmark, Sweden and Austria combine low ownership rates with the Union's largest market rental sectors. Whether a housing system serves the people in it is measured by overcrowding, cost burden and deprivation, which rank countries differently.
Methodological note
Tenure status is published by Eurostat from EU-SILC as the distribution of the population across owner-occupation, renting at market price, and renting at reduced price or free. This study uses the first two categories for the total population.
Values are for 2025, the most recent year with complete coverage of the 27 Member States at the extraction date.
The two categories do not sum to 100% because the third is omitted from the comparison; the observation that the eight highest ownership rates are all in central and eastern Europe is derived by Silver Data Lab from the published distribution.
Source data
The underlying series can be inspected and re-downloaded from the Eurostat data browser. The filters below are the ones applied.
Distribution of population by tenure status, type of household and income group
ilc_lvho02
- Filters applied:
- freq=A · hhcomp=TOTAL · rskpovth=TOTAL · tenure=OWN, RENT_MKT · unit=PC · time=2025
- Extracted:
- 2026-10-21
- Source last updated:
- 2026-10-20
Download the data
The data the study you have just read is built on, exactly as it was downloaded and archived.
Yours as a Member.
Data downloadable by Members
How to cite
Record the vintage as well as the study: the figures on this page are the ones extracted on the dates below.
Silver Data Lab Research Desk (2026). Germany Is the Only EU Country Where Most People Do Not Own Their Home. Silver Data Lab, published 14 June 2026, last updated 03 September 2026. https://www.silverdatalab.com/studies/home-ownership-in-the-eu
- Data: Eurostat, Distribution of population by tenure status, type of household and income group (ilc_lvho02), filters freq=A, hhcomp=TOTAL, rskpovth=TOTAL, tenure=OWN, RENT_MKT, unit=PC, time=2025; extracted 2026-10-21; source last updated 2026-10-20. https://doi.org/10.2908/ilc_lvho02
Silver Data Lab's analysis is licensed CC BY 4.0. The statistics remain their publisher's and keep its terms of reuse.
Ask the research desk
A question about this study — a definition, a filter, a break in the series, what the figures can and cannot support — answered by the desk that made the extraction.
Members can write to the research desk
Studies where the same country leads or trails
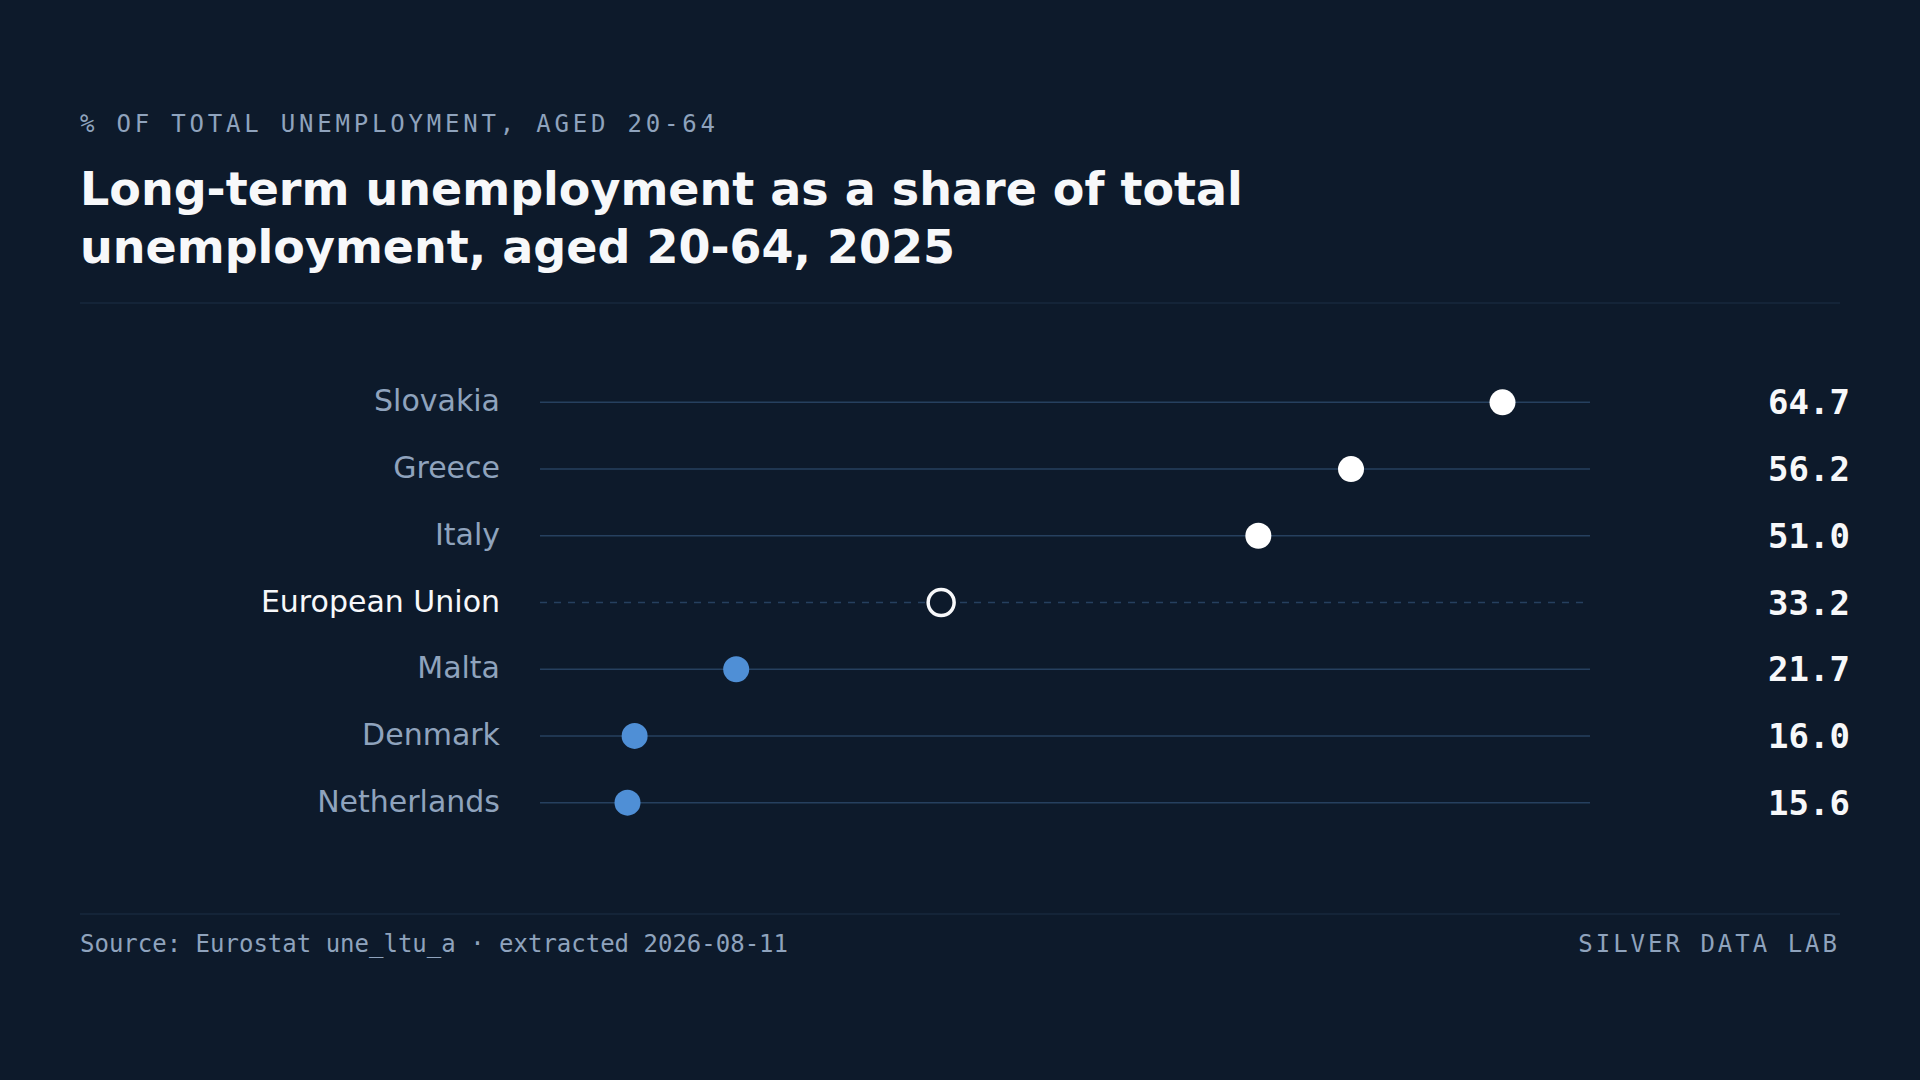
A Third of the EU's Unemployed Have Been Out of Work for a Year or More
33.2% of unemployed people aged 20 to 64 in the EU had been out of work for twelve months or more in 2025 — 4.0 million people.
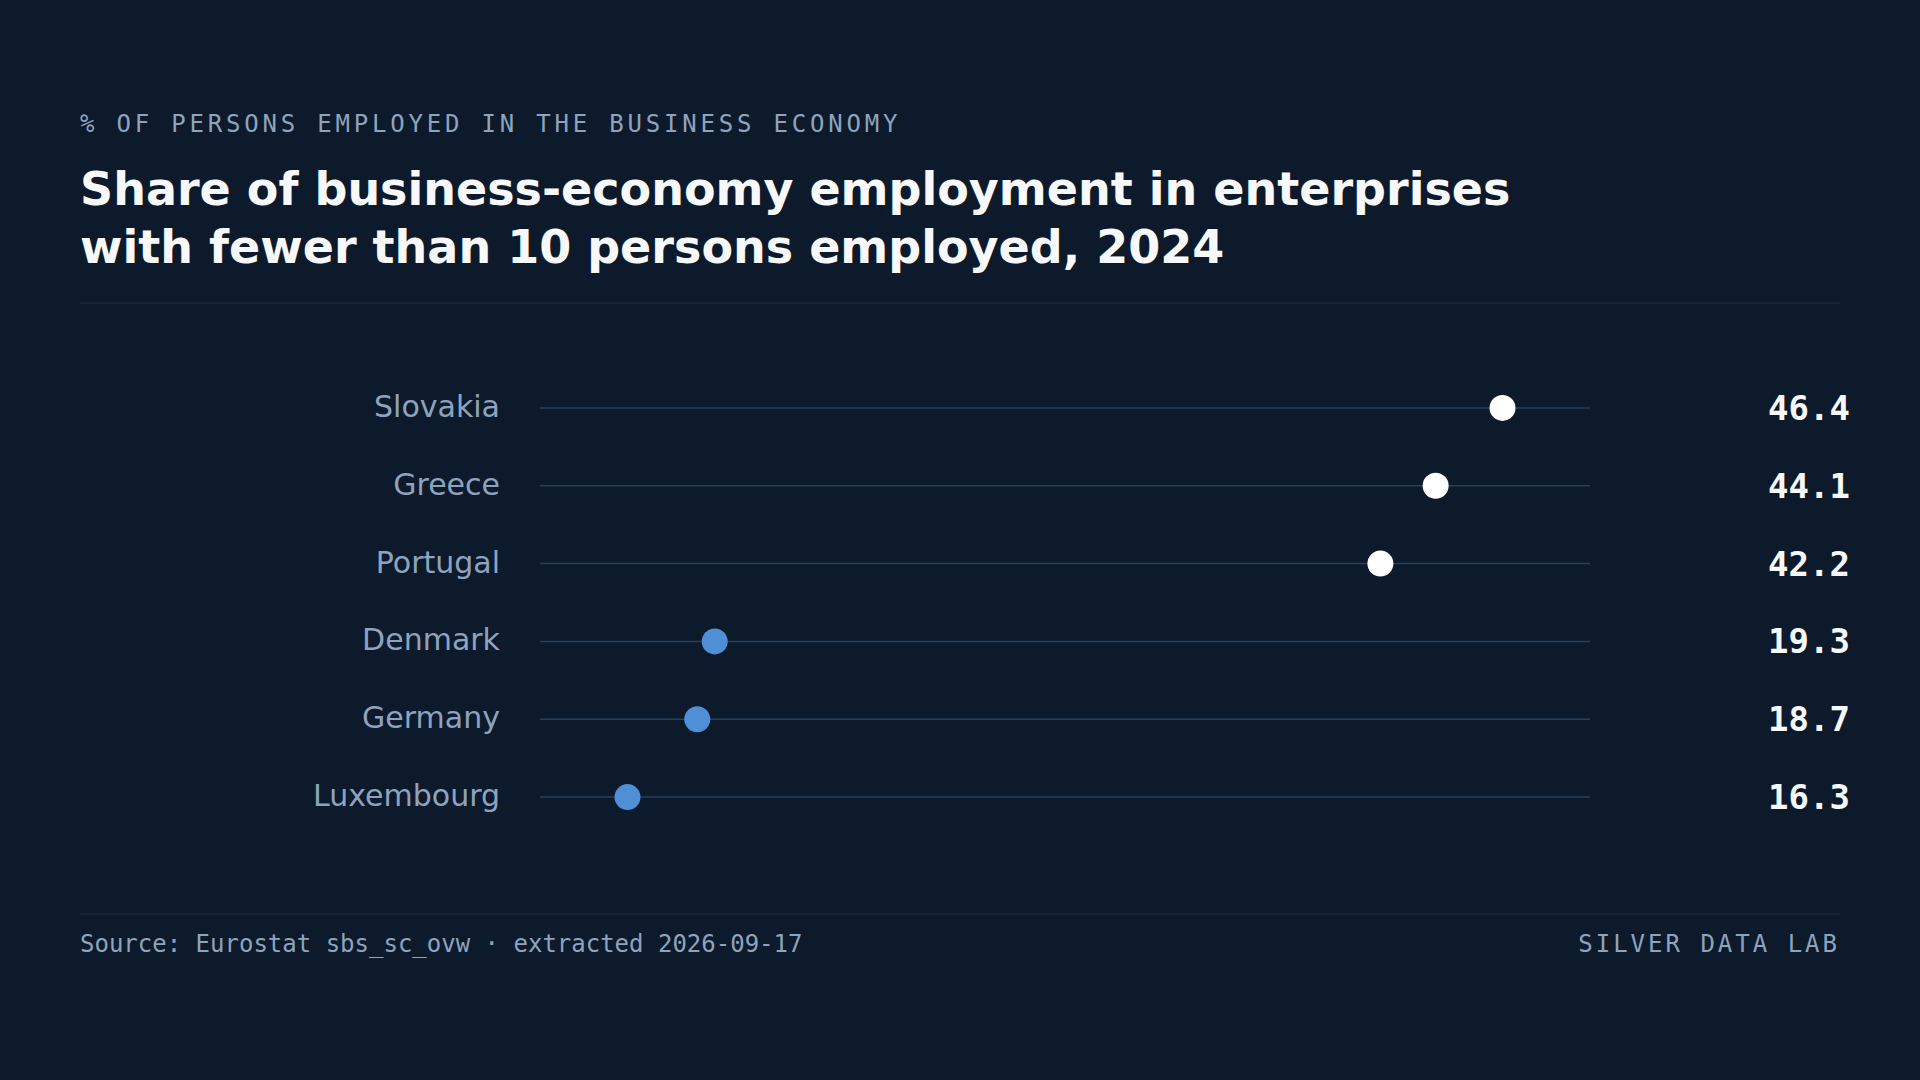
Nearly Half of Slovak Private-Sector Jobs Are in Firms With Under Ten Staff
Enterprises with fewer than 10 persons employed account for 46.4% of business-economy employment in Slovakia, 44.1% in Greece, 42.2% in Portugal and 41.1% in Estonia, shares derived here from Eurostat's 2024 counts.
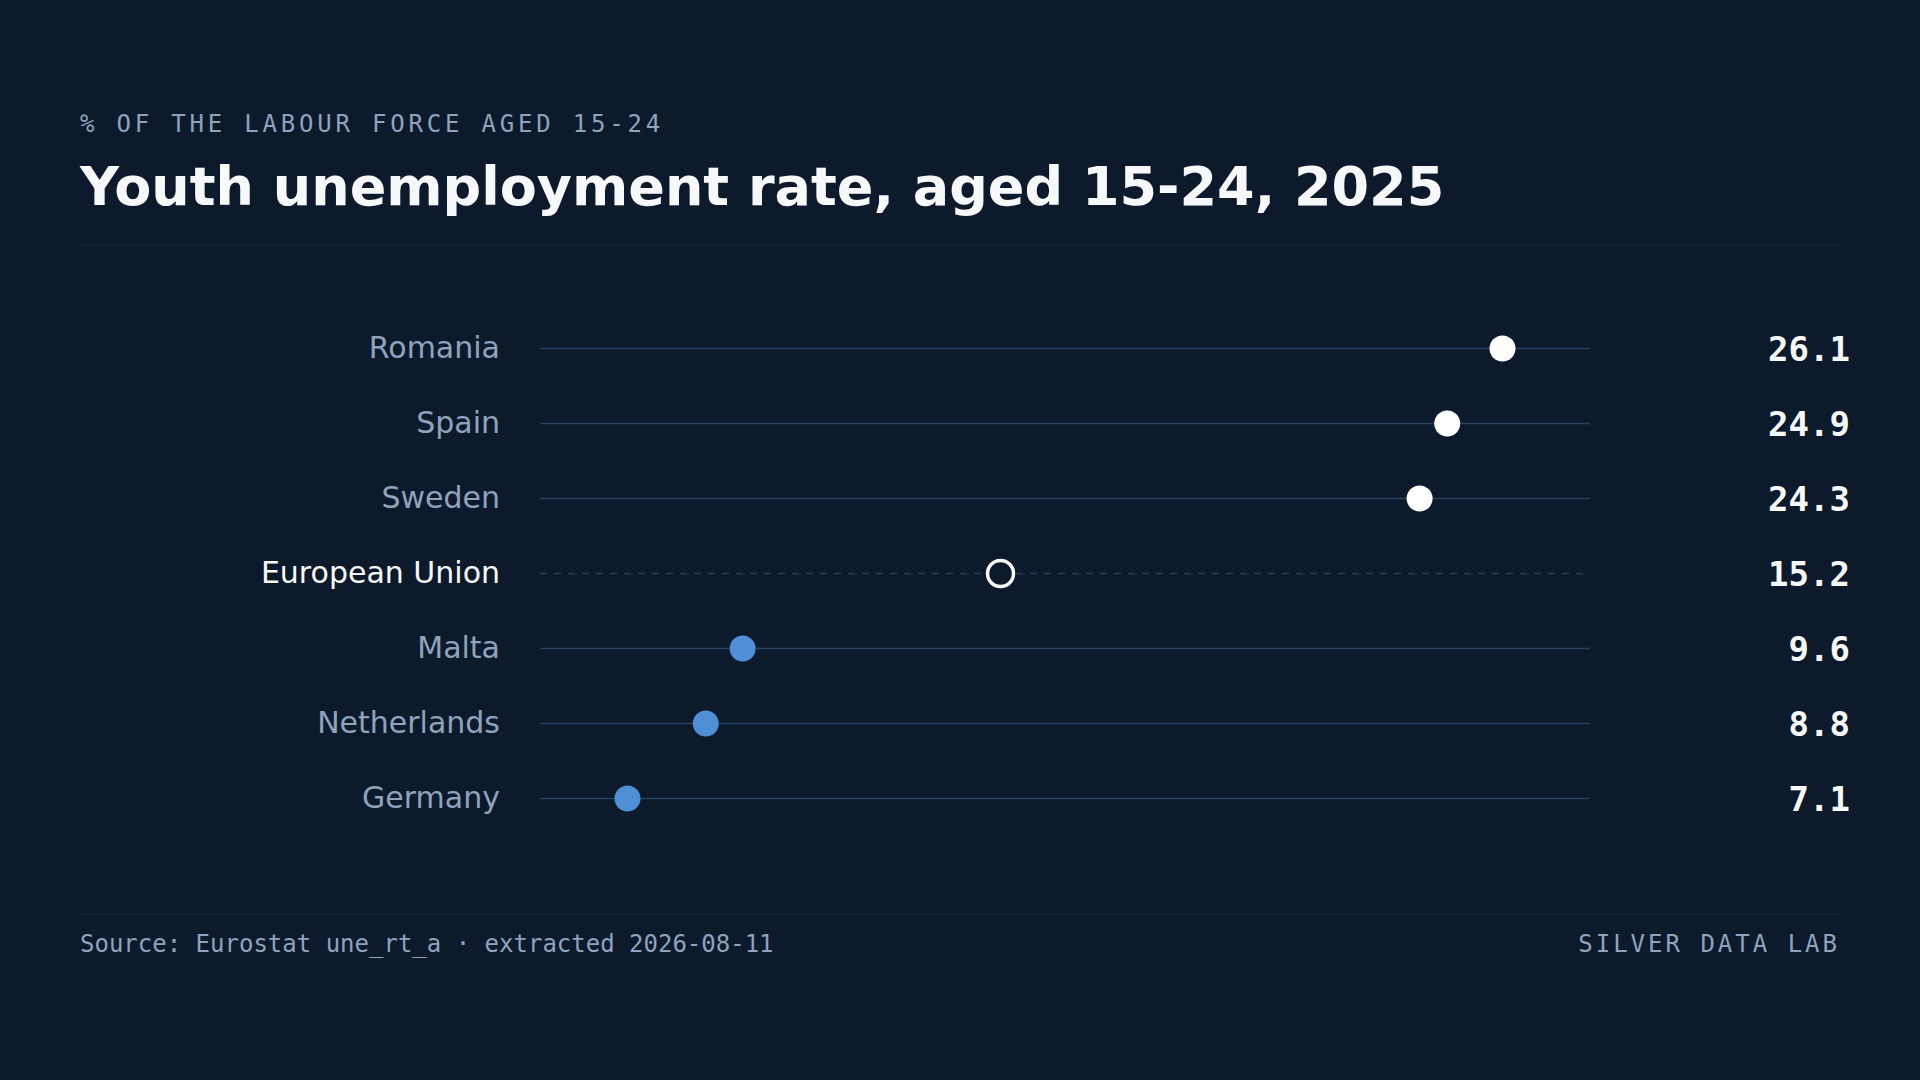
Sweden's Youth Unemployment Is Higher Than Greece's
15.2% of the EU labour force aged 15 to 24 was unemployed in 2025.