Sweden's Forests Absorb More Greenhouse Gas Than Its Economy Emits
Silver Data Lab Research Desk · Statistical analysis · Published on 25 April 2026
- Data source
- Eurostat
- Reference period
- 2024
- Last updated
- 11 October 2026
Re-checked against the source on 21 September 2026. No value in its datasets has moved between the snapshots we hold. Every revision we have observed →
Key estimates
- Sweden records net emissions of −6.7 million tonnes of CO2 equivalent in 2024: its land absorbs more than the rest of its economy emits.
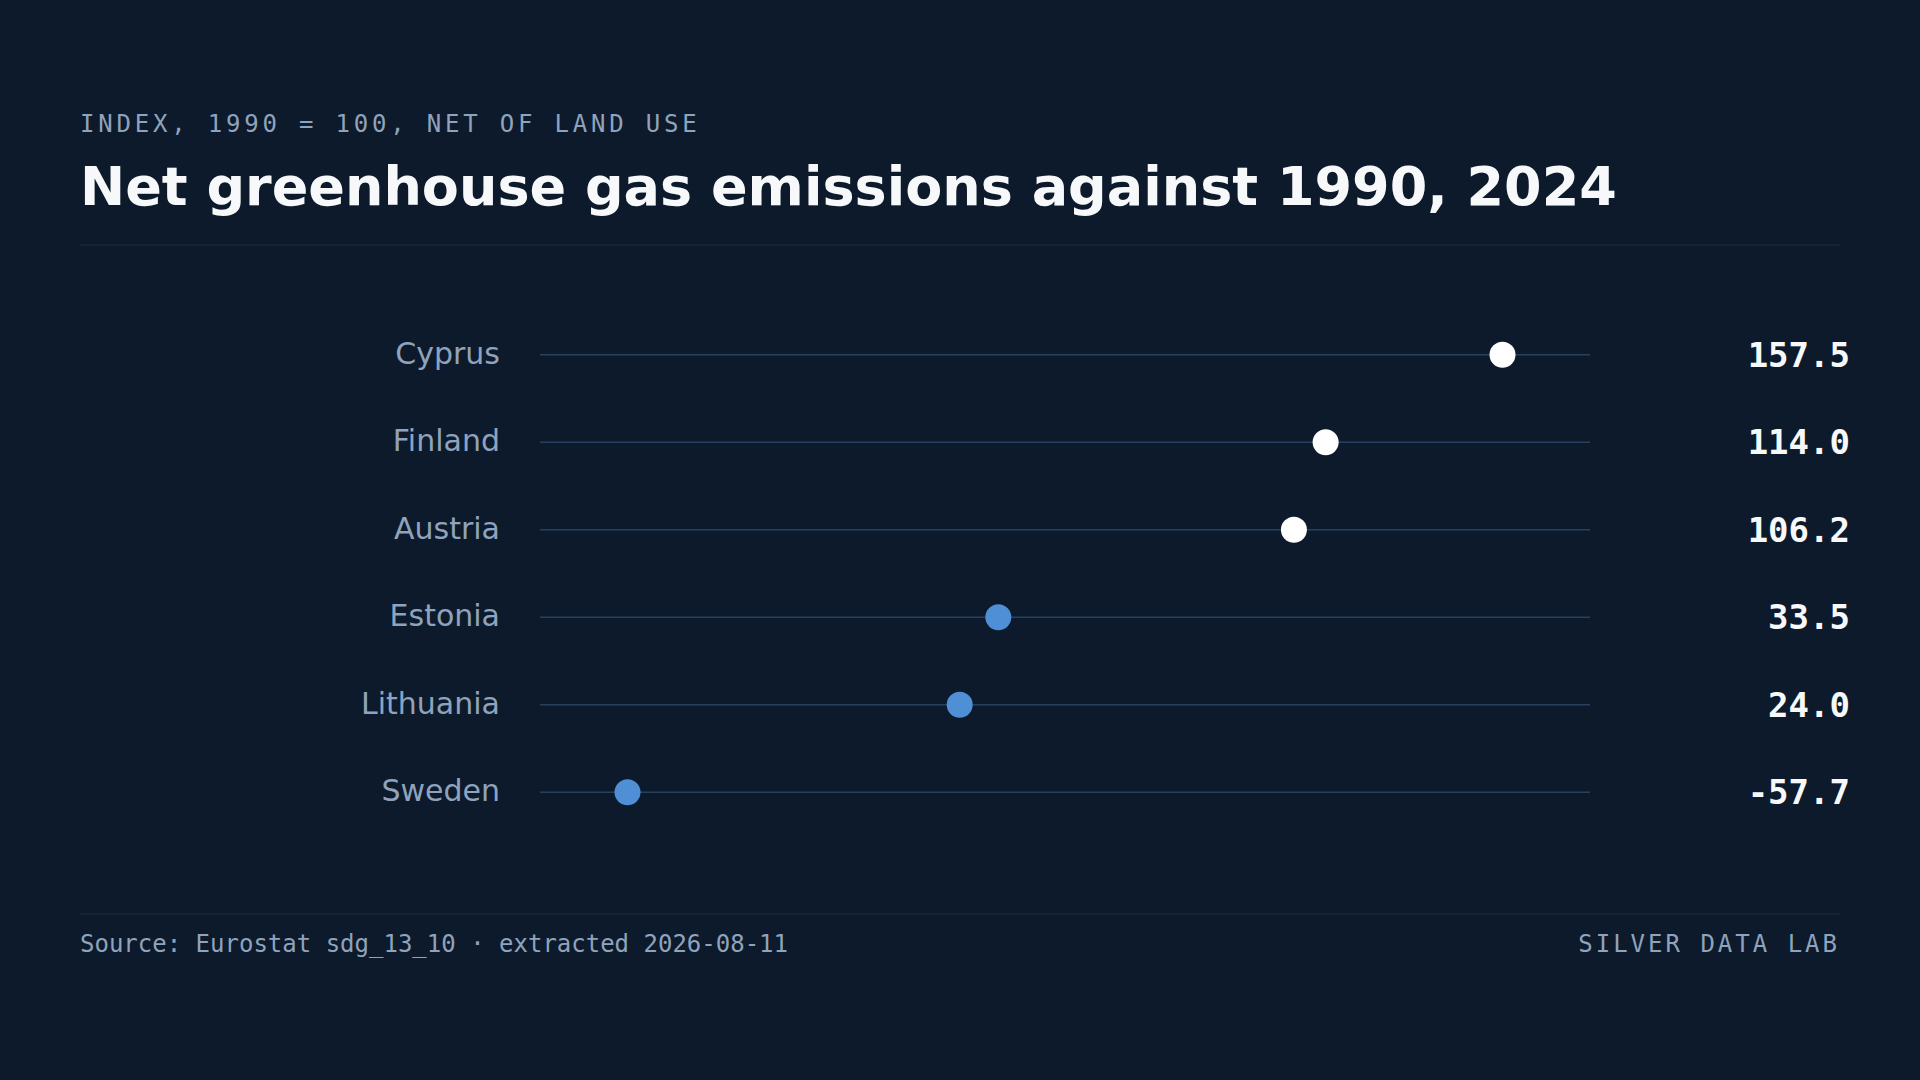
- Three Member States remain above their 1990 level: Cyprus at 157.5, Finland at 114.0 and Austria at 106.2 on an index where 1990 = 100.
- Lithuania has cut net emissions to 24.0% of its 1990 level, Romania to 27.7% and Estonia to 33.5%.
- Per head, Ireland emits the most at 10.5 tonnes and Luxembourg 10.1; Romania emits 3.4 and Lithuania 3.6.
- Excluding land use, only Cyprus is still above 1990: Finland reads 54.7 on that basis and Austria 83.6.
- Eurostat publishes no EU aggregate for this indicator, so this study reports none rather than computing one.
Net emissions, and why the sign can flip
Greenhouse gas accounting usually reports what an economy emits. This indicator reports what it emits net of what its land absorbs — forests, soils and other land use, which take carbon out of the atmosphere as well as putting it in.
That distinction is what allows a country to record a negative number, and one does. Sweden's net emissions in 2024 were −6.7 million tonnes of CO2 equivalent, or −0.6 tonnes per head. Its forests absorbed more than its industry, transport, agriculture and buildings emitted.
On an index where 1990 equals 100, Sweden reads −57.7. There is no other observation like it in the Union.
The three countries above their 1990 level
Thirty-four years after the baseline, three Member States still emit more on this measure than they did in 1990.
Cyprus records 157.5, more than half again above its starting point. Finland records 114.0 and Austria 106.2. Ireland, at 90.9, and Latvia, at 89.9, are the next closest to their baselines.
Two of those three are land-use stories rather than emissions stories, and the same table settles which. Measured excluding land use, Finland reads 54.7 against 1990: its emissions are down by nearly half, and everything that lifts it above its baseline comes from the land-use term. Austria reads 83.6 on that basis and would also sit well below 1990 without it. Cyprus reads 158.3, almost exactly its net figure — of the three it is the only one genuinely above 1990 on what its economy emits.
A country with very large forests is heavily exposed to changes in how much carbon those forests absorb, and this indicator counts that. Latvia shows it as sharply as Finland does: its net index of 89.9 falls to 37.0 once land use is taken out.
The countries furthest below 1990
At the other end, Lithuania records 24.0, Romania 27.7 and Estonia 33.5 — net emissions between a quarter and a third of their 1990 levels. Bulgaria at 42.2 and Slovakia at 44.4 follow.
This group is almost entirely central and eastern European, and 1990 is the reason. The baseline year sits immediately before the collapse of heavy industry across the former Eastern bloc, so a large part of the reduction these countries record was delivered by economic restructuring in the early 1990s rather than by climate policy since.
That does not make the figures wrong. It makes the index a poor instrument for comparing effort, which is a different question from the one it answers.
Emissions per head tell a different story
Ranked by emissions per capita rather than against 1990, the order changes substantially. Ireland records 10.5 tonnes per head, Luxembourg 10.1, and Cyprus and Estonia 8.9 each. At the bottom sit Romania at 3.4, Lithuania at 3.6 and Malta at 3.8.
Sweden appears at −0.6.
Ireland is the case where the two rankings most clearly disagree: at 90.9 against 1990 it looks like a laggard on progress, and at 10.5 tonnes per head it is the Union's largest emitter per person. Both readings are correct, and neither is the whole picture.
Two of the highest per-head emitters, Estonia and Ireland, also appear at opposite ends of the energy import dependency ranking, which is a reminder that these indicators are not measuring the same underlying thing.
Net greenhouse gas emissions against 1990, 2024
| Country | Index, 1990 = 100 |
|---|---|
| Cyprus | 157.5 |
| Finland | 114.0 |
| Austria | 106.2 |
| Romania | 27.7 |
| Lithuania | 24.0 |
| Sweden | -57.7 |
This table as data: CSV · JSON
Every Member State for this indicator+
Members see every Member State for this indicator here, not only the rows the ranking prints. Become a Member
Embed this chart
Paste this code into a page. The frame carries the source and the extraction date, and links back to the study.
Net greenhouse gas emissions per capita, 2024
| Country | Tonnes of CO2 equivalent per person |
|---|---|
| Ireland | 10.5 |
| Luxembourg | 10.1 |
| Cyprus | 8.9 |
| Lithuania | 3.6 |
| Romania | 3.4 |
| Sweden | -0.6 |
This table as data: CSV · JSON
Every Member State for this indicator+
Members see every Member State for this indicator here, not only the rows the ranking prints. Become a Member
Embed this chart
Paste this code into a page. The frame carries the source and the extraction date, and links back to the study.
What these figures cannot tell you
- Net of land use, which makes the series volatile
- This indicator includes land use, land-use change and forestry. Carbon absorption by forests varies with harvesting, growth, fire and disease, so a country with a large forest sector can see its net figure move substantially for reasons unrelated to its economy. Finland and Austria are above their 1990 level only because of it: excluding land use they read 54.7 and 83.6 rather than 114.0 and 106.2.
- The 1990 baseline rewards a specific history
- For the central and eastern Member States, 1990 immediately precedes the collapse of Soviet-era heavy industry. Much of the reduction those countries record against the baseline was delivered by that collapse rather than by policy, and the index therefore compares distance travelled from very different starting points.
- Eurostat publishes no EU aggregate here
- This dataset contains no EU-level value, so no reference line appears on the chart and none is quoted in the text. An EU figure could be computed by summing Member States, but it would be our number rather than the source's, and this site does not publish aggregates the source declines to publish.
- Territorial emissions, not consumption
- The accounts cover emissions produced inside each country's borders. Emissions embodied in imported goods are attributed to the country that produced them, so economies that have moved manufacturing abroad record lower figures than their consumption implies.
Frequently asked questions
- How can a country have negative greenhouse gas emissions?
- Because this indicator is measured net of land use. Sweden's forests and soils absorbed more carbon in 2024 than the rest of its economy emitted, giving net emissions of −6.7 million tonnes of CO2 equivalent, or −0.6 tonnes per head.
- Which EU countries still emit more than in 1990?
- Three on this measure: Cyprus at 157.5, Finland at 114.0 and Austria at 106.2 on an index where 1990 equals 100. Measured excluding land use, only Cyprus remains above its baseline, at 158.3; Finland reads 54.7 and Austria 83.6, so both are above 1990 only because of what their land does.
- Which EU country emits the most per person?
- Ireland, at 10.5 tonnes of CO2 equivalent per head in 2024, ahead of Luxembourg at 10.1, and Cyprus and Estonia at 8.9. The lowest are Romania at 3.4 and Lithuania at 3.6, with Sweden negative at −0.6.
- Why is there no EU average on these charts?
- Because Eurostat publishes none for this indicator. An EU figure could be assembled by summing the Member States, but it would be our calculation rather than the source's, and this site does not publish aggregates the source itself declines to publish.
Methodological note
The indicator is Eurostat's domestic net greenhouse gas emissions, total excluding memo items, which includes land use, land-use change and forestry. It is published in three units: million tonnes of CO2 equivalent, tonnes per capita, and an index against 1990.
Values are for 2024, the most recent year with complete coverage of the 27 Member States at the extraction date.
Eurostat publishes no EU aggregate for this indicator. This study reports none, and the ranking chart carries no reference row, rather than substituting a figure computed here.
The same table is extracted a second time on the other basis — total excluding land use, land-use change and forestry — and that extraction is the source of the figures for Finland, Austria, Cyprus and Latvia measured without the land-use term. The two bases are never mixed inside a ranking: both charts here are on the net basis, and the gross figures appear only in the text, named as such.
The observation that three Member States remain above their 1990 level, and the comparison between the index ranking and the per-capita ranking, are derived by Silver Data Lab from the published series.
All three units are archived: the index and per-capita series were extracted on 11 August 2026 and the million-tonne series on 11 September 2026, so every figure quoted here can be rechecked against a file held in this repository.
Source data
This study draws on 3 datasets from Eurostat. Each can be inspected and re-downloaded from its catalogue, and the filters below are the ones applied.
Domestic net greenhouse gas emissions
sdg_13_10
- Filters applied:
- freq=A · src_crf=TOTXMEMO · unit=I90, T_HAB · time=2024
- Extracted:
- 2026-08-11
- Source last updated:
- 2026-04-22
Domestic net greenhouse gas emissions — absolute volumes
sdg_13_10
- Filters applied:
- freq=A · src_crf=TOTXMEMO · unit=MTCO2E · time=2024
- Extracted:
- 2026-09-11
- Source last updated:
- 2026-04-22
Greenhouse gas emissions excluding land use, land-use change and forestry
sdg_13_10
- Filters applied:
- freq=A · src_crf=TOTX4_MEMO · unit=I90 · time=2024
- Extracted:
- 2026-09-21
- Source last updated:
- 2026-04-22
Download the data
The data the study you have just read is built on, exactly as it was downloaded and archived.
Yours as a Member.
Data downloadable by Members
How to cite
Record the vintage as well as the study: the figures on this page are the ones extracted on the dates below.
Silver Data Lab Research Desk (2026). Sweden's Forests Absorb More Greenhouse Gas Than Its Economy Emits. Silver Data Lab, published 25 April 2026, last updated 11 October 2026. https://www.silverdatalab.com/studies/greenhouse-gas-emissions-in-the-eu
- Data: Eurostat, Domestic net greenhouse gas emissions (sdg_13_10), filters freq=A, src_crf=TOTXMEMO, unit=I90, T_HAB, time=2024; extracted 2026-08-11; source last updated 2026-04-22. https://doi.org/10.2908/sdg_13_10
- Data: Eurostat, Domestic net greenhouse gas emissions — absolute volumes (sdg_13_10), filters freq=A, src_crf=TOTXMEMO, unit=MTCO2E, time=2024; extracted 2026-09-11; source last updated 2026-04-22. https://doi.org/10.2908/sdg_13_10
- Data: Eurostat, Greenhouse gas emissions excluding land use, land-use change and forestry (sdg_13_10), filters freq=A, src_crf=TOTX4_MEMO, unit=I90, time=2024; extracted 2026-09-21; source last updated 2026-04-22. https://doi.org/10.2908/sdg_13_10
Silver Data Lab's analysis is licensed CC BY 4.0. The statistics remain their publisher's and keep its terms of reuse.
Ask the research desk
A question about this study — a definition, a filter, a break in the series, what the figures can and cannot support — answered by the desk that made the extraction.
Members can write to the research desk
Other studies on the same dataset
Studies where the same country leads or trails
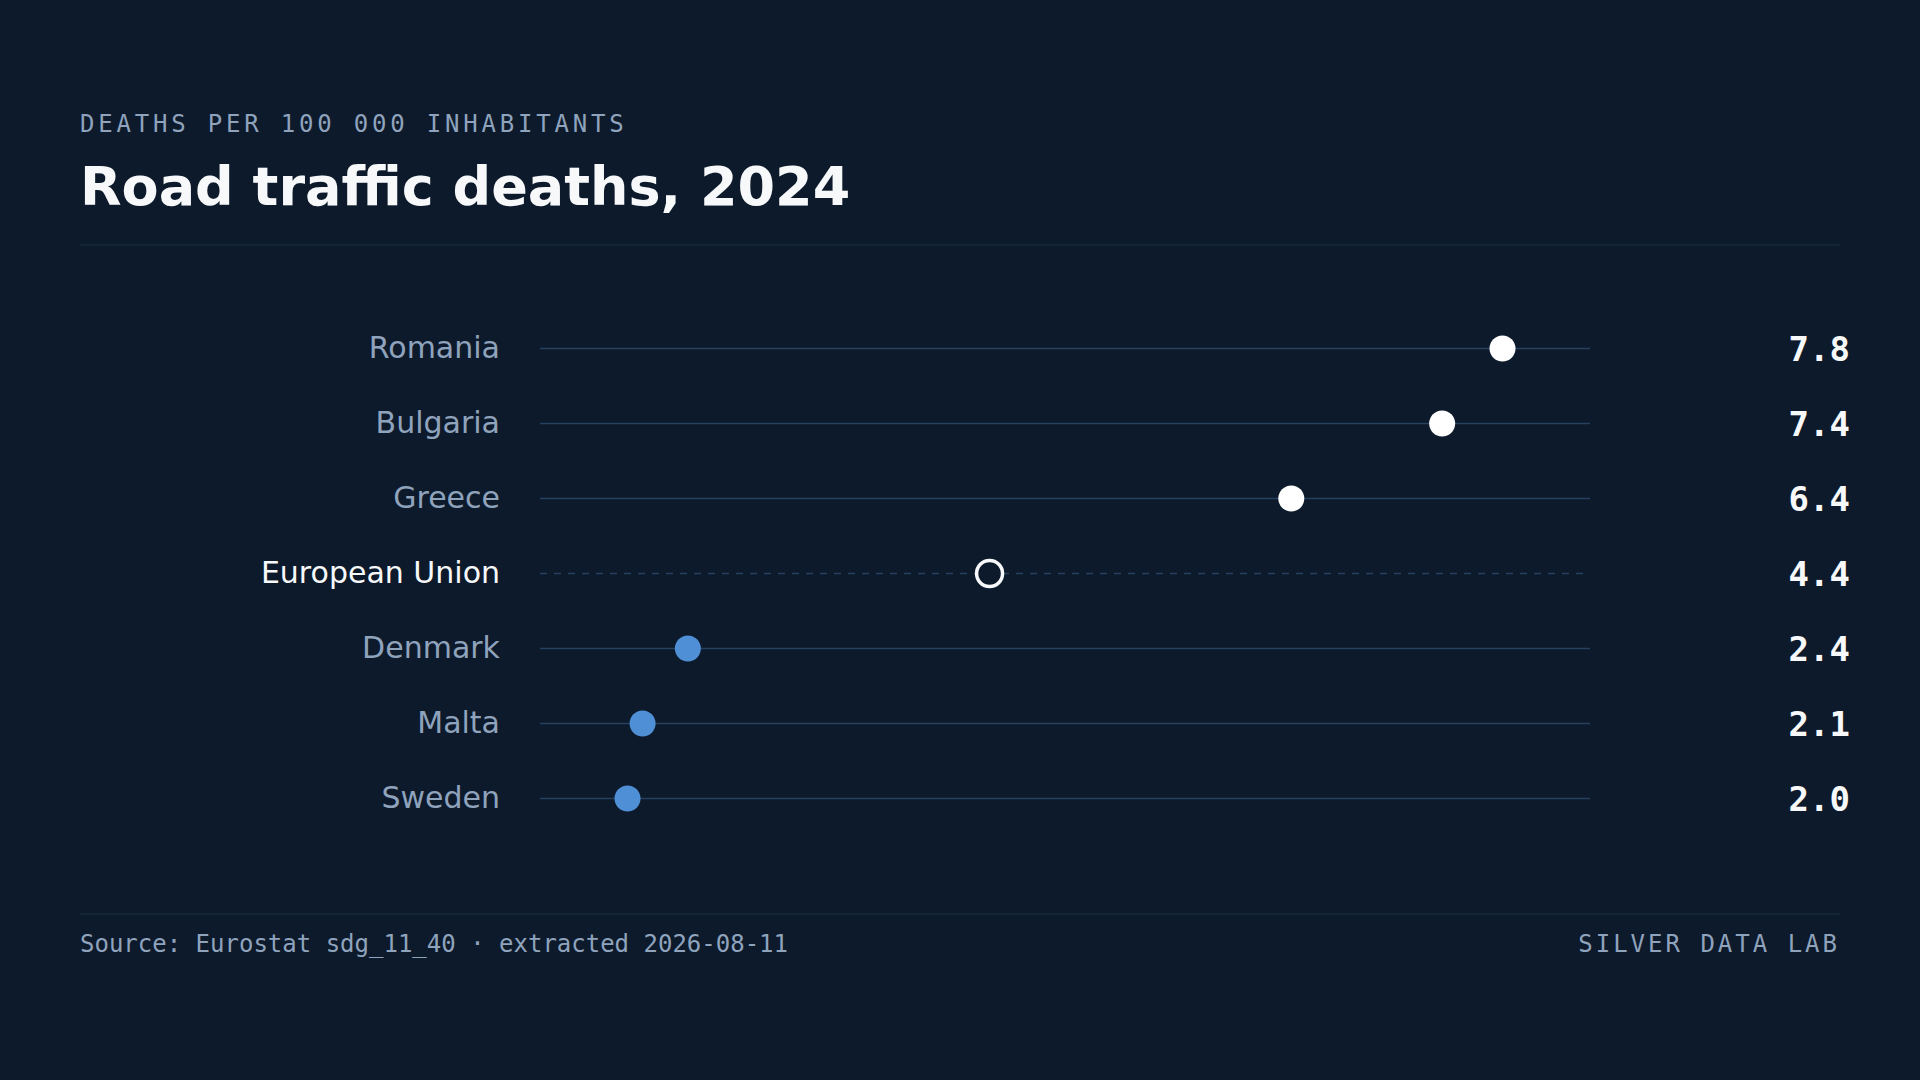
In Romania the Risk of Dying on the Road Is Nearly Four Times Sweden's
19,933 people were killed on the roads of the European Union in 2024: 4.4 deaths per 100,000 inhabitants.
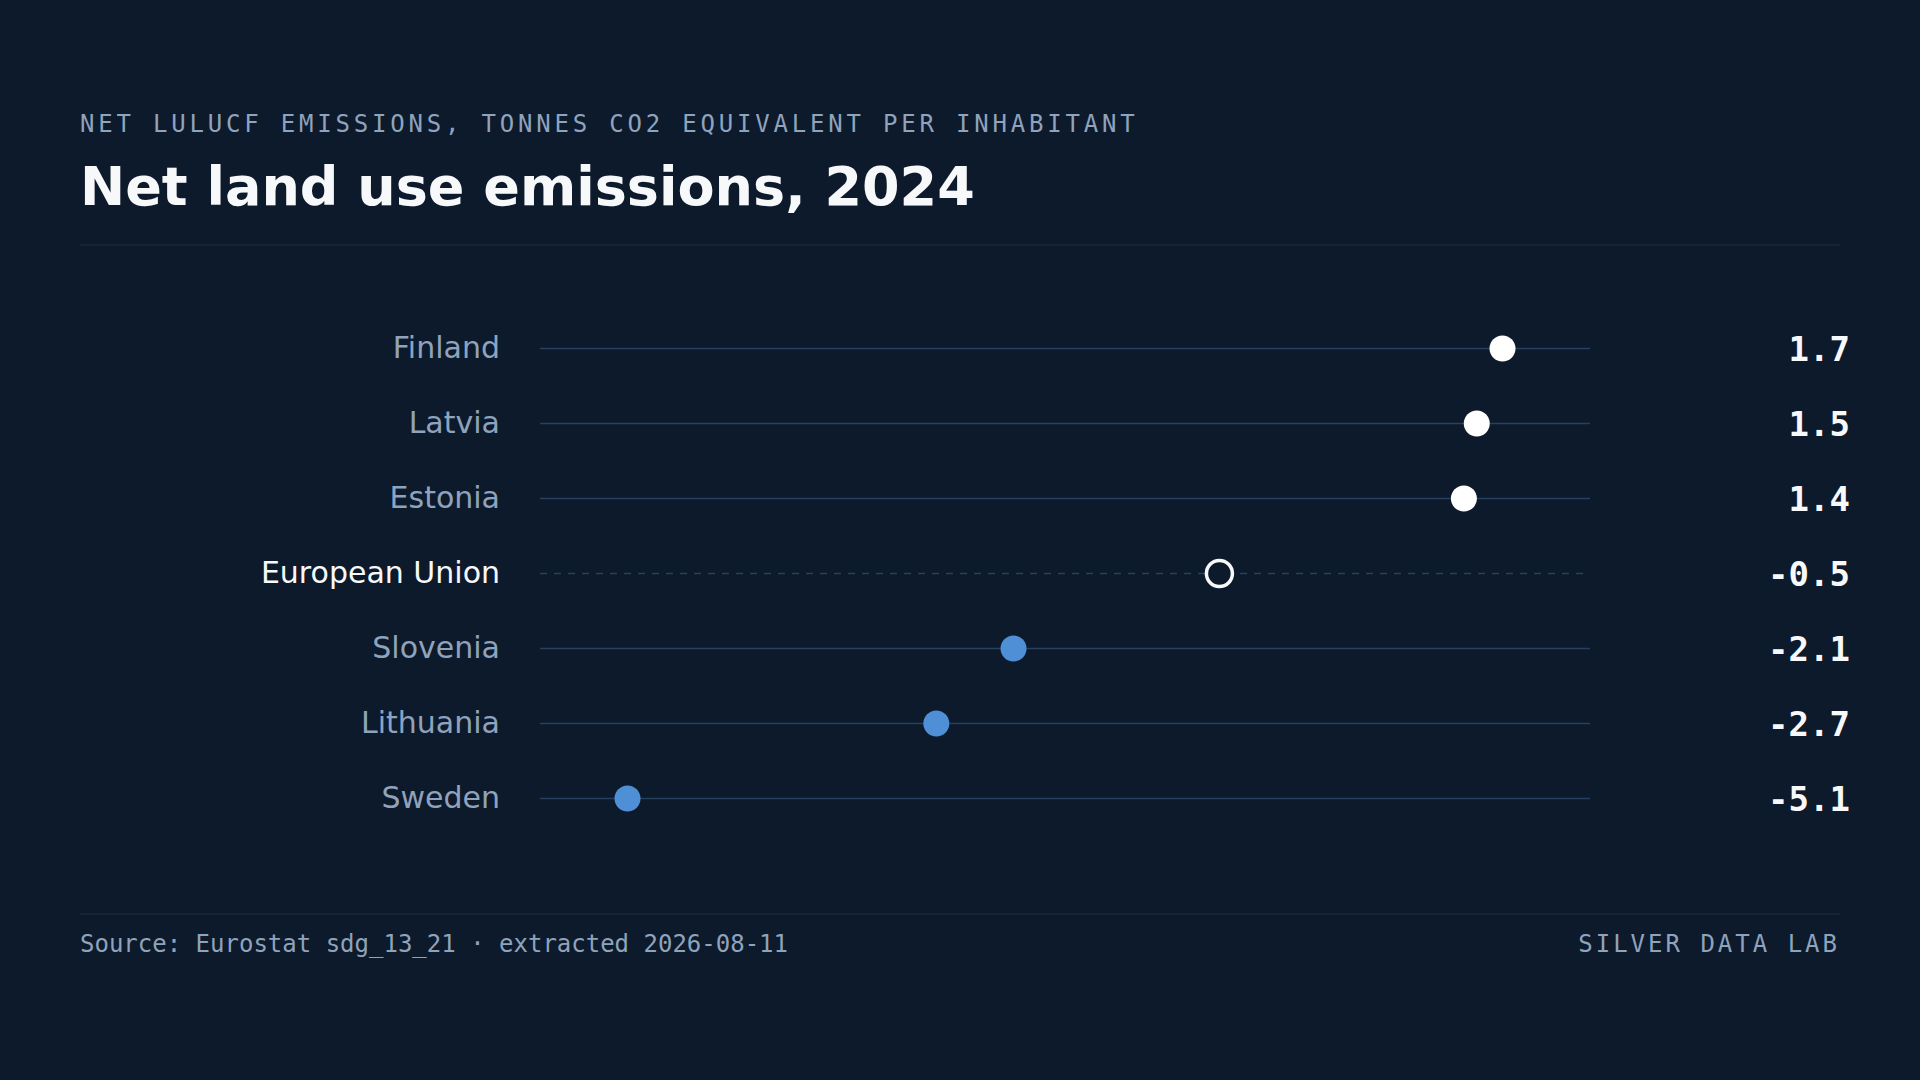
Finland's Land Now Emits More Carbon Than It Absorbs
EU land, forests and soils removed a net 0.5 tonnes of CO2 equivalent per inhabitant in 2024.
Germany Buys More Services From Abroad Than It Sells
Malta records a services trade surplus worth 33.2% of GDP, Luxembourg 30.3% and Cyprus 27.4%.