One EU Method Counts More Than Twice the Danish Emissions Another Does
Silver Data Lab Research Desk · Statistical analysis · Published on 11 August 2026
- Data source
- Eurostat
- Reference period
- 2024
- Last updated
- 11 October 2026
Re-checked against the source on 11 August 2026. No value in its datasets has moved between the snapshots we hold. Every revision we have observed →
Key estimates
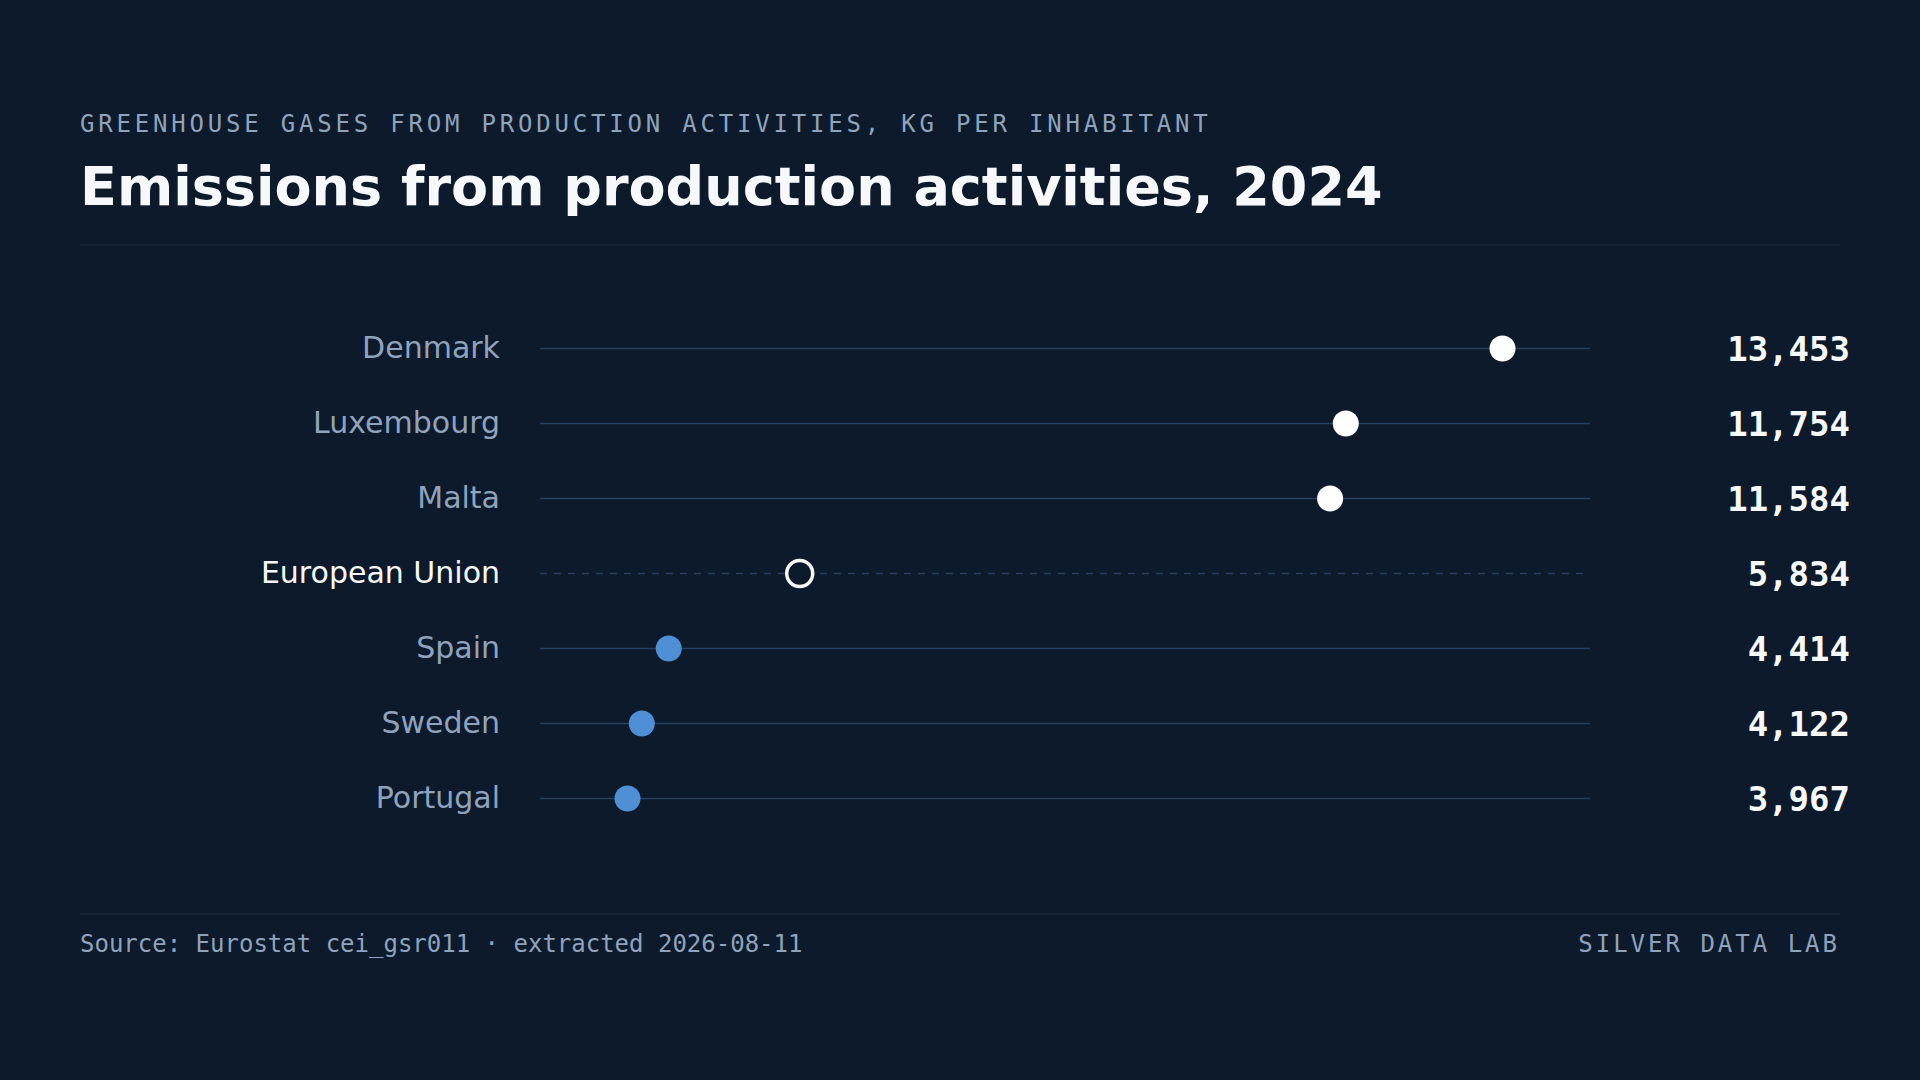
- On the air emissions accounts basis the EU emitted 5,834 kg of CO2 equivalent per inhabitant from production activities in 2024.
- Denmark records 13,453 kg per inhabitant — the highest in the Union on this measure.
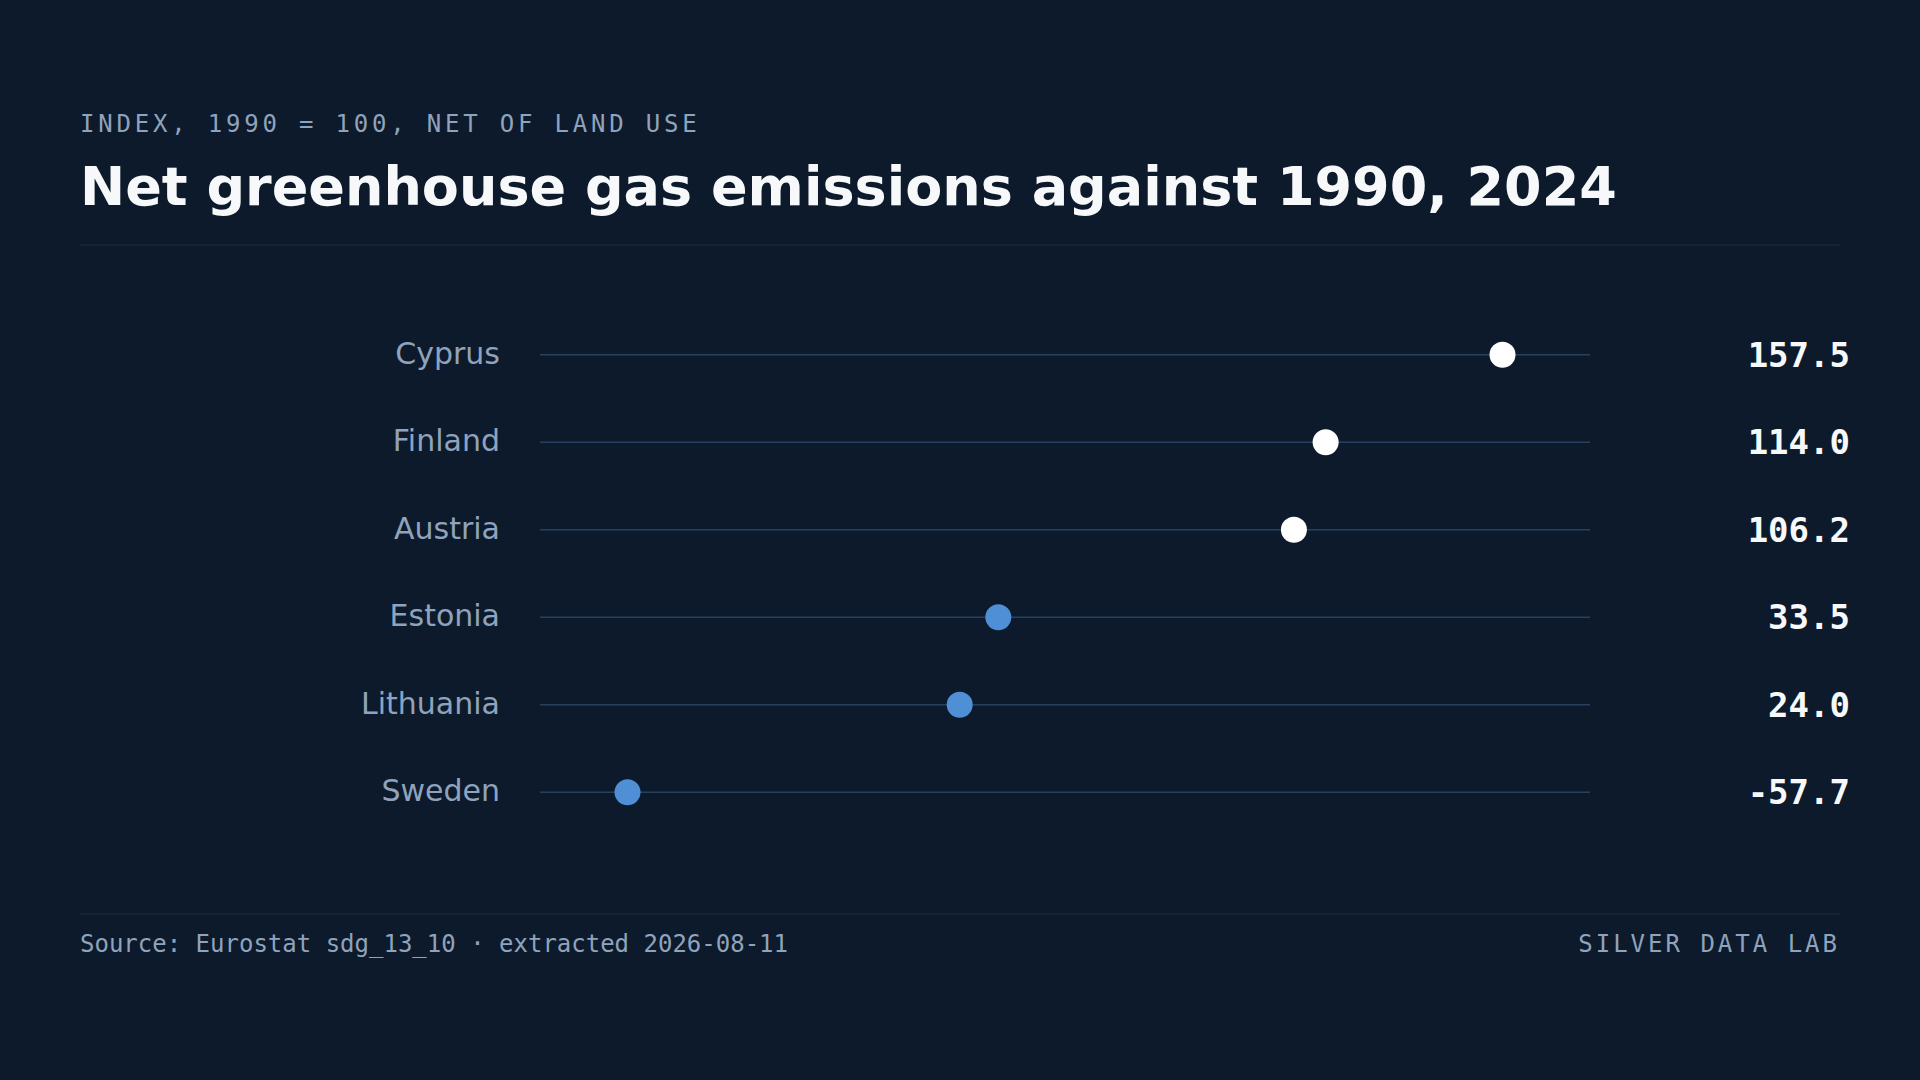
- On the national inventory basis Denmark records 6.1 tonnes per inhabitant, less than half as much.
- Malta shows the same divergence: 11.6 tonnes on the accounts basis against 3.8 on the inventory basis.
- Germany moves the other way, from 8.5 tonnes on the inventory basis to 6.3 on the accounts basis.
Two numbers, both official, both correct
The European Union publishes greenhouse gas emissions on two different bases, and for some Member States they disagree by more than a factor of two.
The national inventory basis counts emissions released inside a country's territory. It is the basis used for climate targets and for the companion study on this site, and on it Denmark emits 6.1 tonnes of CO2 equivalent per inhabitant.
The air emissions accounts basis counts emissions produced by economic units resident in a country, wherever in the world they operate. On it, Denmark emits 13.5 tonnes per inhabitant.
Neither figure is wrong. They answer different questions.
Where the gap comes from
The largest single source of divergence is international transport, and shipping above all.
A vessel operated by a Danish company sailing between two ports outside Denmark burns fuel that never enters Danish territory. Under the territorial inventory it is not Denmark's. Under the accounts basis, which follows the resident operator, it is.
Denmark is home to one of the world's largest container shipping operations. Malta, whose divergence is larger still, hosts one of the world's largest ship registries. Both records follow directly from that.
The full comparison
Nine Member States sit clearly higher on the accounts basis than on the inventory basis, and Spain is level at 4.4 tonnes on both. Ranked by how far it exceeds: Malta plus 7.8 tonnes per inhabitant, Denmark plus 7.4, Sweden plus 4.7, Lithuania plus 3.7, Luxembourg plus 1.7 and Romania plus 1.5. Ireland, Bulgaria and Slovenia follow, each by under a tonne.
Sweden is the case worth pausing on. On the inventory basis Sweden records minus 0.6 tonnes per inhabitant — net negative, because its land sink exceeds its territorial emissions. On the accounts basis it records 4.1 tonnes. A country that appears to have solved the problem on one measure appears ordinary on the other.
Several Member States move the other way. Germany falls from 8.5 tonnes on the inventory basis to 6.3 on the accounts basis, Finland from 8.7 to 6.6, Estonia from 8.9 to 7.0 and Austria from 7.6 to 5.9. These are countries where emissions occur on their territory from activity that the accounts attribute elsewhere, or where the inventory includes land use and household emissions that the production accounts exclude.
What this is not
This is not a claim that any Member State is misreporting. Both series are compiled to international standards, published by the same statistical authority, and correct on their own definitions.
It is a claim about how emissions figures should be read. A number quoted without its basis is ambiguous for at least six Member States, and the ambiguity is larger than most of the year-on-year changes that get reported as progress.
Which one to use
For compliance with climate targets, the inventory basis is the relevant one: that is what the framework is written against.
For asking what an economy's activity causes, the accounts basis has the better claim, because it does not stop counting at a border that ships and aircraft cross by design.
For comparing countries, the only safe rule is to use one basis throughout and say which. This site uses the inventory basis in the environment and energy category and the accounts basis here, and each study names its own.
Emissions from production activities, 2024
| Country | kg CO2 equivalent per inhabitant | Gap to EU averagederived |
|---|---|---|
| Denmark | 13,453i | +7,619.0 |
| Luxembourg | 11,754i | +5,920.0 |
| Malta | 11,584i | +5,750.0 |
| European Unionaggregate | 5,834i | — |
| Spain | 4,414e | −1,420.0 |
| Sweden | 4,122 | −1,712.0 |
| Portugal | 3,967i | −1,867.0 |
Flags carried by the source on these values: e estimated · i value imputed by Eurostat
This table as data: CSV · JSON
Every Member State for this indicator+
Members see every Member State for this indicator here, not only the rows the ranking prints. Become a Member
Embed this chart
Paste this code into a page. The frame carries the source and the extraction date, and links back to the study.
What these figures cannot tell you
- The two series do not cover the same emissions
- Beyond the residence principle, the accounts basis covers emissions from production activities and households separately, while the inventory includes land use and land use change. The comparison in this study is between published totals and not between identical scopes.
- Attribution to a resident operator is a convention
- The accounts basis assigns emissions to the country where the operating unit is resident, which may be neither where the activity happens nor where the resulting goods are consumed. A consumption basis would rank countries differently again.
- Per-inhabitant amplifies small countries
- Malta and Luxembourg have very small populations relative to the international activity attributed to them, so the divergence is largest where the denominator is smallest.
- Two reference years, two releases
- The inventory figures quoted for comparison come from a separate extraction with its own update date. Both are for 2024, but they were compiled and released independently.
Frequently asked questions
- Why do EU emissions figures differ between sources?
- Because two official bases exist. The national inventory counts emissions released inside a country's borders; the air emissions accounts count emissions from economic units resident in a country wherever they operate. For Denmark the two differ by more than a factor of two.
- Which EU country emits the most greenhouse gases per person?
- On the air emissions accounts basis, Denmark, at 13,453 kg of CO2 equivalent per inhabitant from production activities in 2024, ahead of Luxembourg and Malta. On the national inventory basis the ranking is different and Denmark is not first.
- Why is Denmark so high on one measure?
- Because it is home to one of the world's largest container shipping operations. Fuel burnt by Danish-operated vessels sailing between foreign ports is attributed to Denmark under the accounts basis and to nobody's territory under the inventory basis. Malta, which hosts a large ship registry, shows the same pattern.
- Which measure should be used for climate targets?
- The national inventory basis, because that is what the climate framework is written against. The accounts basis is the better measure of what a country's economic activity causes, since it does not stop counting at a border that ships and aircraft cross by design.
Methodological note
Eurostat publishes air emissions accounts for greenhouse gases by NACE activity, expressed in kilograms of CO2 equivalent per inhabitant. This study uses the total across all production activities for 2024.
The inventory figures quoted for comparison come from the greenhouse gas inventory series used in the environment and energy category on this site, at tonnes per inhabitant, net of land use and land use change. It is declared below as a source of its own, so every figure on this page can be followed back to a query of its own. That series publishes no EU aggregate, so no EU-level comparison between the two bases is made here.
The differences between the two bases for individual Member States are computed by Silver Data Lab by subtracting the published inventory value from the published accounts value, and are labelled as derived. Eurostat does not publish that difference.
Source data
This study draws on 2 datasets from Eurostat. Each can be inspected and re-downloaded from its catalogue, and the filters below are the ones applied.
Greenhouse gas emissions from production activities
cei_gsr011
- Filters applied:
- freq=A · airpol=GHG · nace_r2=TOTAL · unit=KG_HAB · time=2024
- Extracted:
- 2026-08-11
- Source last updated:
- 2026-08-07
Net greenhouse gas emissions — national inventory basis
sdg_13_10
- Filters applied:
- freq=A · src_crf=TOTXMEMO · unit=T_HAB · time=2024
- Extracted:
- 2026-08-11
- Source last updated:
- 2026-04-22
Download the data
The data the study you have just read is built on, exactly as it was downloaded and archived.
Yours as a Member.
Data downloadable by Members
How to cite
Record the vintage as well as the study: the figures on this page are the ones extracted on the dates below.
Silver Data Lab Research Desk (2026). One EU Method Counts More Than Twice the Danish Emissions Another Does. Silver Data Lab, published 11 August 2026, last updated 11 October 2026. https://www.silverdatalab.com/studies/how-eu-emissions-are-measured
- Data: Eurostat, Greenhouse gas emissions from production activities (cei_gsr011), filters freq=A, airpol=GHG, nace_r2=TOTAL, unit=KG_HAB, time=2024; extracted 2026-08-11; source last updated 2026-08-07. https://doi.org/10.2908/cei_gsr011
- Data: Eurostat, Net greenhouse gas emissions — national inventory basis (sdg_13_10), filters freq=A, src_crf=TOTXMEMO, unit=T_HAB, time=2024; extracted 2026-08-11; source last updated 2026-04-22. https://doi.org/10.2908/sdg_13_10
Silver Data Lab's analysis is licensed CC BY 4.0. The statistics remain their publisher's and keep its terms of reuse.
Ask the research desk
A question about this study — a definition, a filter, a break in the series, what the figures can and cannot support — answered by the desk that made the extraction.
Members can write to the research desk
Other studies on the same dataset
Studies where the same country leads or trails
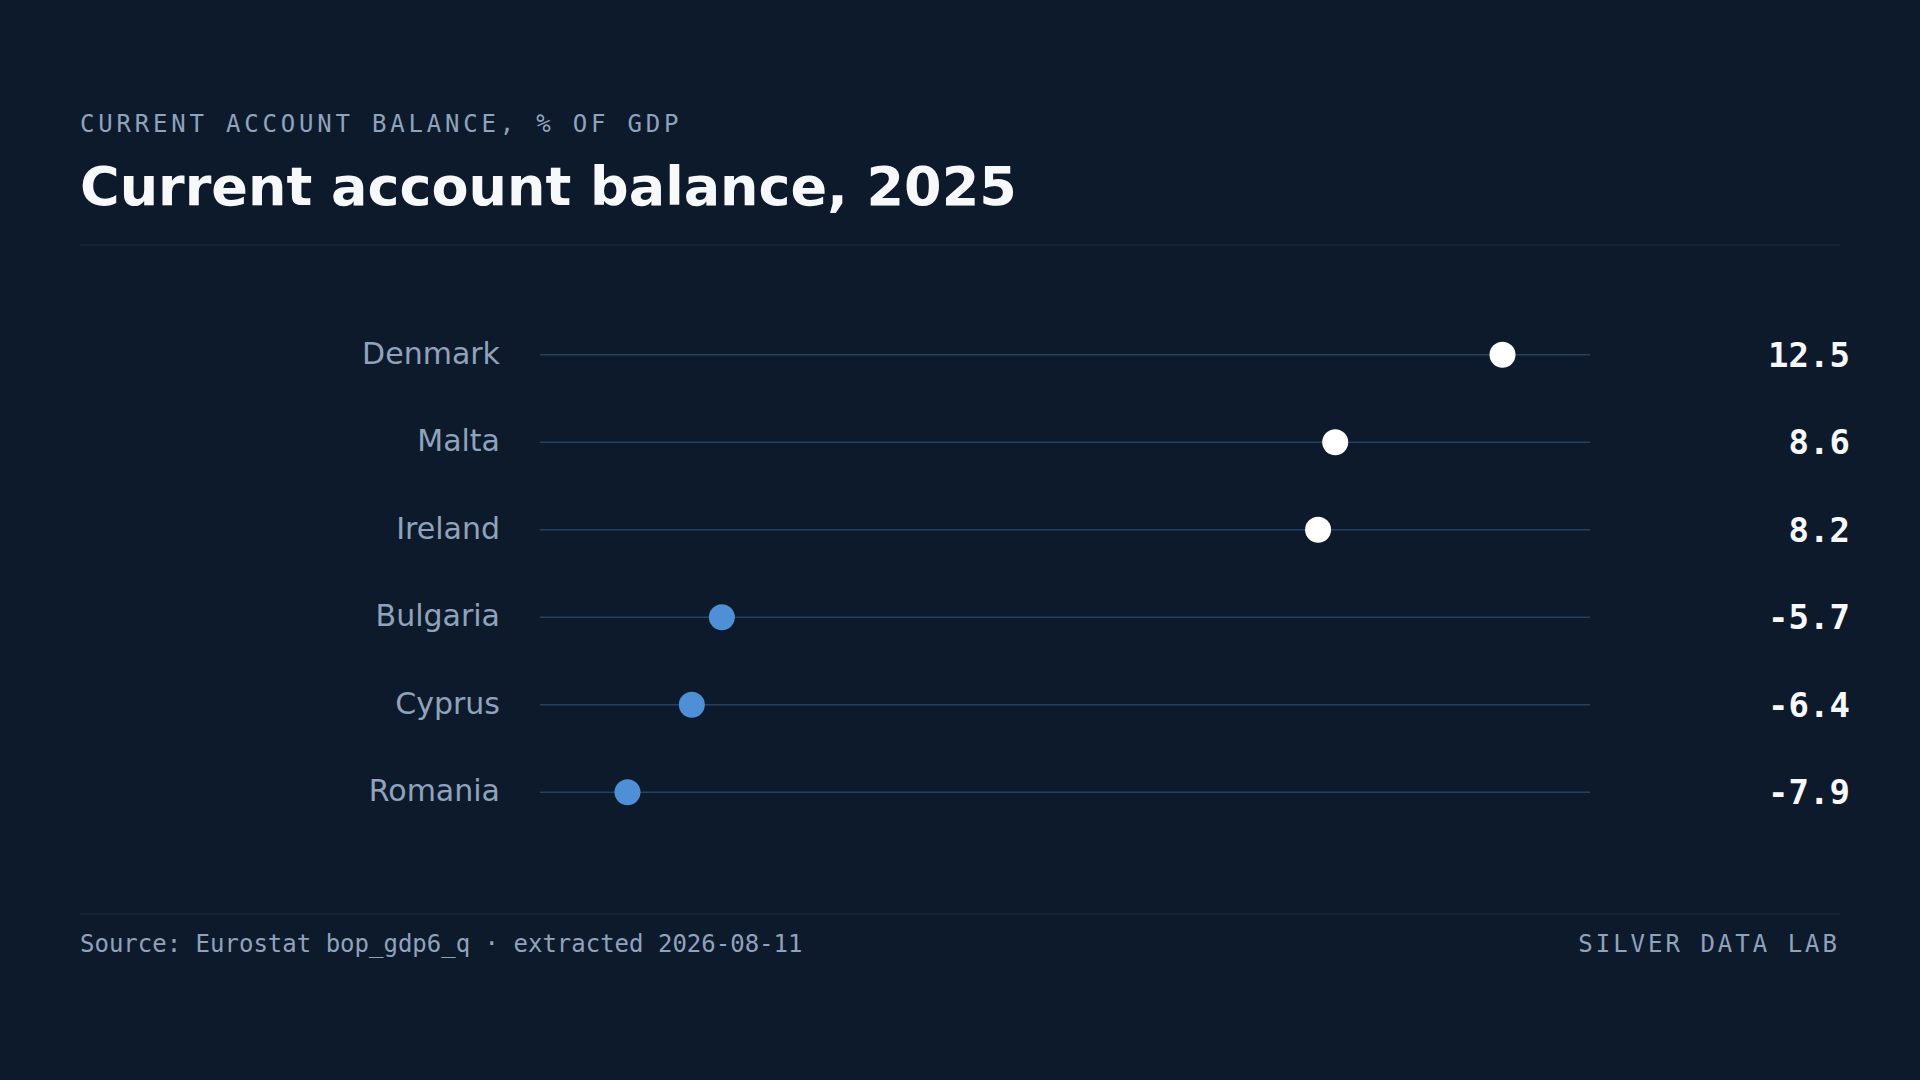
Denmark Has the EU's Biggest Surplus With the World, at 12.3% of GDP
Denmark ran a current account surplus worth 12.3% of GDP in 2025, the largest in the Union.
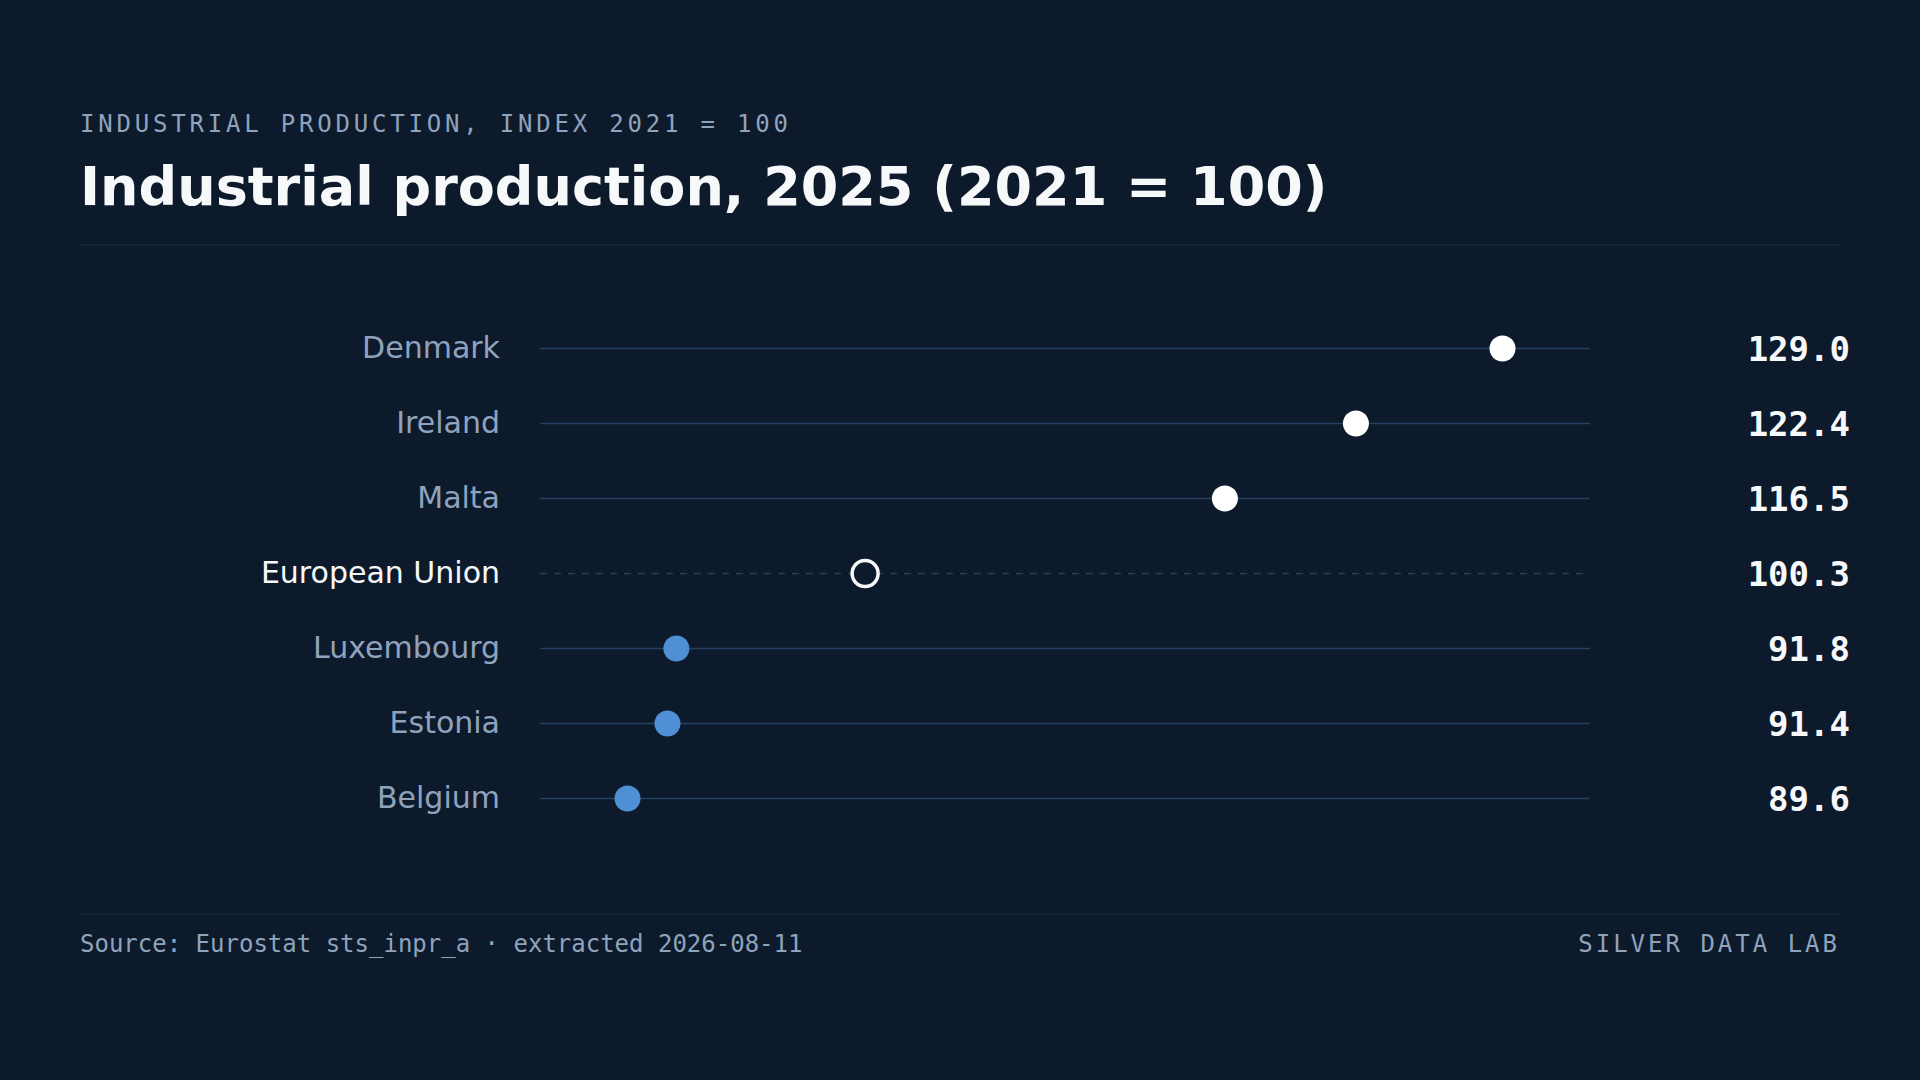
EU Industrial Output Is Where It Was Four Years Ago
EU industrial production in 2025 stood at 100.4 against a 2021 base of 100 — output is essentially unchanged after four years.
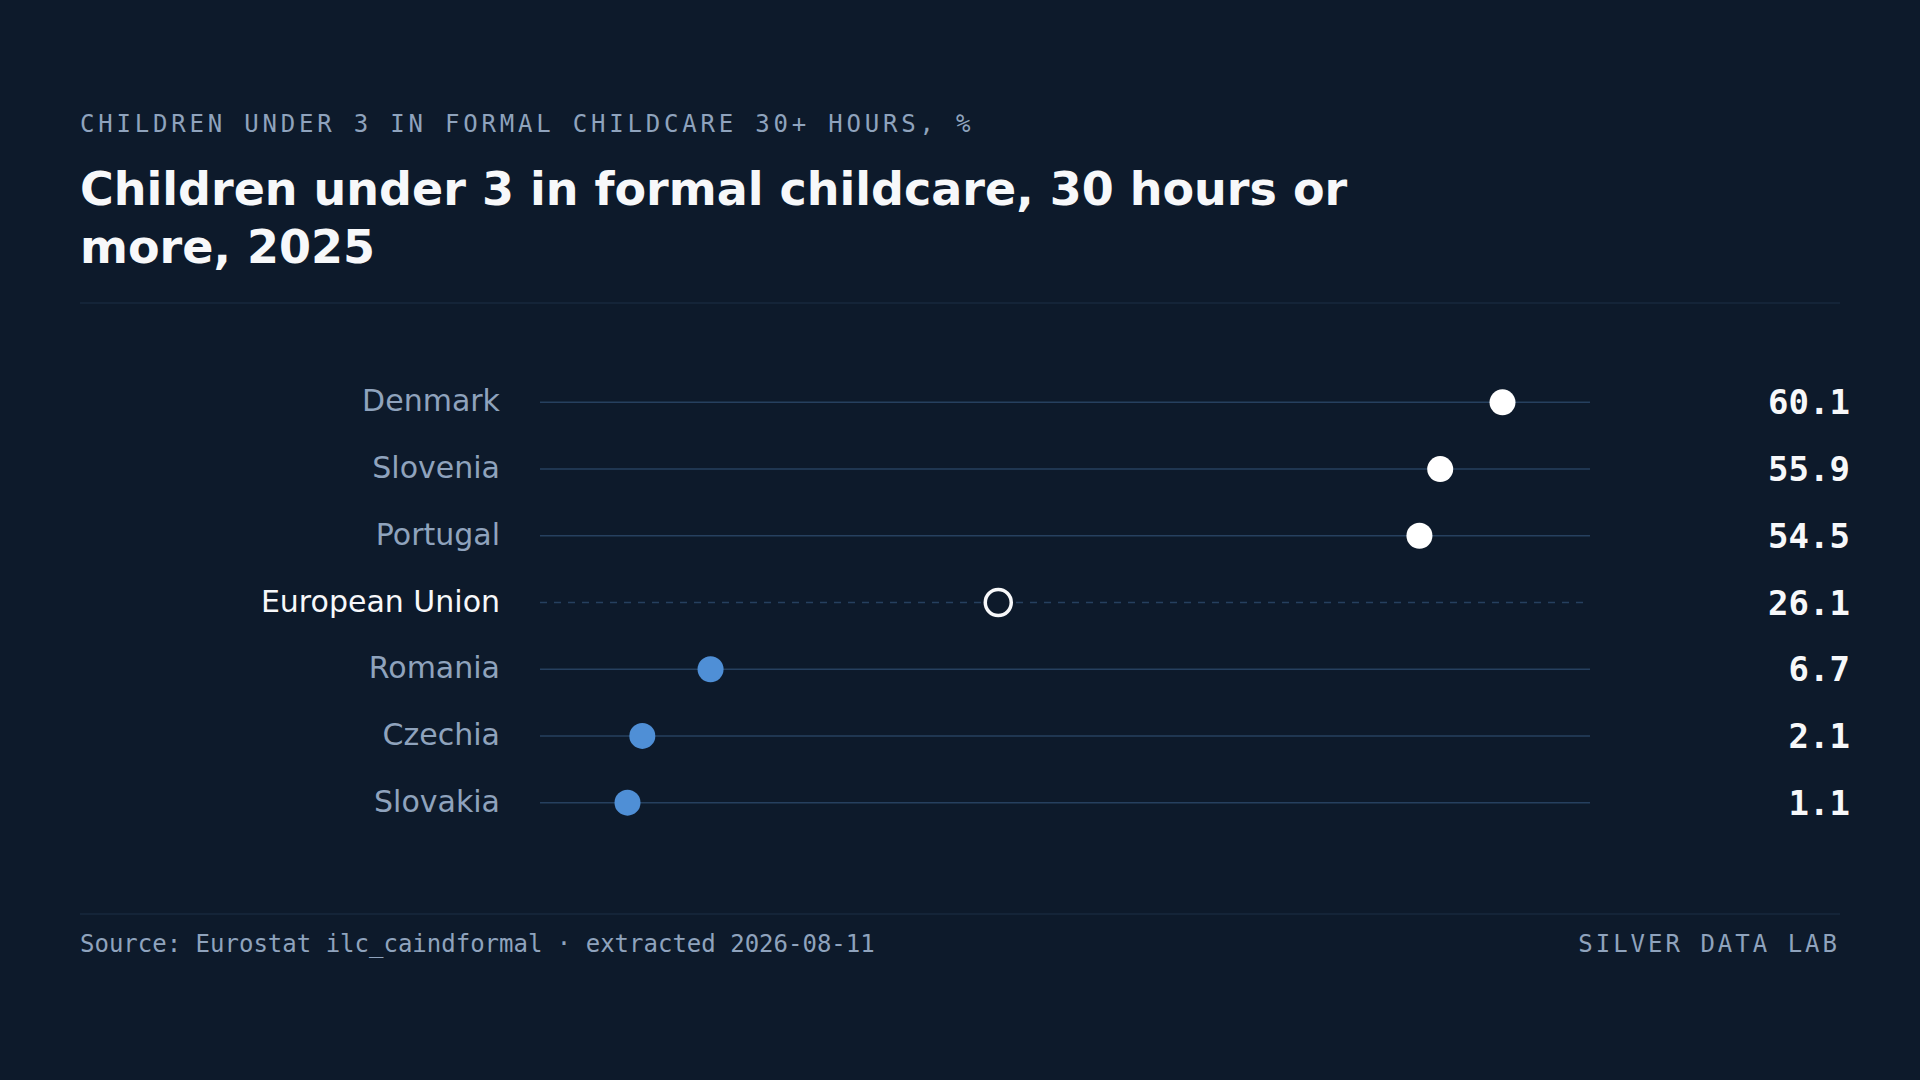
Most Danish Children Under Three Are in Full-Time Childcare
26.1% of EU children under three attended formal childcare for 30 hours a week or more in 2025.