Finland's Land Now Emits More Carbon Than It Absorbs
Silver Data Lab Research Desk · Statistical analysis · Published on 25 April 2026
This study is open to members only
Its sources, filters and extraction date are declared above, as they are for every study. Sign in to read the analysis in full.
- Data source
- Eurostat
- Reference period
- 2024
- Last updated
- 11 October 2026
Re-checked against the source on 22 September 2026. No value in its datasets has moved between the snapshots we hold. Every revision we have observed →
Key estimates
- EU land, forests and soils removed a net 0.5 tonnes of CO2 equivalent per inhabitant in 2024.
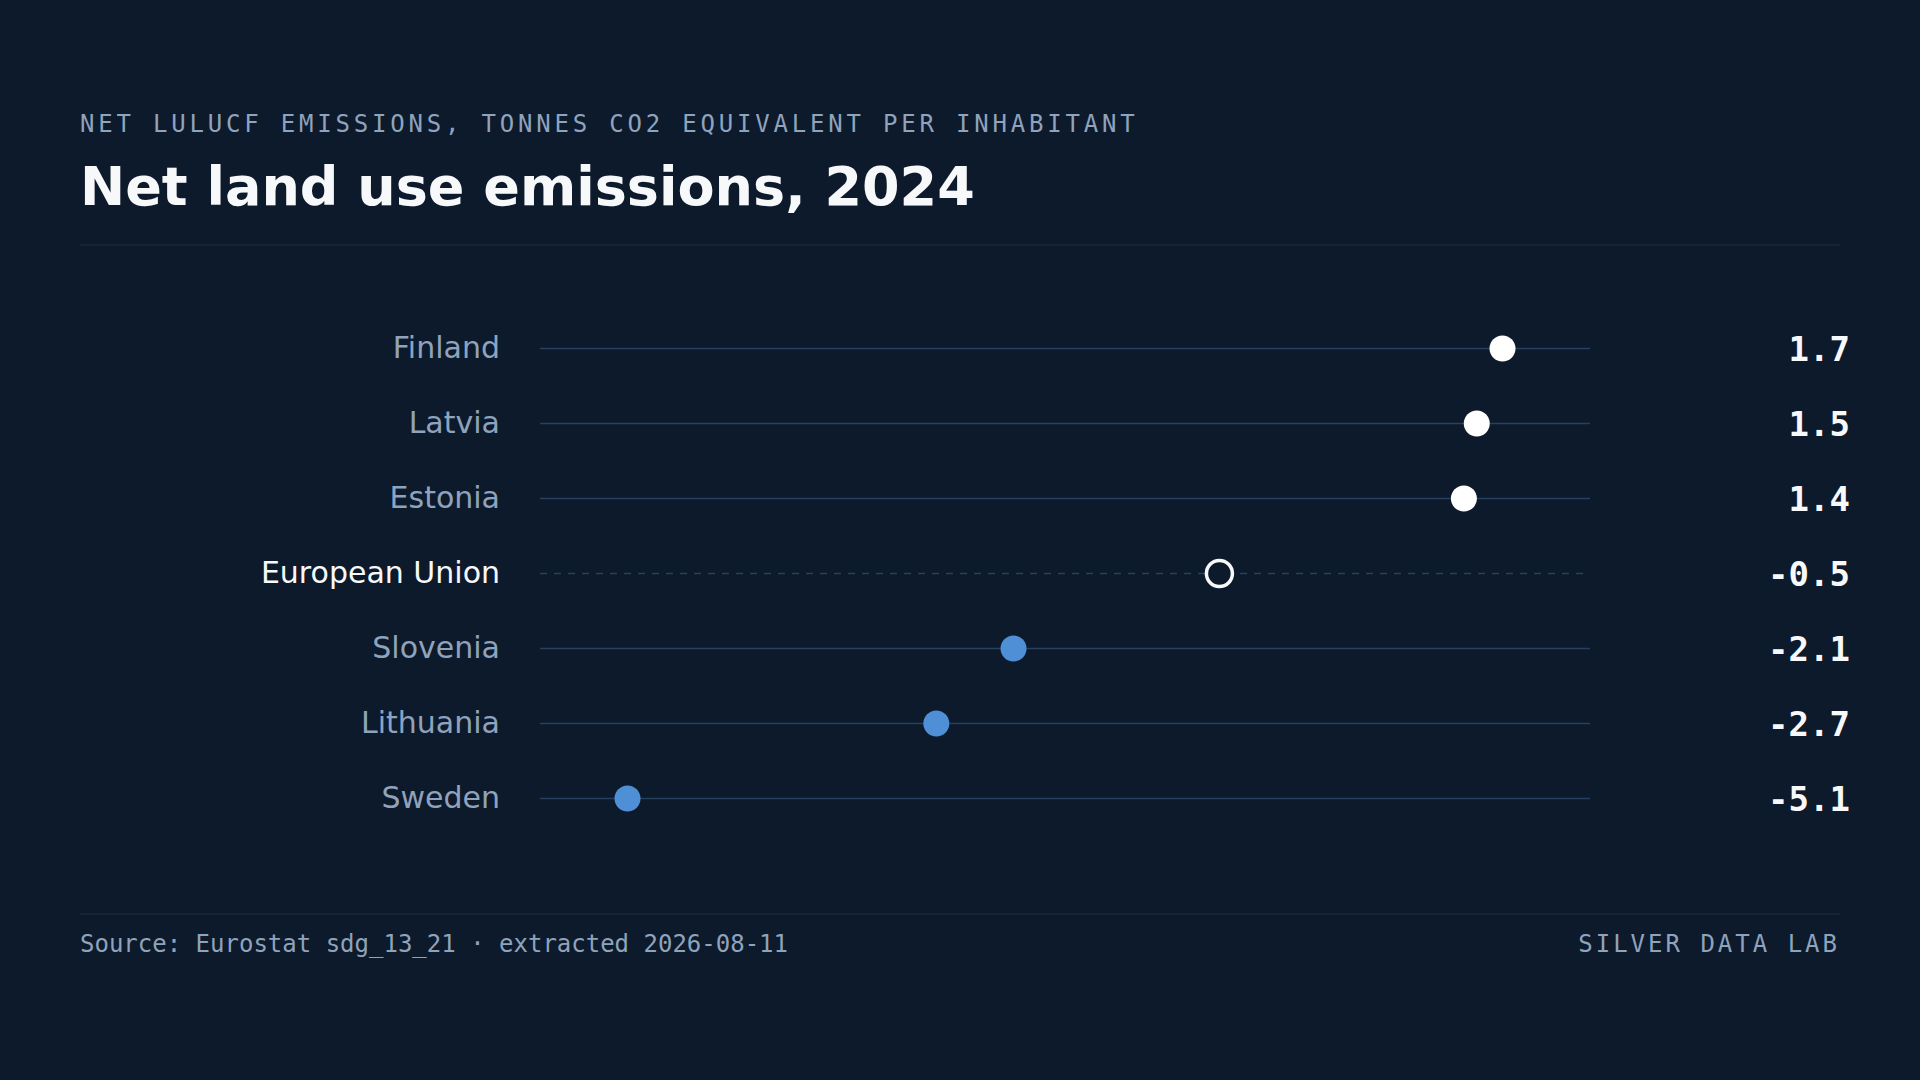
- Finland's land sector emitted a net 1.7 tonnes per inhabitant, the highest in the Union.
- Finnish forest land still absorbs carbon — 0.1 million tonnes in 2024 against 30.3 million in 2015, so 0.4% of the sink it was — while cropland emits 8.4 million of the sector's 9.8 million.
- Latvia at 1.5 and Estonia at 1.4 are in the same position; eight Member States are net emitters from land.
- Sweden removes 5.1 tonnes per inhabitant, the largest sink in the Union.
- Sweden and Finland are neighbours with similar forest cover on opposite sides of zero.
The part of the carbon account that can change sign
Every other emissions measure counts what an economy releases. This one counts what its land does — forests, cropland, grassland, wetlands and soils — and unlike the rest it can be negative, because growing vegetation removes carbon from the atmosphere.
In 2024 EU land removed a net 0.5 tonnes of CO2 equivalent per inhabitant. The Union's land is a carbon sink, and that sink is counted against its emissions in the net figures used for its climate targets.
Behind that half tonne, Member States sit on both sides of zero.
Finland
Finland records positive 1.7 tonnes per inhabitant. Its land sector emits more carbon than it absorbs.
For a country that is roughly three quarters forest, this is a striking result and a comparatively recent one. It is also not, mainly, a story about forests.
Broken into the land categories the same inventories report, Finnish forest land still removed carbon in 2024 — but only 0.1 million tonnes of CO2 equivalent, against 30.3 million in 2015. The forest sink is 0.4% of what it was nine years earlier, which is a collapse rather than a decline, and it is very nearly at zero.
What pushes the whole sector above zero is farmland. Finnish cropland emitted 8.4 million tonnes in 2024, most of the 9.8 million the sector emitted in total, with wetlands and settlements adding most of the rest and harvested wood products removing 2.1 million against them.
The two halves have different causes. The forest sink collapsed as harvesting rose and growth slowed in ageing stands; the cropland emissions come from drained organic soils, which release carbon continuously regardless of what is growing above them.
Latvia at 1.5 and Estonia at 1.4 are in the same position, and for broadly similar reasons. Germany at 0.7, Ireland at 0.5, Austria at 0.4, the Netherlands at 0.2 and Portugal at 0.1 complete the eight Member States above zero — for Ireland and the Netherlands, drained peat and intensively managed grassland rather than forestry.
Sweden
Sweden removes 5.1 tonnes per inhabitant, the largest sink in the Union by a wide margin. Lithuania follows at 2.7 and Slovenia at 2.1.
Sweden and Finland are the comparison that makes the point. They are neighbours with comparable forest cover and comparable forest industries, and they sit at opposite ends of this ranking — 5.1 tonnes of removal against 1.7 tonnes of emission, a difference of 6.8 tonnes per person.
The category breakdown puts that contrast in one figure. Swedish forest land alone removed 54.6 million tonnes of CO2 equivalent in 2024, more than the country's entire land sector nets, because Swedish cropland emits against it. Finnish forest land removed 0.1 million.
The difference is not climate. It is the balance between how fast the forest grows and how much is cut, together with the extent of drained organic soils. Those are management variables, and they can move within a decade in either direction.
Why this matters more than its size suggests
Half a tonne per person sounds small beside total EU emissions of several tonnes per person. Its importance is that it is the only term in the account that can be increased directly rather than by reducing something else, and the Union's climate framework relies on it growing.
A sink that is shrinking, or flipping sign in the Member States with the most forest, removes that assumption. Finland's position is therefore a problem for the Union's arithmetic and not only for Finland's.
Reading the sign
The convention here is that positive means net emission and negative means net removal, which is the opposite of how a sink is usually described in words. A country doing well on this indicator has a large negative number.
Net land use emissions, 2024
| Country | tonnes CO2 equivalent per inhabitant | Gap to EU averagederived |
|---|---|---|
| Finland | 1.7 | +2.2 |
| Latvia | 1.5 | +2.0 |
| Estonia | 1.4 | +1.9 |
| European Unionaggregate | -0.5 | — |
| Slovenia | -2.1 | −1.6 |
| Lithuania | -2.7 | −2.2 |
| Sweden | -5.1 | −4.6 |
This table as data: CSV · JSON
Every Member State for this indicator+
Members see every Member State for this indicator here, not only the rows the ranking prints. Become a Member
What these figures cannot tell you
- Land sector accounting is the most uncertain part of the inventory
- Estimating carbon flows through soils and biomass requires modelling rather than measurement, and revisions to method can move a country's figure substantially. National inventories are also resubmitted each year, so a figure for a given year is a vintage rather than a final answer, and national statistical offices publish their own estimates for the same year on their own timetable. These values are less precise than fossil fuel emissions estimates.
- Per inhabitant is an unusual denominator for land
- Land carbon depends on area, forest type and soil, not on population. Dividing by inhabitants makes sparsely populated forested countries look extreme in both directions and is used here for comparability with the other emissions measures on this site.
- A single year in a slow system
- Forest carbon responds to harvesting cycles, storm damage, fire and pest outbreaks, any of which can move a single year. A country's position can shift without a change in policy or long-run trajectory.
- Peatland emissions dominate several positions
- In Finland, Ireland and the Netherlands, drained organic soils release carbon continuously and independently of forest growth. Countries with large drained peat areas can be net emitters despite substantial forest cover — Finland is the demonstration, with cropland emitting 8.4 million tonnes while its forest land is still, barely, a sink.
Frequently asked questions
- Is EU land absorbing or emitting carbon?
- Absorbing, on balance. EU land, forests and soils removed a net 0.5 tonnes of CO2 equivalent per inhabitant in 2024. Eight individual Member States were net emitters.
- Why has Finland's land stopped absorbing carbon?
- Not because its forests emit. Finnish forest land still removed carbon in 2024, but only 0.1 million tonnes against 30.3 million in 2015, so the sink is 0.4% of what it was. What turns the sector positive is cropland, at 8.4 million tonnes of the 9.8 million the sector emitted, from drained organic soils that release carbon regardless of what grows above them.
- Which EU country has the largest carbon sink?
- Sweden, removing 5.1 tonnes of CO2 equivalent per inhabitant in 2024 — far ahead of Lithuania at 2.7 and Slovenia at 2.1. Sweden and Finland have comparable forest cover and sit at opposite ends of this ranking.
- Why does a negative number mean a country is doing well here?
- Because the source reports net emissions: positive means the land releases more carbon than it captures, negative means it captures more than it releases. A large negative value is a large carbon sink.
Methodological note
Eurostat publishes net greenhouse gas emissions and removals from land use, land use change and forestry as reported in national inventories under the UNFCCC framework. This study uses the measure expressed in tonnes of CO2 equivalent per inhabitant.
The sign convention is that of the source: positive values are net emissions to the atmosphere and negative values are net removals from it.
Values are for 2024 and cover all 27 Member States. The count of Member States above zero, and the comparison between Sweden and Finland, are derived by Silver Data Lab from the published values.
The sector total cannot say whether a country's position comes from its forests or its fields, so the same inventories are extracted a second time broken into the land categories they report — forest land, cropland, grassland, wetlands, settlements, other land and harvested wood products — for Finland and Sweden, the two countries this study compares. That extraction is declared below and is the source of every figure here given in million tonnes. It is the same territorial inventory at the same reference year, and the two agree: the 9.8 million tonnes it reports for the Finnish sector is the 1.7 tonnes per inhabitant of the headline series.
Source data
This study draws on 2 datasets from Eurostat. Each can be inspected and re-downloaded from its catalogue, and the filters below are the ones applied.
Net greenhouse gas emissions of the land use, land use change and forestry sector
sdg_13_21
- Filters applied:
- freq=A · unit=T_HAB · time=2024
- Extracted:
- 2026-08-11
- Source last updated:
- 2026-04-22
Greenhouse gas emissions by source sector — land use categories
env_air_gge
- Filters applied:
- freq=A · airpol=GHG · unit=THS_T · src_crf=CRF4, CRF4A, CRF4B, CRF4C, CRF4D, CRF4E, CRF4F, CRF4G, CRF4H · geo=FI, SE
- Extracted:
- 2026-09-22
- Source last updated:
- 2026-06-02
Download the data
The data the study you have just read is built on, exactly as it was downloaded and archived.
Yours as a Member.
Data downloadable by Members
How to cite
Record the vintage as well as the study: the figures on this page are the ones extracted on the dates below.
Silver Data Lab Research Desk (2026). Finland's Land Now Emits More Carbon Than It Absorbs. Silver Data Lab, published 25 April 2026, last updated 11 October 2026. https://www.silverdatalab.com/studies/land-carbon-sink-in-the-eu
- Data: Eurostat, Net greenhouse gas emissions of the land use, land use change and forestry sector (sdg_13_21), filters freq=A, unit=T_HAB, time=2024; extracted 2026-08-11; source last updated 2026-04-22. https://doi.org/10.2908/sdg_13_21
- Data: Eurostat, Greenhouse gas emissions by source sector — land use categories (env_air_gge), filters freq=A, airpol=GHG, unit=THS_T, src_crf=CRF4, CRF4A, CRF4B, CRF4C, CRF4D, CRF4E, CRF4F, CRF4G, CRF4H, geo=FI, SE; extracted 2026-09-22; source last updated 2026-06-02. https://doi.org/10.2908/env_air_gge
Silver Data Lab's analysis is licensed CC BY 4.0. The statistics remain their publisher's and keep its terms of reuse.
Ask the research desk
A question about this study — a definition, a filter, a break in the series, what the figures can and cannot support — answered by the desk that made the extraction.
Members can write to the research desk
Studies where the same country leads or trails
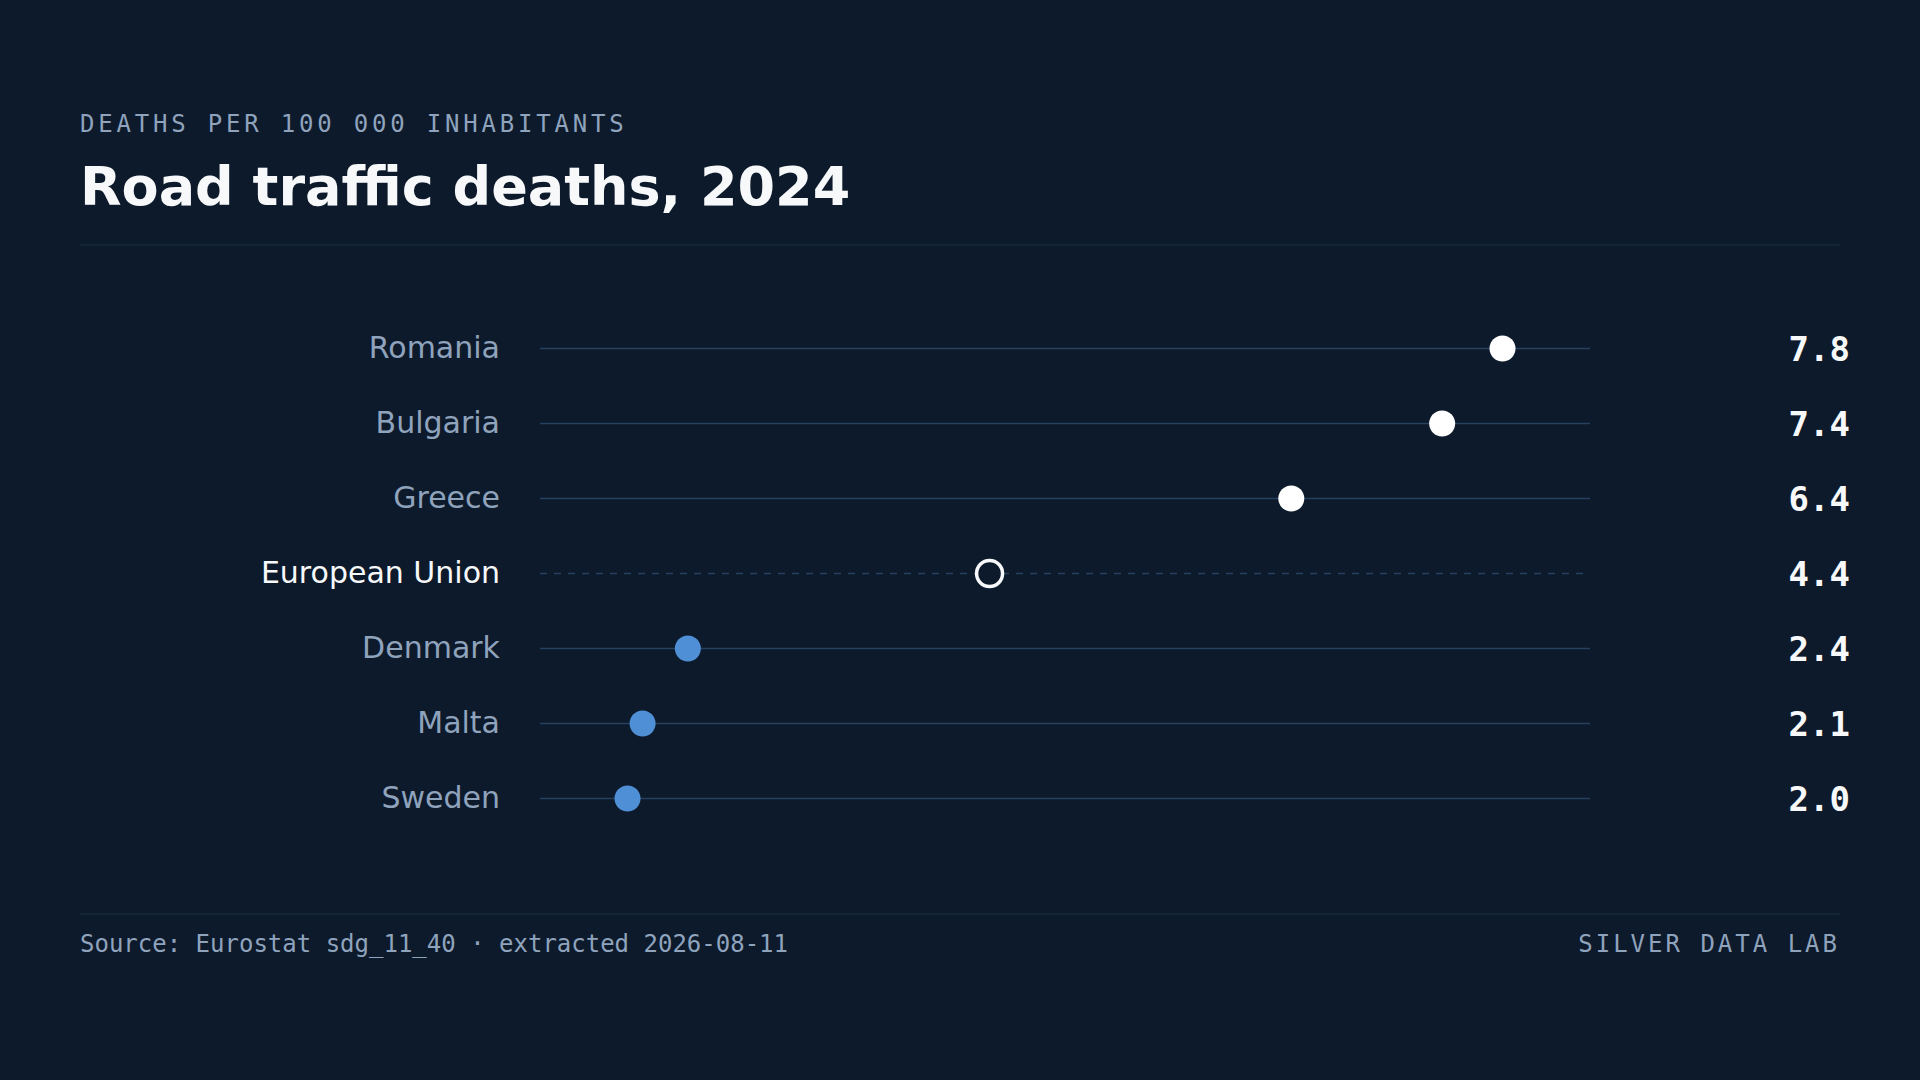
In Romania the Risk of Dying on the Road Is Nearly Four Times Sweden's
19,933 people were killed on the roads of the European Union in 2024: 4.4 deaths per 100,000 inhabitants.
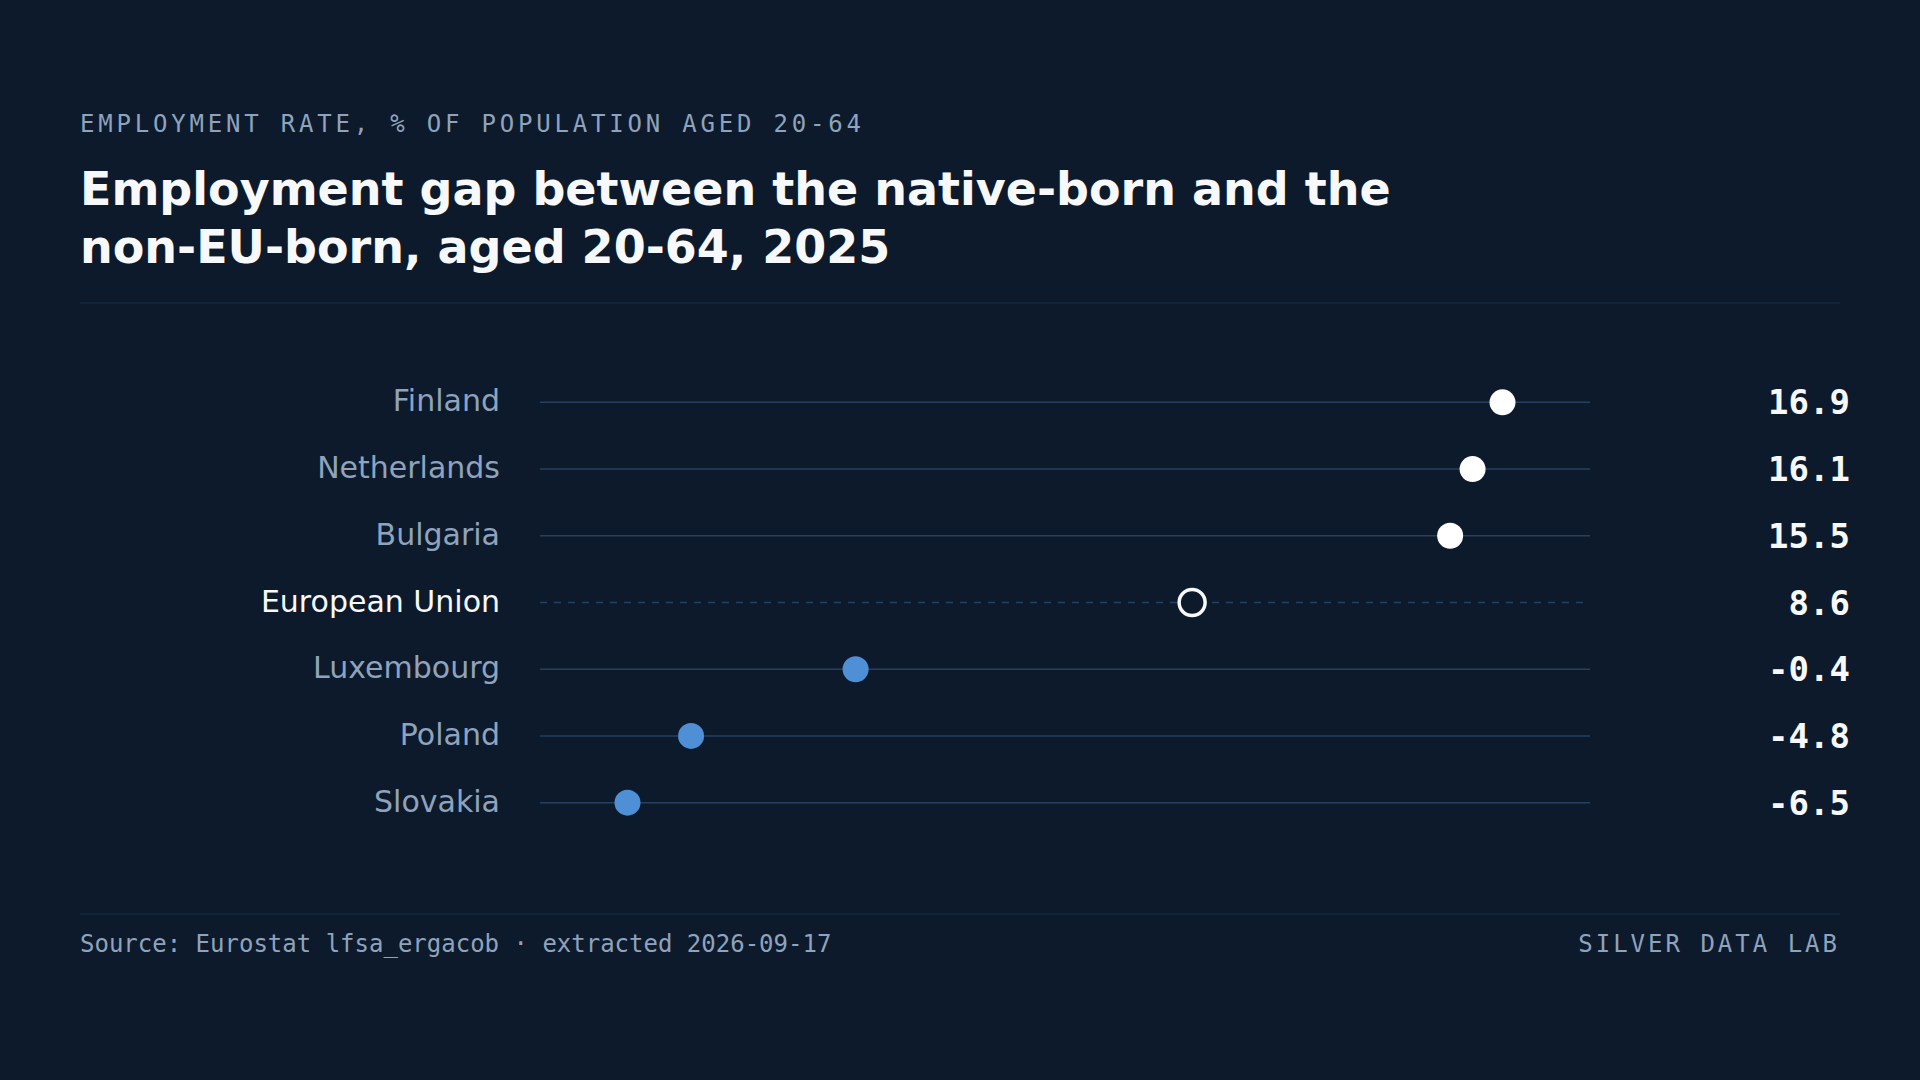
Non-EU Immigrants Are Less Likely to Be in Work Than the Native-Born
68.6% of people aged 20 to 64 born outside the EU were in employment in 2025, against 77.2% of those born in the country where they live: a gap of 8.6 points, derived from the two published rates.
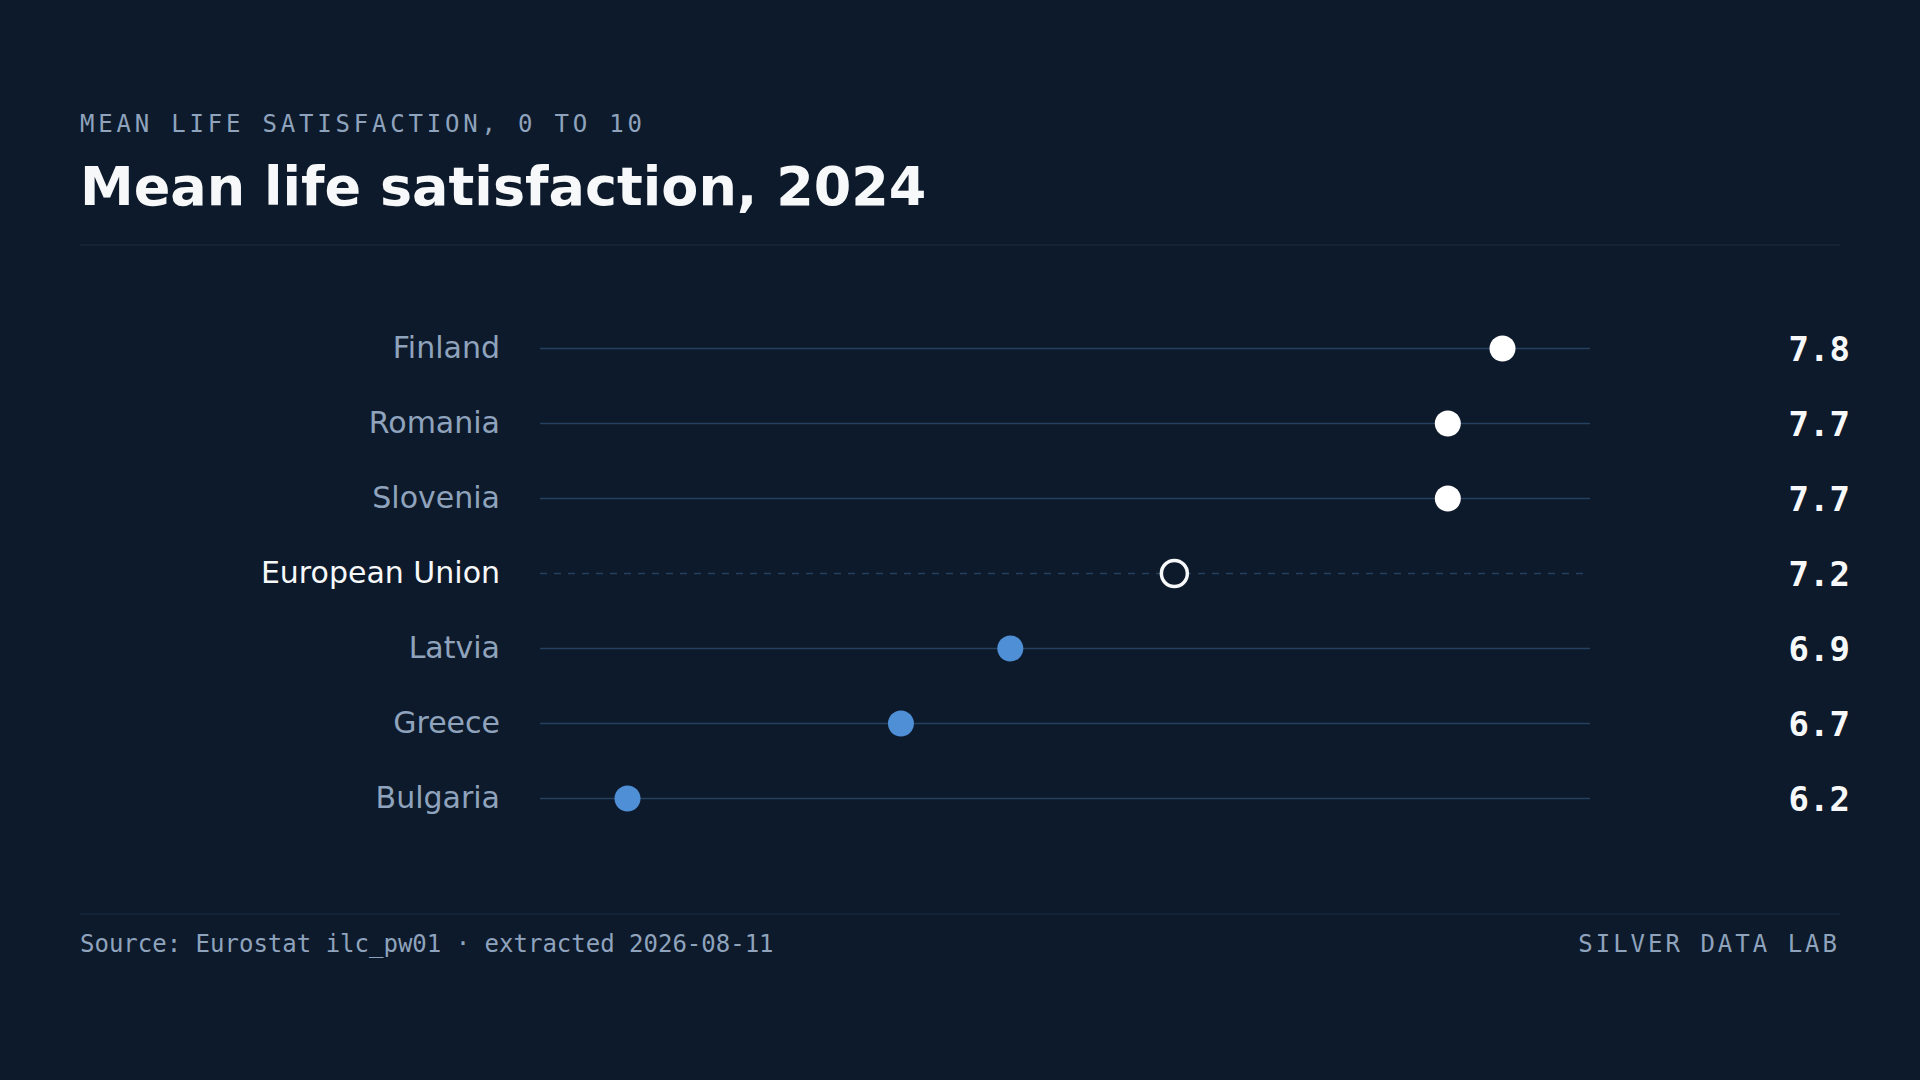
Romanians Rate Their Lives Higher Than Germans Do
Europeans aged 16 and over rated their overall life satisfaction at 7.2 out of 10 in 2024.