In Romania the Risk of Dying on the Road Is Nearly Four Times Sweden's
Silver Data Lab Research Desk · Statistical analysis · Published on 24 July 2026
- Data source
- Eurostat
- Reference period
- 2024
- Last updated
- 11 October 2026
Re-checked against the source on 01 October 2026. No value in its datasets has moved between the snapshots we hold. Every revision we have observed →
Key estimates
- 19,933 people were killed on the roads of the European Union in 2024: 4.4 deaths per 100,000 inhabitants.
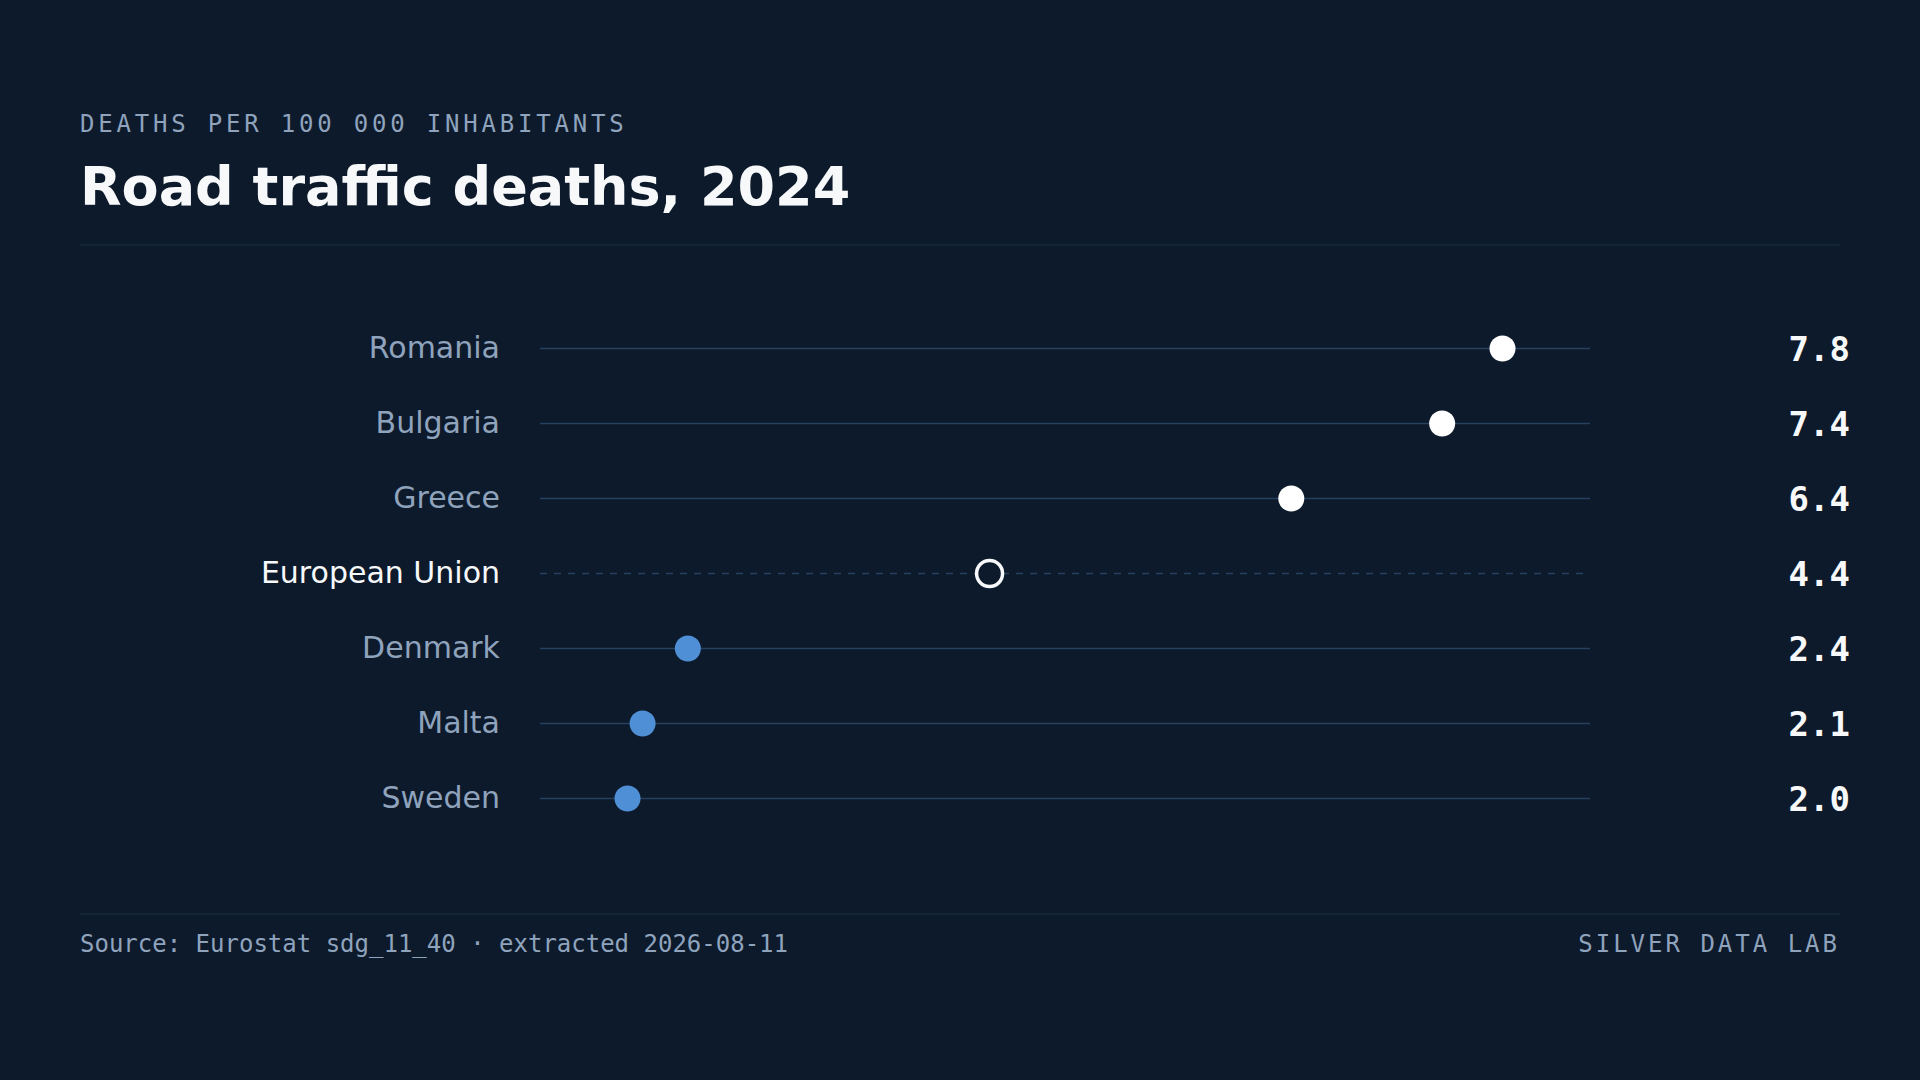
- Romania records 7.8 per 100,000, Bulgaria 7.4 and Greece 6.4.
- Sweden records 2.0, Malta 2.1 and Denmark 2.4.
- A resident of Romania is 3.9 times as likely to die in a road crash as a resident of Sweden.
- Thirteen Member States record rates above the EU figure and fourteen below it.
A number that is comparable in a way most are not
Road deaths are counted rather than surveyed. A fatality is recorded by police and health authorities against a common definition — death within thirty days of a collision — and the count does not depend on a sample, a self-assessment or a national income threshold.
That makes this one of the most directly comparable indicators in European statistics, and the size of the variation it reveals harder to explain away.
In 2024, 19,933 people were killed on EU roads, a rate of 4.4 per 100,000 inhabitants.
The range
Romania records 7.8 deaths per 100,000, the highest in the Union, followed by Bulgaria at 7.4, Greece at 6.4, Croatia at 6.2 and Latvia at 6.0.
At the other end Sweden records 2.0, Malta 2.1, Denmark 2.4 and Luxembourg 2.7.
The ratio between the highest and lowest national rate is 3.9. A person living in Romania is close to four times as likely to be killed on the road as a person living in Sweden, in a Union with common vehicle safety standards and largely common licensing rules.
What the gap is not explained by
Vehicle safety regulation is set at EU level, so cars sold across the Union meet the same crash standards. Driver licensing follows a common framework. Neither can account for a factor of four.
Road infrastructure, enforcement intensity, the age of the vehicle fleet, emergency medical response times and the share of travel on rural roads all differ substantially between Member States, and each has been proposed as an explanation. This extraction contains the outcome and none of the candidate causes, so this study reports the gap and does not attribute it.
Where the Union sits against itself
Thirteen Member States are above the EU rate and fourteen below it. The distribution is not symmetrical: the countries above the average are further from it than those below, so the EU figure of 4.4 sits closer to the safer group than to the middle of the range.
The five worst-performing Member States are all in eastern or southern Europe, and the five best are all in northern or western Europe with the exception of Malta. That pattern is stable enough to be a structural feature rather than a single year's noise, though establishing that would require the time series this study does not use.
Road traffic deaths, 2024
| Country | Deaths per 100,000 inhabitants | Gap to EU averagederived |
|---|---|---|
| Romania | 7.8e | +3.4 |
| Bulgaria | 7.4 | +3.0 |
| Greece | 6.4 | +2.0 |
| European Unionaggregate | 4.4ep | — |
| Denmark | 2.4 | −2.0 |
| Malta | 2.1 | −2.3 |
| Sweden | 2.0 | −2.4 |
Flags carried by the source on these values: e estimated · ep estimated, provisional
This table as data: CSV · JSON
Every Member State for this indicator+
Members see every Member State for this indicator here, not only the rows the ranking prints. Become a Member
Embed this chart
Paste this code into a page. The frame carries the source and the extraction date, and links back to the study.
What these figures cannot tell you
- Deaths per inhabitant, not per kilometre driven
- The rate is population-based. A country whose residents drive more will record more deaths for the same road safety performance, and exposure-adjusted rates — deaths per vehicle-kilometre — would rank Member States differently.
- Causes are not in this extraction
- Infrastructure, enforcement, fleet age and emergency response have all been proposed as explanations for the gap. None of them is in this dataset, so this study measures the outcome and attributes it to nothing.
- The thirty-day definition is common but applied nationally
- A death is counted when it occurs within thirty days of the collision. The definition is harmonised, while the administrative systems recording it are national and differ in completeness.
- Three of these values carry a Eurostat flag
- Eurostat publishes the Romanian rate as an estimate, the French rate as provisional, and the EU rate as both estimated and provisional. Nothing in the ranking turns on it — Romania is the highest either way — but the figure this study is named after and the figure it is measured against are both qualified at source, and the qualification belongs with them.
- Single year
- 2024 alone. Road deaths fell sharply across the Union over the previous two decades and the pace of that decline differs between Member States, so a single year describes the current position rather than the trajectory.
Frequently asked questions
- How many people die on EU roads?
- 19,933 people were killed in road traffic in the European Union in 2024, a rate of 4.4 deaths per 100,000 inhabitants.
- Which EU country has the most dangerous roads?
- Measured per inhabitant, Romania, at 7.8 deaths per 100,000 in 2024, followed by Bulgaria at 7.4 and Greece at 6.4.
- Which EU country has the safest roads?
- Sweden, at 2.0 deaths per 100,000 inhabitants in 2024, followed by Malta at 2.1 and Denmark at 2.4. A resident of Romania is 3.9 times as likely to die on the road as a resident of Sweden.
- Why do road death rates differ so much within the EU?
- This study does not say. Vehicle safety standards and licensing rules are largely common across the Union, so they cannot explain a factor of four. Infrastructure, enforcement, fleet age and emergency response have all been proposed, and none of them appears in this dataset.
Methodological note
Road traffic deaths are published by Eurostat as both a count and a rate per 100,000 inhabitants, covering all road types. This study uses the total across road types.
The denominator was verified rather than assumed: Eurostat publishes 19,933 deaths and a rate of 4.4 for the EU in 2024, which is consistent with a per 100,000 inhabitants basis and not with a per million one.
Values are for 2024, the most recent year with complete coverage of the 27 Member States at the extraction date. Eurostat's own observation flags are read from the same extraction rather than only its values: the Romanian rate is marked as an estimate, the French rate as provisional and the EU rate as both.
The ratio between the highest and lowest national rate, and the counts above and below the EU figure, are derived by Silver Data Lab.
Source data
The underlying series can be inspected and re-downloaded from the Eurostat data browser. The filters below are the ones applied.
Road traffic deaths, by type of roads
sdg_11_40
- Filters applied:
- freq=A · tra_infr=TOTAL · unit=RT, NR · time=2024
- Extracted:
- 2026-10-01
- Source last updated:
- 2026-09-30
Download the data
The data the study you have just read is built on, exactly as it was downloaded and archived.
Yours as a Member.
Data downloadable by Members
How to cite
Record the vintage as well as the study: the figures on this page are the ones extracted on the dates below.
Silver Data Lab Research Desk (2026). In Romania the Risk of Dying on the Road Is Nearly Four Times Sweden's. Silver Data Lab, published 24 July 2026, last updated 11 October 2026. https://www.silverdatalab.com/studies/road-deaths-in-the-eu
- Data: Eurostat, Road traffic deaths, by type of roads (sdg_11_40), filters freq=A, tra_infr=TOTAL, unit=RT, NR, time=2024; extracted 2026-10-01; source last updated 2026-09-30. https://doi.org/10.2908/sdg_11_40
Silver Data Lab's analysis is licensed CC BY 4.0. The statistics remain their publisher's and keep its terms of reuse.
Ask the research desk
A question about this study — a definition, a filter, a break in the series, what the figures can and cannot support — answered by the desk that made the extraction.
Members can write to the research desk
Studies where the same country leads or trails
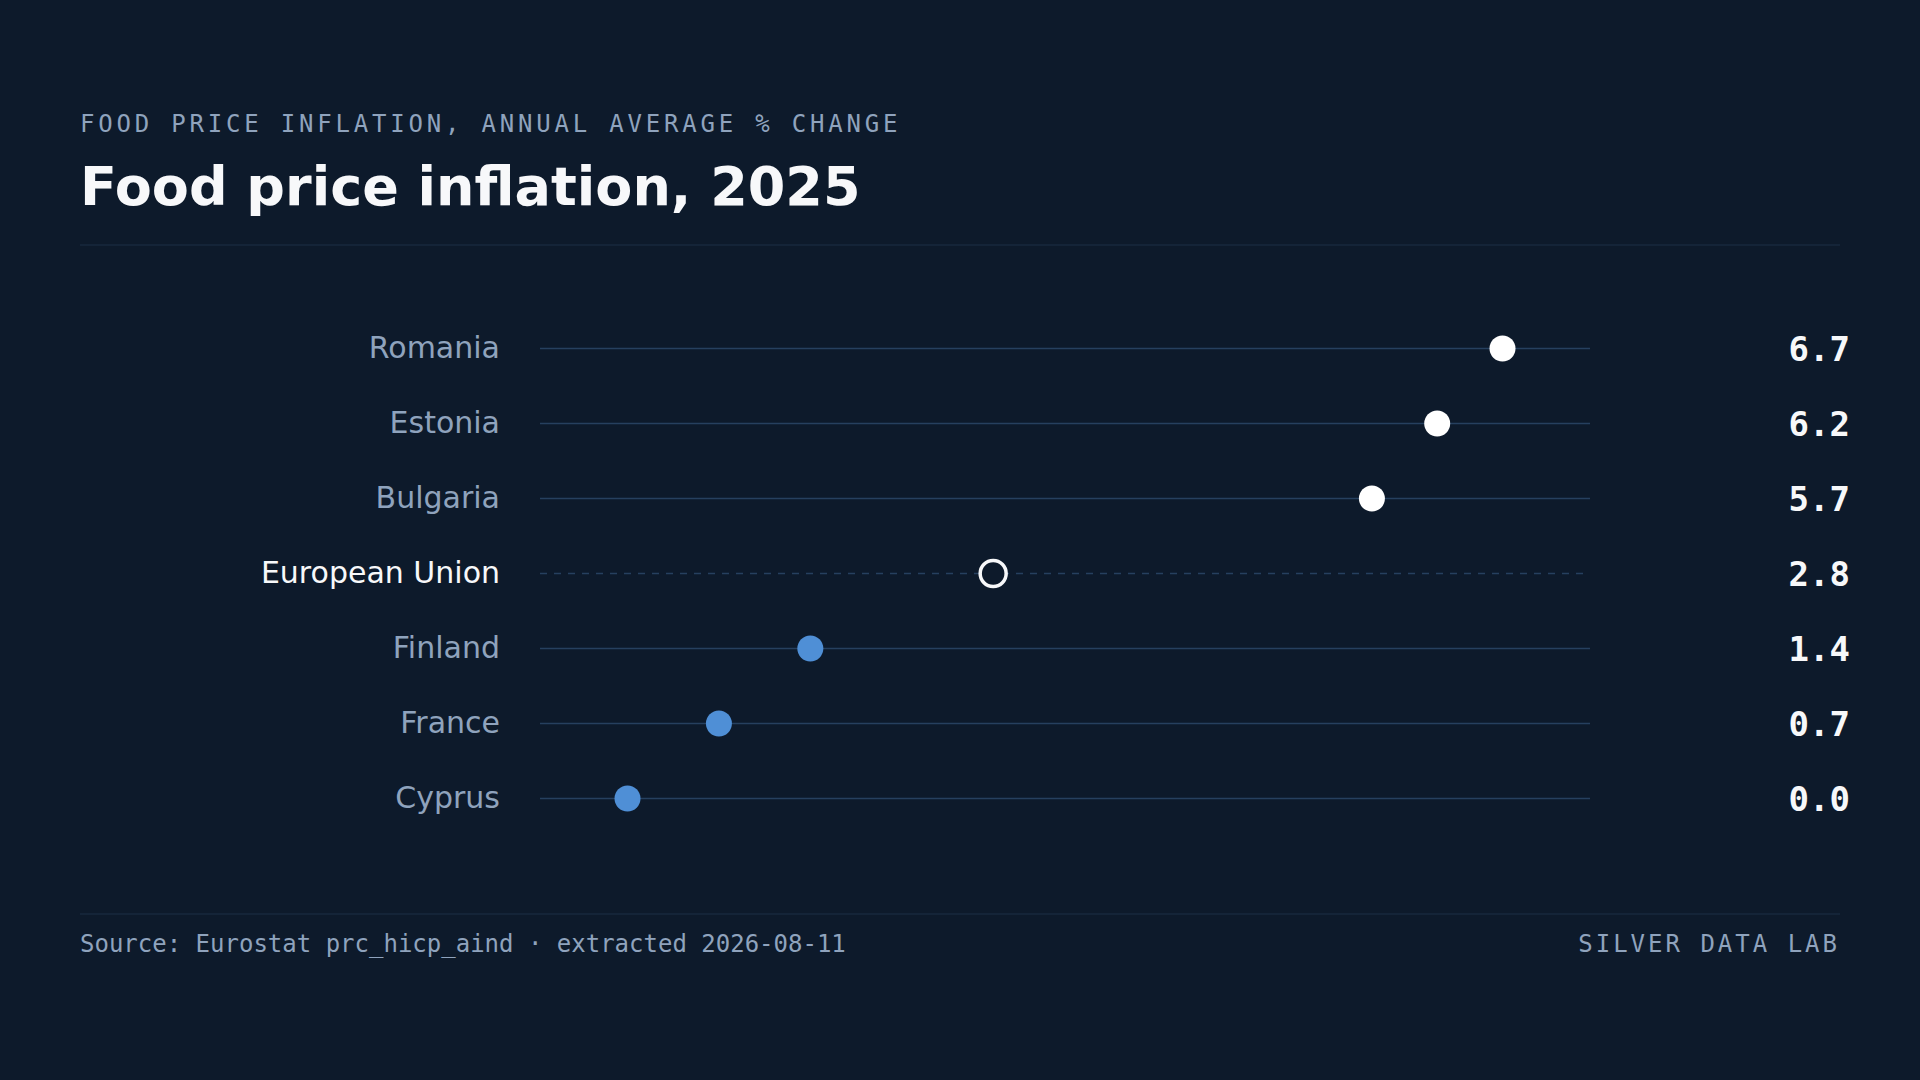
Food Prices Rose 6.7% in Romania and Not at All in Cyprus
Food prices in the EU rose 2.8% on average in 2025.
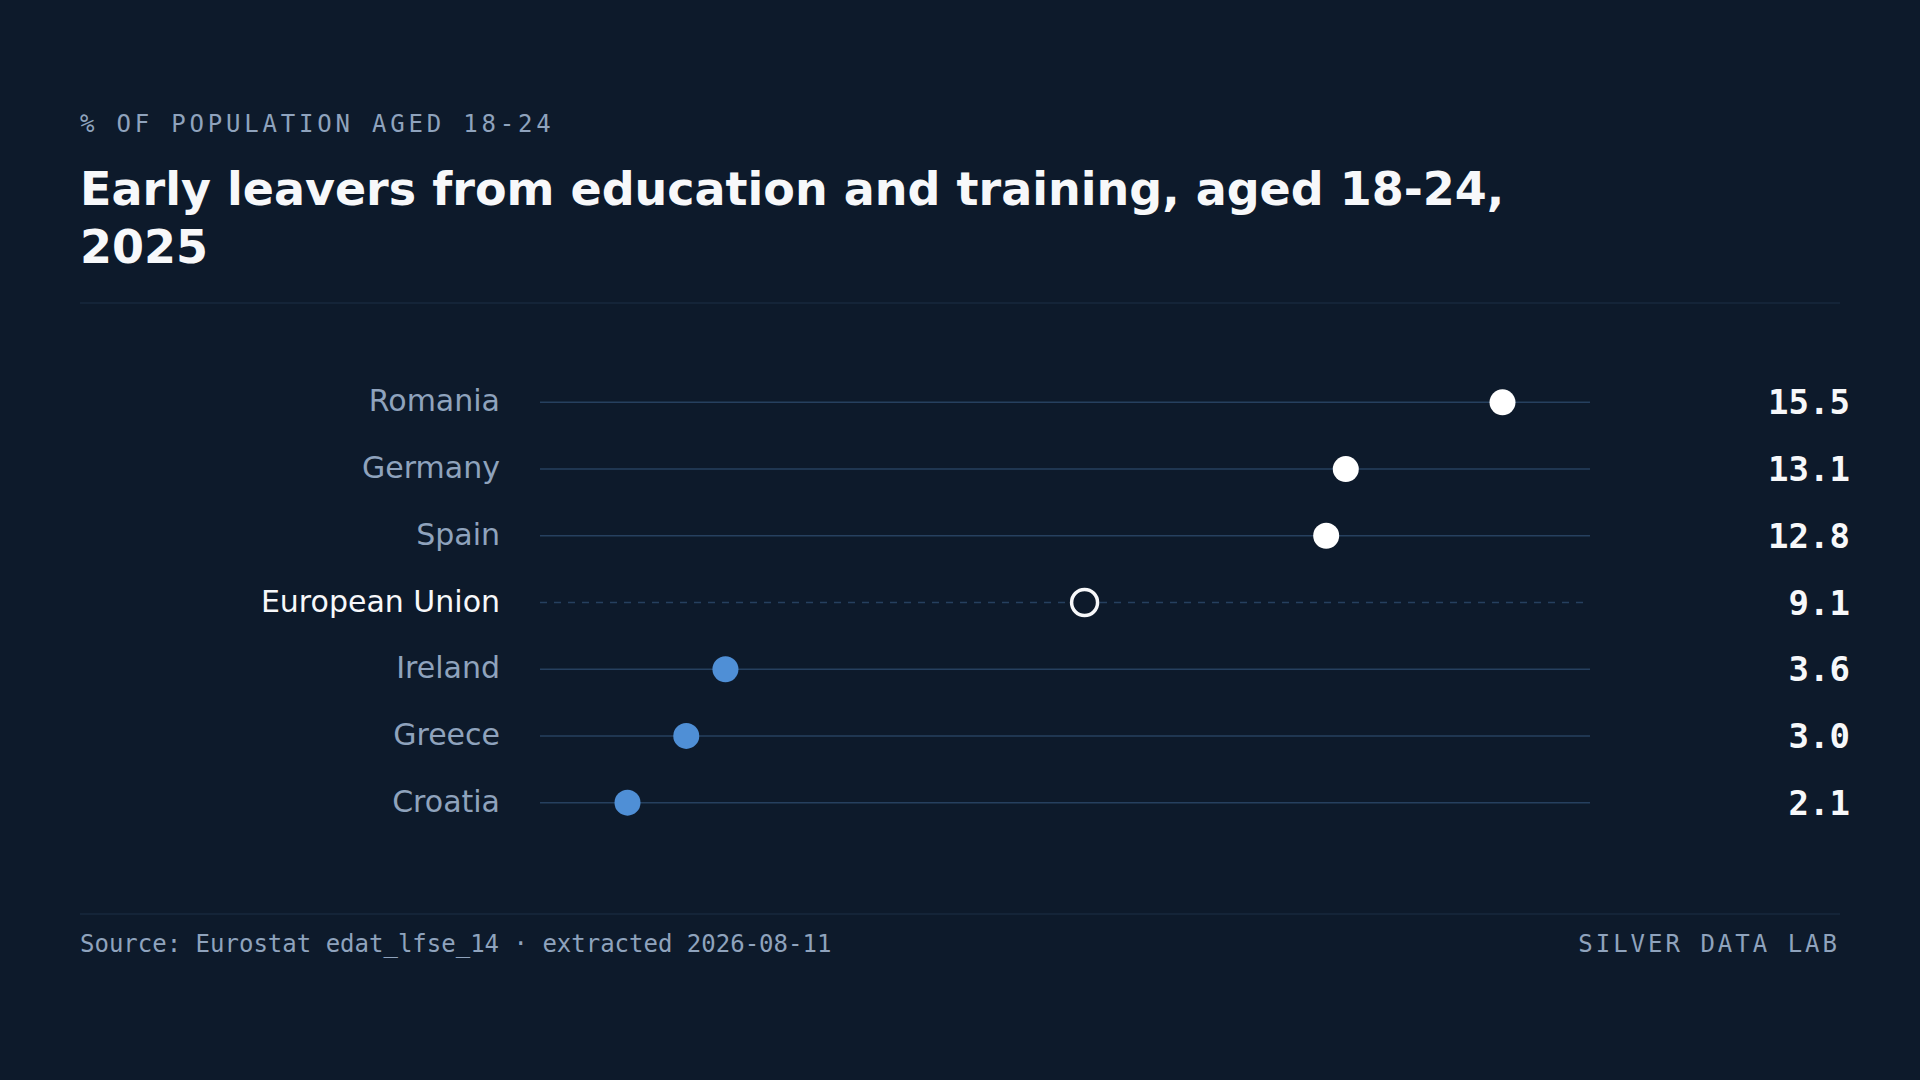
Germany Has the EU's Second-Worst School Dropout Rate
9.1% of people aged 18 to 24 in the EU had left education with at most lower secondary schooling in 2025.
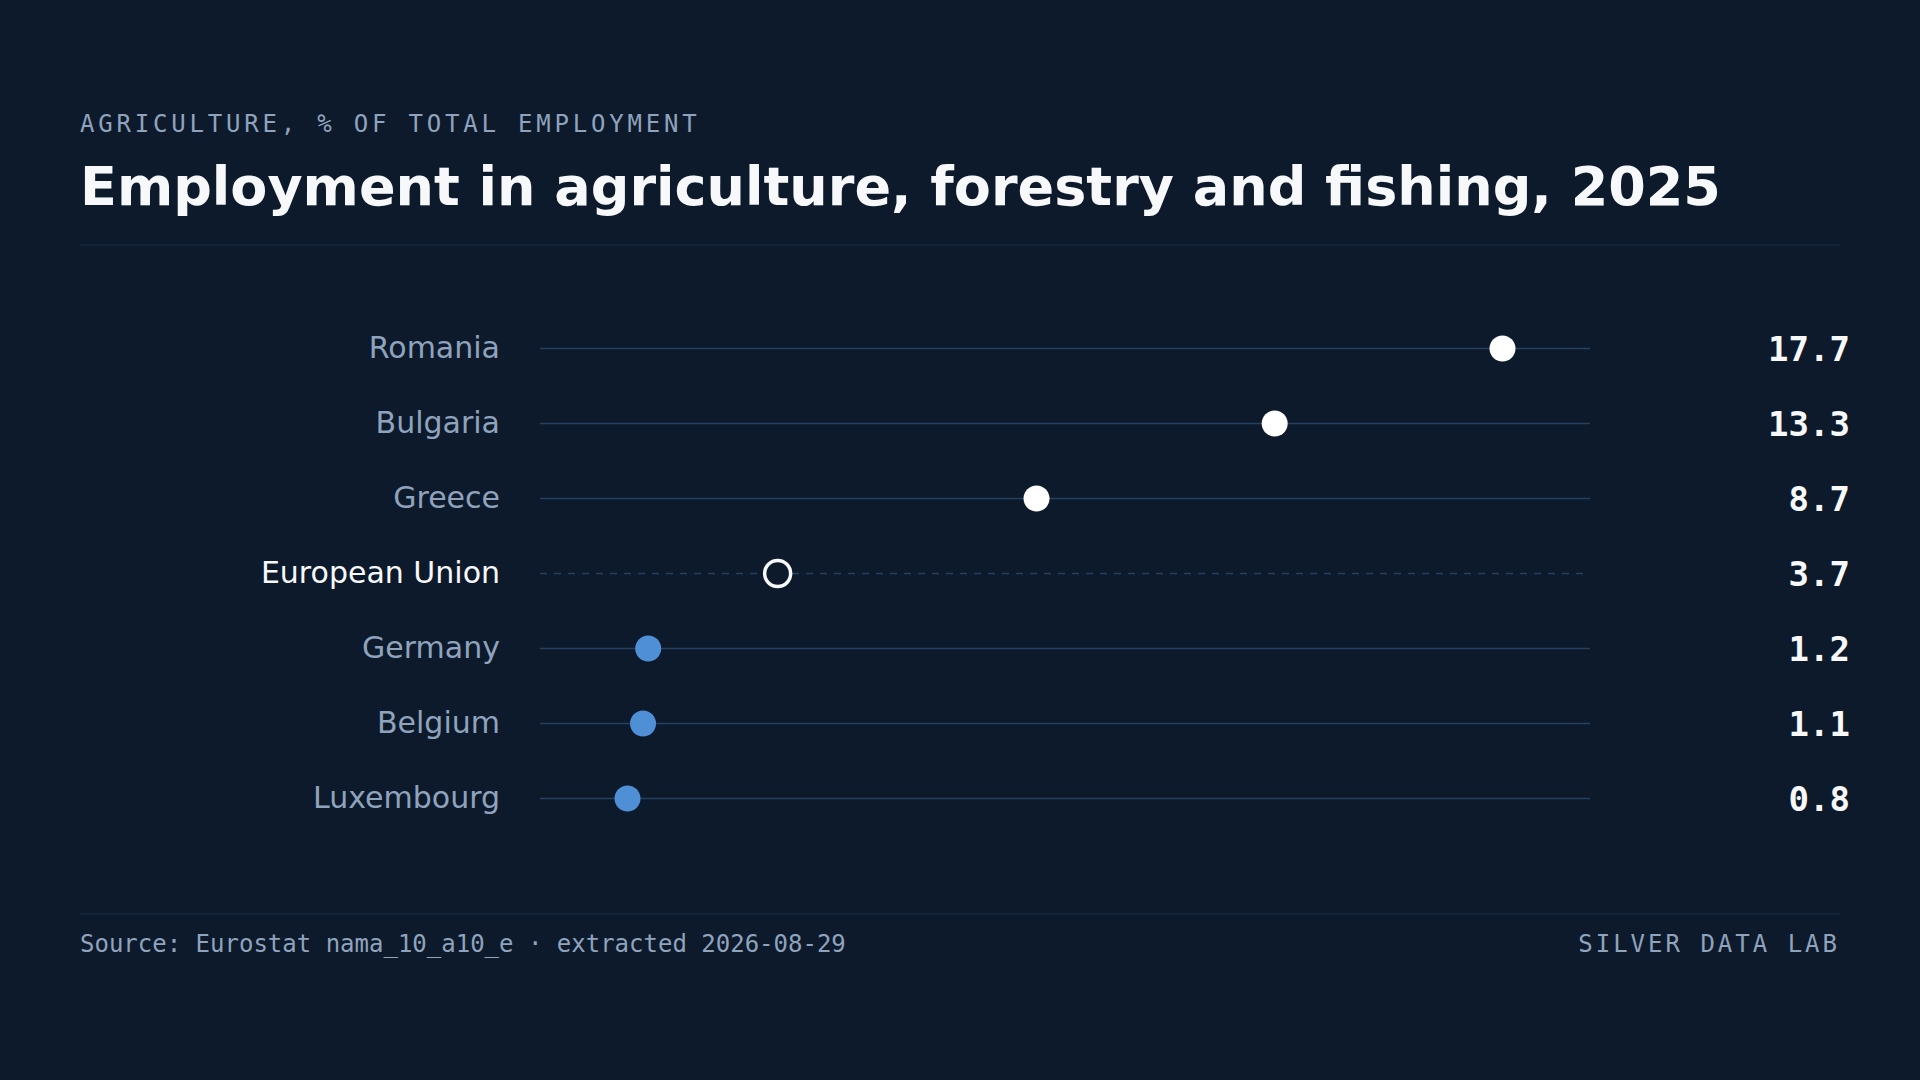
More Than One Romanian Worker in Six Works in Agriculture
Agriculture, forestry and fishing employed 3.8% of workers in the EU in 2025 and produced 1.8% of its gross value added.