Employment of Non-EU-Born Adults Trails the Native-Born by 8.6 Points in the EU and by 16.9 in Finland
Silver Data Lab Research Desk · Statistical analysis · Published on 17 September 2026
- Data source
- Eurostat
- Reference period
- 2025
- Last updated
- 17 September 2026
Re-checked against the source on 17 September 2026. No value in its datasets has moved between the snapshots we hold. Every revision we have observed →
Key estimates
- 68.6% of people aged 20 to 64 born outside the EU were in employment in 2025, against 77.2% of those born in the country where they live: a gap of 8.6 points, derived from the two published rates.
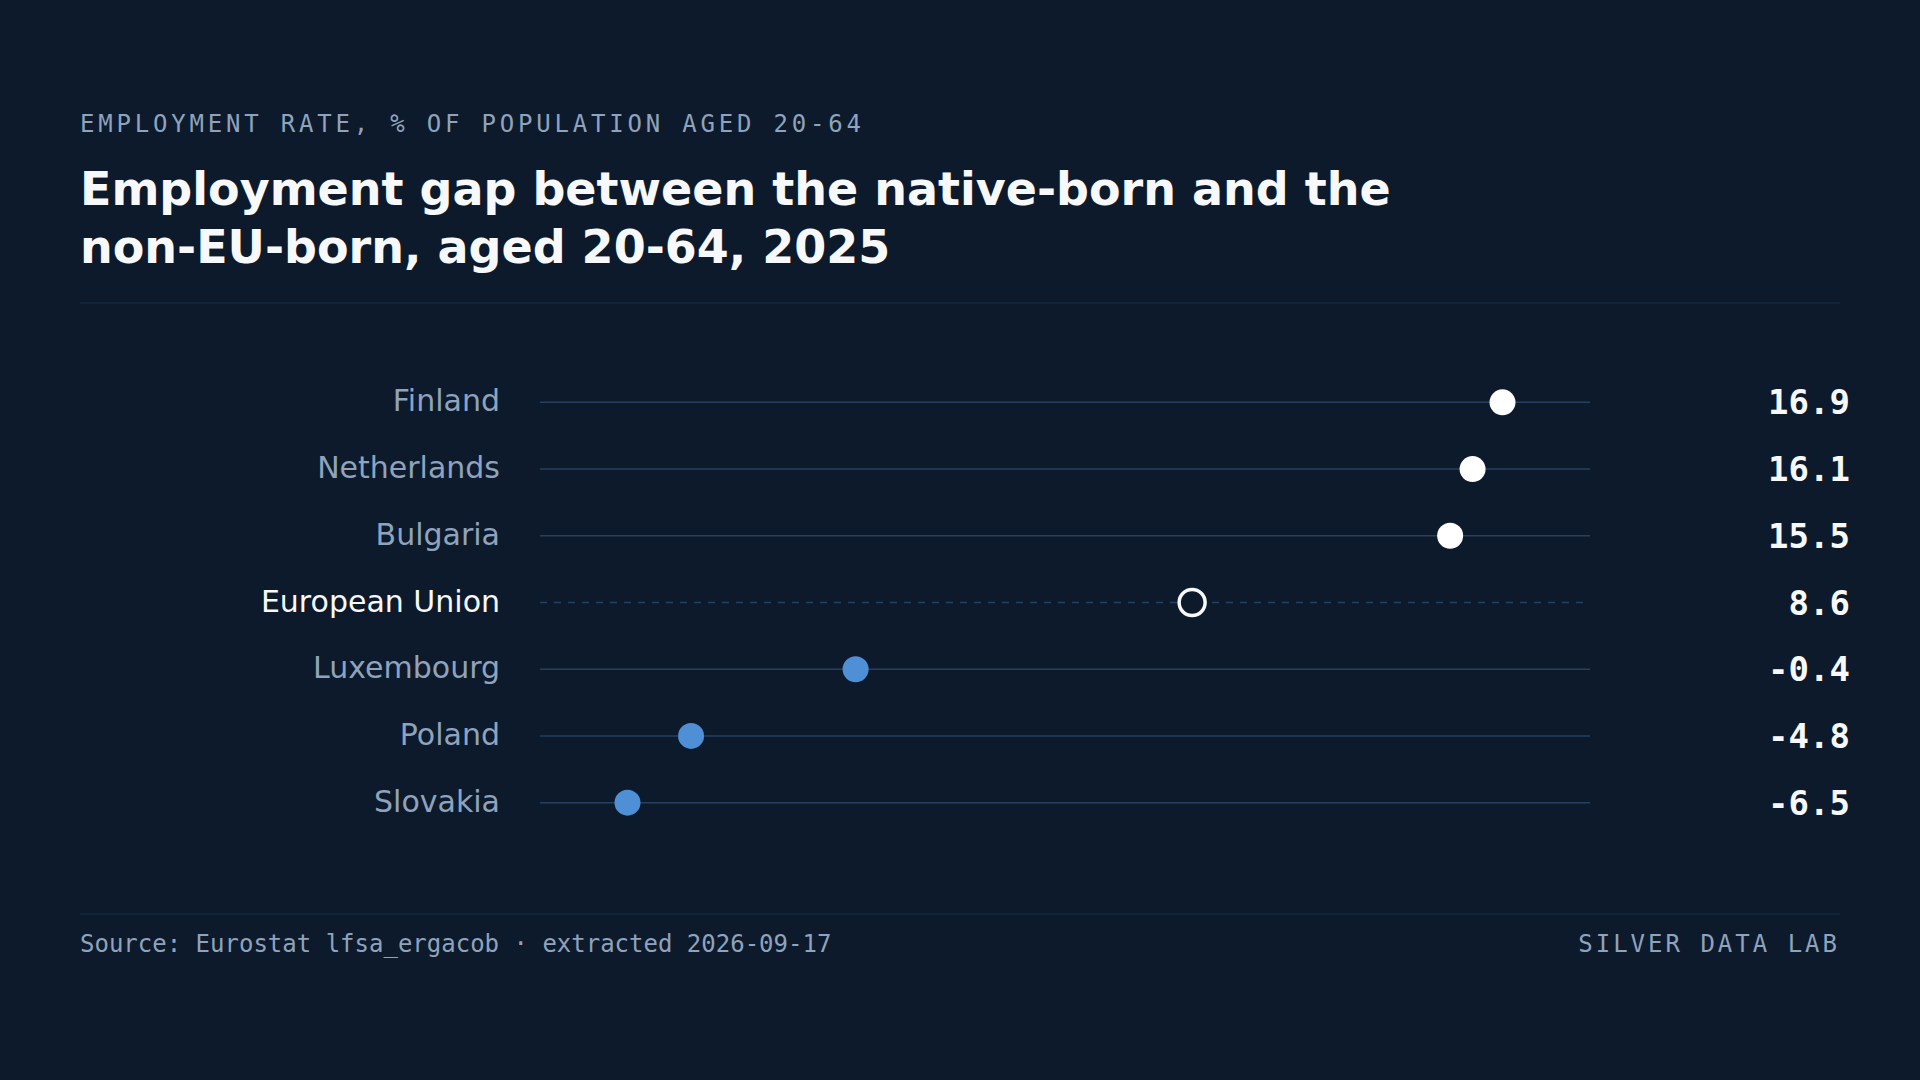
- Finland records the widest gap at 16.9 points, followed by the Netherlands at 16.1, Bulgaria at 15.5 and Germany at 15.0.
- Slovakia at −6.5, Poland at −4.8, Luxembourg at −0.4 and Portugal at −0.3 are the four Member States where the non-EU-born rate exceeds the native one.
- Eight Member States have a gap above 10 points; seven have one below 2.
- People born in another EU Member State are employed at 77.5% across the Union, slightly above the native-born.
Three populations, one comparison
The Labour Force Survey records where each respondent was born, which lets Eurostat publish employment rates for three groups: people born in the country where they now live, people born in another EU Member State, and people born outside the Union. This study compares the first and the third, for the population aged 20 to 64.
Across the EU in 2025, 77.2% of the native-born were in employment, 77.5% of those born elsewhere in the Union, and 68.6% of those born outside it. The overall rate for everybody was 76.1%. The gap this study follows is the first figure minus the third: 8.6 percentage points, computed here from the two published rates.
Where the gap is widest
Finland has the widest gap in the Union: 78.3% of the native-born are in work against 61.4% of the non-EU-born, a difference of 16.9 points. The Netherlands follows at 16.1 points, with 85.9% against 69.8%; Bulgaria at 15.5, with 77.1% against 61.6%; Germany at 15.0, with 84.0% against 69.0%; Belgium at 14.3; France at 14.1; Sweden at 13.7; and Austria at 12.7. Those eight are the Member States above 10 points. Denmark, at 9.2, is the only other one above the EU figure.
With the exception of Bulgaria, the list is the north and west of the Union, and specifically the countries with the highest native employment rates. The Netherlands, Sweden and Germany have native-born rates of 85.9%, 84.7% and 84.0%, the highest in the EU. A wide gap there is partly a high bar: the non-EU-born in the Netherlands, at 69.8%, are employed at a higher rate than the native-born in Italy.
Belgium is the exception to that reading. Its native rate of 75.0% is below the EU average, and its non-EU-born rate of 60.7% is the lowest in the Union.
Where there is no gap, or it runs the other way
In four Member States people born outside the EU are more likely to be in work than the native-born. Slovakia records 84.6% against 78.1%, a reversed gap of 6.5 points; Poland 83.5% against 78.7%, or 4.8 points; Portugal 79.7% against 79.4%; and Luxembourg 70.1% against 69.7%. The last two differences are too small to carry weight on their own, but the sign is what matters.
Czechia at 0.8 points, Ireland at 1.2 and Italy at 1.6 are next: seven Member States have a gap below 2 points, and Slovenia at 2.0 and Greece at 2.1 sit just beyond them.
Slovakia, Poland and Czechia share a feature: their non-EU-born rates of 84.6%, 83.5% and 82.1% are the three highest in the Union, well above the EU native-born rate. Ireland's 78.9% and Portugal's 79.7% are also above it. In those countries the population born outside the EU is, at least as far as employment can show, a working population.
Italy is a different case. Its gap of 1.6 points is narrow because its native-born rate of 67.7% is the lowest in the EU: the non-EU-born, at 66.1%, are employed at a rate that would be near the bottom of the ranking in any country, and so are the natives.
What the comparison cannot settle
Why the gap is 16.9 points in Finland and reversed in Slovakia is not something an employment rate can answer. The two populations born outside the EU are not the same population: they differ in age, in education, in how long ago they arrived and in why. A country whose migrants came recently to work will show a narrow gap or a reversed one; a country whose migrants include many who came for protection, or to join family, will show a wider one for reasons that have little to do with how the labour market treats newcomers. The figures here measure the outcome and leave the explanation open.
Employment gap between the native-born and the non-EU-born, aged 20-64, 2025
| Country | percentage points | Gap to EU averagepercentage points, derived |
|---|---|---|
| Finland | 16.9 | +8.3 |
| Netherlands | 16.1 | +7.5 |
| Bulgaria | 15.5 | +6.9 |
| European Unionaggregate | 8.6 | — |
| Luxembourg | -0.4 | −9.0 |
| Poland | -4.8 | −13.4 |
| Slovakia | -6.5 | −15.1 |
This table as data: CSV · JSON
Every Member State for this indicator+
Members see every Member State for this indicator here, not only the rows the ranking prints. Become a Member
Embed this chart
Paste this code into a page. The frame carries the source and the extraction date, and links back to the study.
Employment rate of people born outside the EU, aged 20-64, 2025
| Country | % in employment | Gap to EU averagepercentage points, derived |
|---|---|---|
| Slovakia | 84.6 | +16.0 |
| Poland | 83.5 | +14.9 |
| Czechia | 82.1 | +13.5 |
| European Unionaggregate | 68.6 | — |
| Bulgaria | 61.6 | −7.0 |
| Finland | 61.4 | −7.2 |
| Belgium | 60.7 | −7.9 |
This table as data: CSV · JSON
Every Member State for this indicator+
Members see every Member State for this indicator here, not only the rows the ranking prints. Become a Member
Embed this chart
Paste this code into a page. The frame carries the source and the extraction date, and links back to the study.
What these figures cannot tell you
- The gap is a derived figure
- Eurostat publishes the employment rate of each group separately. The difference between the native-born and the non-EU-born is computed by Silver Data Lab by subtraction and is labelled as derived wherever it appears.
- Country of birth is not citizenship
- A naturalised citizen born abroad counts as foreign-born here; a citizen of another country born in the reporting country counts as native-born. The other migrant studies on this site use citizenship, which is a different classification, and their figures should not be read as the same populations.
- Not every Member State publishes every group
- Malta publishes no breakdown by country of birth, so it is absent from both rankings. Bulgaria and Romania publish no rate for people born in another EU Member State. Eurostat flags the Spanish and French figures as following a definition that differs from the common one.
- Composition is not controlled for
- The two populations differ in age, education, years since arrival and reason for migration, and none of that is held constant. A narrow gap can describe a labour market that absorbs newcomers, or a migrant population made up of people who came to work; the rate alone cannot tell them apart.
Frequently asked questions
- What is the employment gap between migrants and natives in the EU?
- 8.6 percentage points in 2025 for people born outside the EU: 68.6% of them aged 20 to 64 were in work, against 77.2% of the native-born. The gap is computed by subtraction from the two published rates. People born in another EU Member State were employed at 77.5%.
- Which EU country has the widest gap?
- Finland, at 16.9 points: 78.3% of the native-born in work against 61.4% of the non-EU-born. The Netherlands at 16.1, Bulgaria at 15.5 and Germany at 15.0 follow.
- Are there EU countries where migrants are more likely to work than natives?
- Four, for people born outside the EU: Slovakia, where 84.6% are in work against 78.1% of the native-born; Poland, 83.5% against 78.7%; Portugal, 79.7% against 79.4%; and Luxembourg, 70.1% against 69.7%.
- Does a narrow gap mean better integration?
- Not by itself. Italy's gap is 1.6 points because its native-born rate of 67.7% is the lowest in the EU, not because the non-EU-born do well; and a country whose migrants arrived recently to work will show a narrow gap whatever its labour market does for them.
Methodological note
Eurostat publishes employment rates by country of birth from the EU Labour Force Survey. This study uses the population aged 20 to 64, both sexes, for 2025, and three of the published groups: born in the reporting country, born in another EU Member State, and born outside the EU. The overall rate for the whole population is quoted from the same table.
The gap is the rate for the native-born minus the rate for the non-EU-born, computed by Silver Data Lab for each Member State and for the EU aggregate, and labelled as derived. The counts of Member States above 10 points, below 2 points and with a negative gap follow from that calculation. The employment rates themselves are used exactly as published.
Age 20 to 64 is the band used throughout this site for employment rates. It is not Eurostat's default view, which is 15 to 64, and the two are several points apart.
Source data
The underlying series can be inspected and re-downloaded from the Eurostat data browser. The filters below are the ones applied.
Employment rates by country of birth
lfsa_ergacob
- Filters applied:
- freq=A · unit=PC · sex=T · age=Y20-64 · c_birth=TOTAL, NAT, EU27_2020_FOR, NEU27_2020_FOR · time=2025
- Extracted:
- 2026-09-17
- Source last updated:
- 2026-09-10
Download the data
The data the study you have just read is built on, exactly as it was downloaded and archived.
Yours as a Member.
Data downloadable by Members
How to cite
Record the vintage as well as the study: the figures on this page are the ones extracted on the dates below.
Silver Data Lab Research Desk (2026). Employment of Non-EU-Born Adults Trails the Native-Born by 8.6 Points in the EU and by 16.9 in Finland. Silver Data Lab, published 17 September 2026, last updated 17 September 2026. https://www.silverdatalab.com/studies/migrant-employment-gap-in-the-eu
- Data: Eurostat, Employment rates by country of birth (lfsa_ergacob), filters freq=A, unit=PC, sex=T, age=Y20-64, c_birth=TOTAL, NAT, EU27_2020_FOR, NEU27_2020_FOR, time=2025; extracted 2026-09-17; source last updated 2026-09-10. https://doi.org/10.2908/lfsa_ergacob
Silver Data Lab's analysis is licensed CC BY 4.0. The statistics remain their publisher's and keep its terms of reuse.
Ask the research desk
A question about this study — a definition, a filter, a break in the series, what the figures can and cannot support — answered by the desk that made the extraction.
Members can write to the research desk
Studies where the same country leads or trails
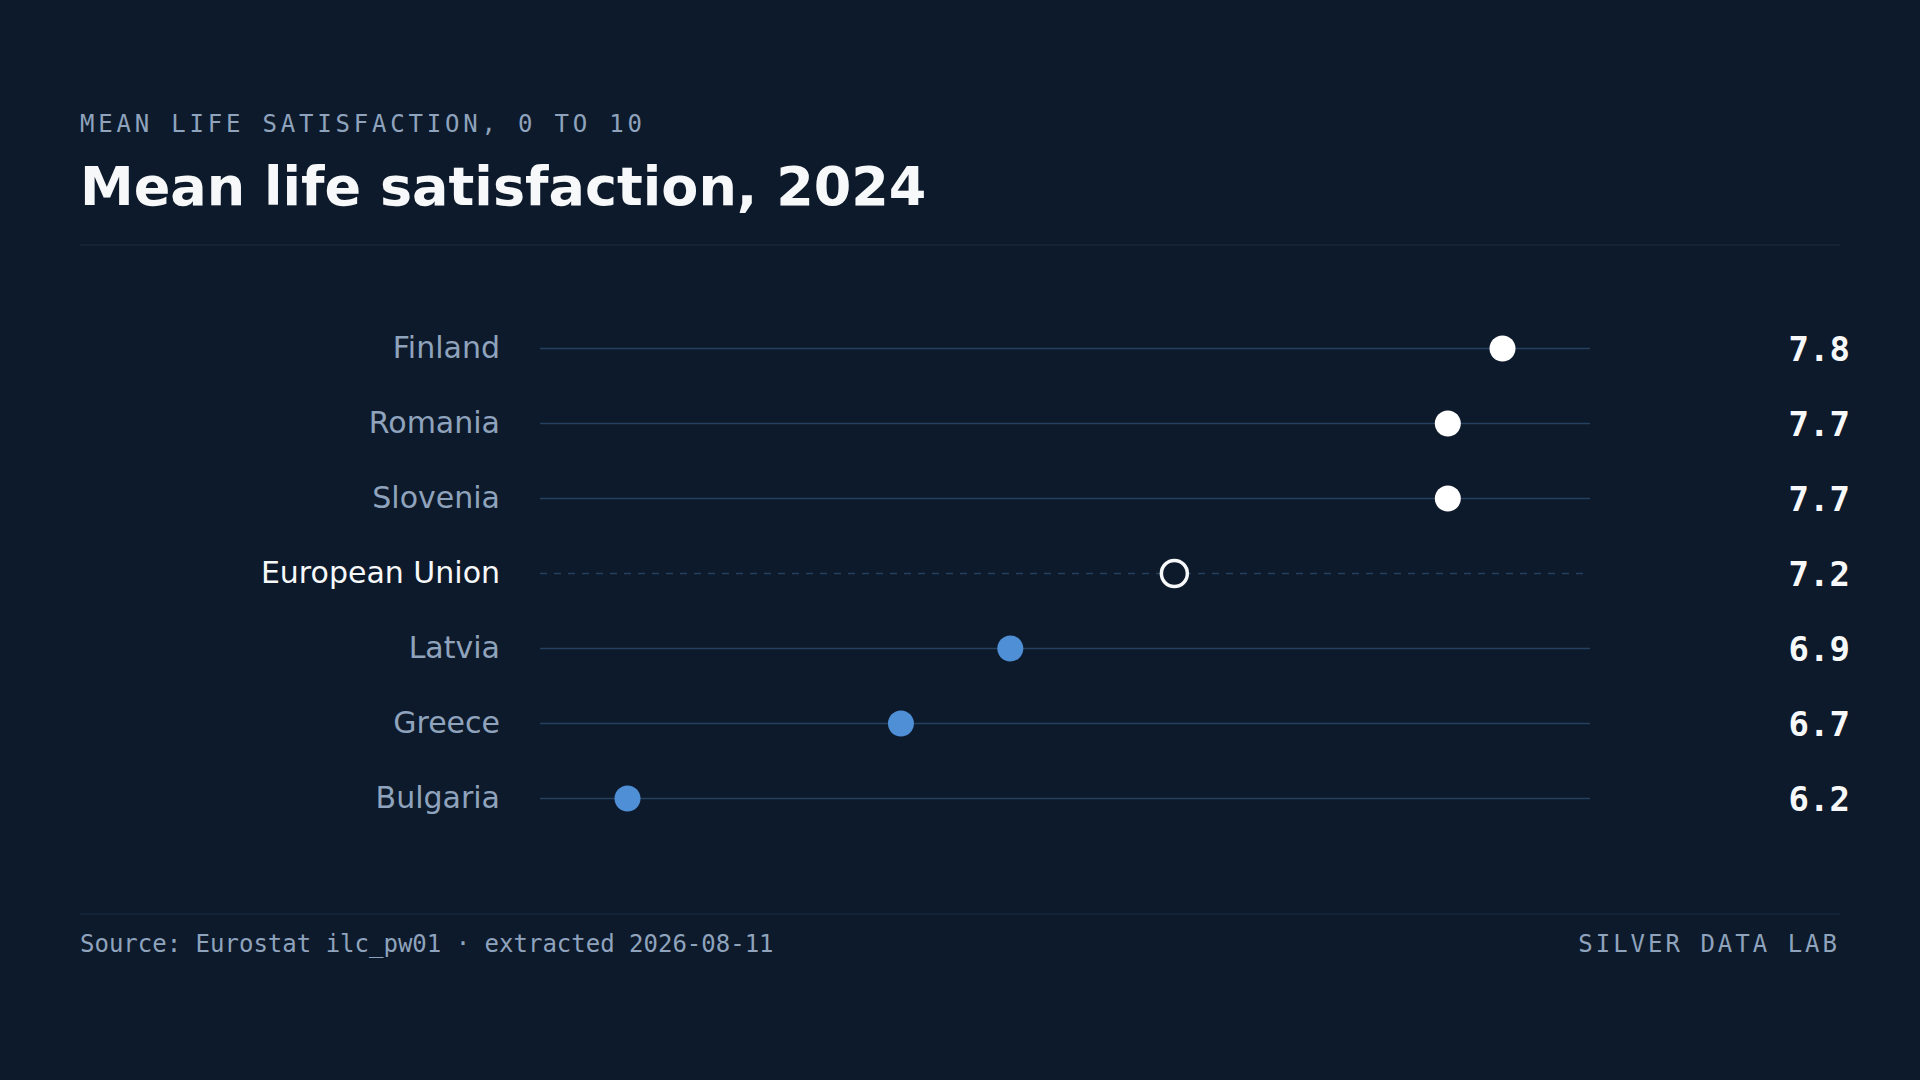
Romanians Rate Their Lives Higher Than Germans Do
Europeans aged 16 and over rated their overall life satisfaction at 7.2 out of 10 in 2024.
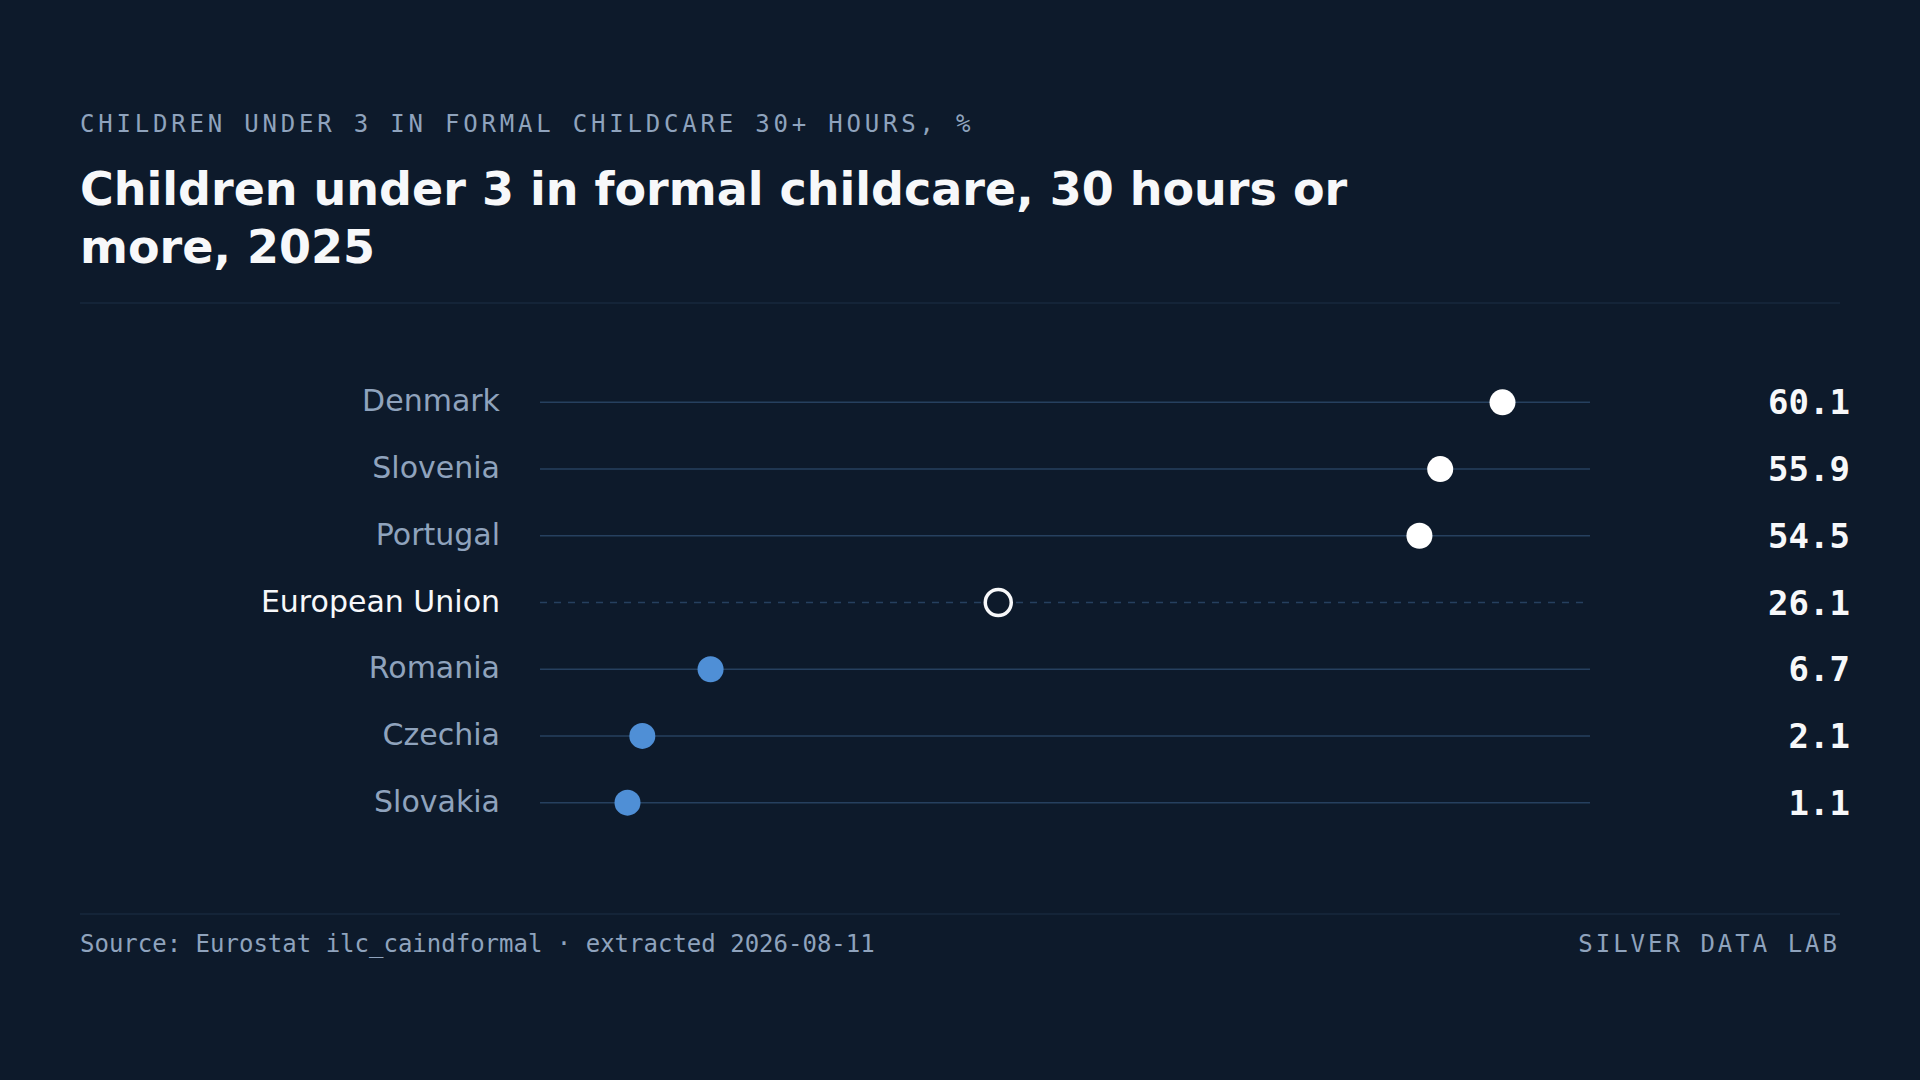
Sixty Per Cent of Danish Under-Threes Are in Full-Time Childcare. In Slovakia, One Per Cent.
26.1% of EU children under three attended formal childcare for 30 hours a week or more in 2025.
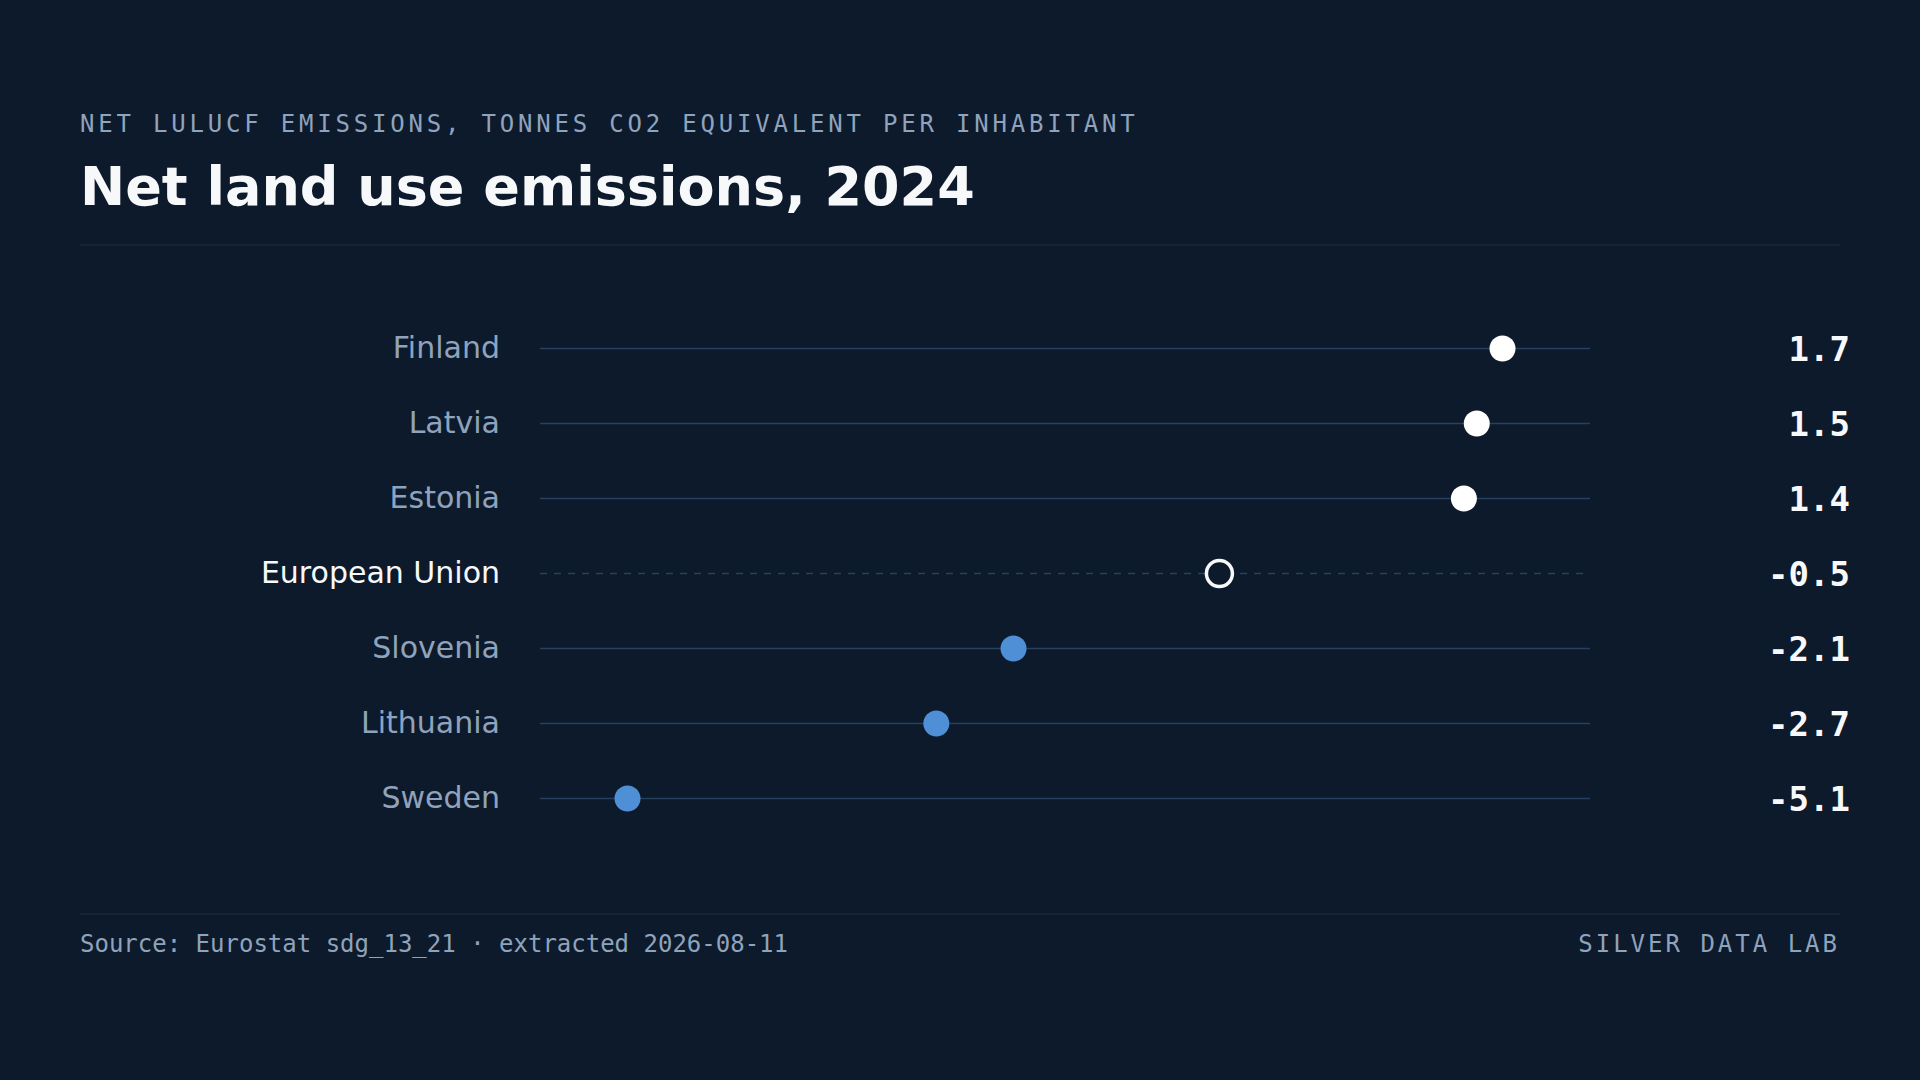
Finland's Forest Carbon Sink Has Shrunk by More Than 99%. Its Land Now Emits Carbon.
EU land, forests and soils removed a net 0.5 tonnes of CO2 equivalent per inhabitant in 2024.