The Share of People in Malta Without Maltese Citizenship Has Quadrupled
Silver Data Lab Research Desk · Statistical analysis · Published on 21 October 2026
- Data source
- Eurostat
- Reference period
- 1 January 2025
- Last updated
- 21 October 2026
Re-checked against the source on 21 October 2026. No value in its datasets has moved between the snapshots we hold. Every revision we have observed →
Key estimates
- On 1 January 2025, 29.4% of the people living in Malta did not hold Maltese citizenship, more than four times the 6.8% of 2014: a derived rise of 22.6 percentage points, three times the next largest in the EU, Austria's 7.5.
- Luxembourg has the highest share, 47.0%, and about three in four of its residents without Luxembourg citizenship are citizens of another EU country; in 22 of the 26 Member States with a 2025 value, citizens of non-EU countries are the larger group.
- Between 2014 and 2025 the share rose in 24 of those 26 Member States, five of them across a break in their series, and fell in two: Latvia, from 15.2% to 12.3%, and Greece, from 8.1% to 7.1%.
- Poland and Slovakia have the lowest shares, both 1.2%, with Poland's count estimated and provisional; six Member States, all of them in central and eastern Europe, are below 5%.
- Across the EU, 9.6% of residents were not citizens of the country they lived in on 1 January 2024, the latest date with an EU count, against 7.8% in 2019; both shares are derived, and the EU series breaks in 2021 and 2023.
Nearly three in ten people in Malta
On 1 January 2025, 168,938 of the 574,250 people living in Malta were not Maltese citizens. That is 29.4% of the resident population, a share Silver Data Lab derives from two counts Eurostat publishes. On 1 January 2014 the figures were 29,291 out of 428,156, or 6.8%. The share has more than quadrupled, and its rise of 22.6 percentage points is three times Austria's 7.5, the second largest among the 26 Member States with values for both years. No value in Malta's series carries a flag, so neither a break in the series nor an estimate stands behind the comparison.
Over those eleven years Malta's population grew by 146,094 and the number of its residents without Maltese citizenship by 139,647, both differences derived from the published counts: the second is almost as large as the first.
The climb was not even. The share reached 18.4% in 2019 and 21.7% in 2020, barely moved in 2021, at 21.8%, and rose again in each of the four years after, to 29.4%. Eurostat's split by group of citizenship starts for Malta in 2021, and it shows where the recent rise sits: citizens of countries outside the EU went from 14.3% of Malta's residents that year to 21.4% in 2025, while citizens of other Member States went from 7.5% to 8.0%. Malta's 21.4% is the highest share of non-EU citizens among the 26 Member States.
What the share counts
Eurostat counts the people usually resident in a country on 1 January who do not hold its citizenship: citizens of other EU Member States, citizens of countries outside the Union and stateless people. It publishes the count as a number of persons, and a number mostly measures how large a country is: Germany's 12,392,275 is the largest, against 168,938 in Malta. So this study divides each count by the country's total resident population on the same date, taken from the Eurostat dataset that count is drawn from, and every share on this page is derived in that way.
Citizenship is a legal status, not a record of where a person was born or when they arrived. Someone who moved to a country and later became its citizen leaves the count. A child born in the country can be in it, if that country's law does not make the child a citizen at birth. Those rules are national, so part of the distance between two countries comes from their citizenship law rather than from who lives there. Eurostat publishes a separate count of people born abroad, a different population that this study does not use; this site's study of the employment gap of people born outside the EU classifies by birth in that way.
From Luxembourg to Poland
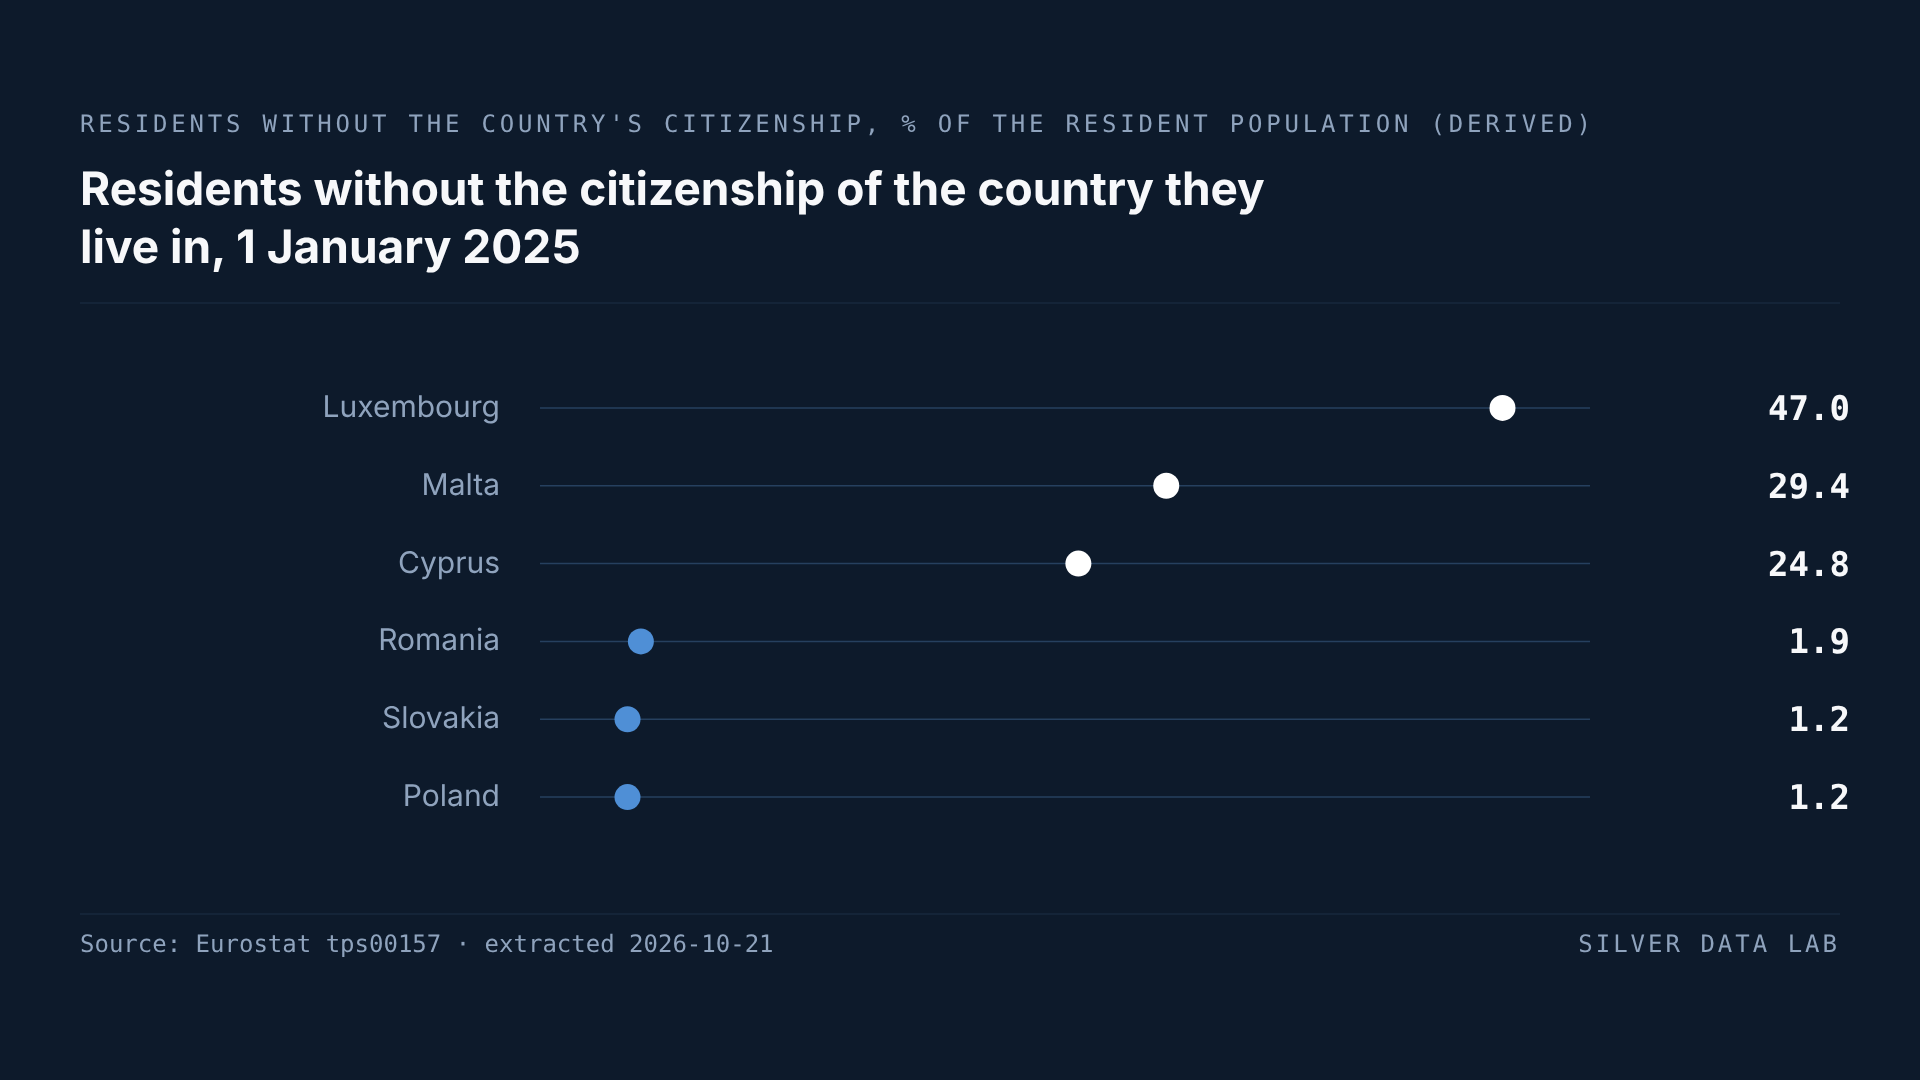
Luxembourg stands far ahead of every other Member State: 47.0% of its residents are not Luxembourg citizens, close to one in two. Malta follows at 29.4% and Cyprus at 24.8%, then Austria at 20.0%, one resident in five, Estonia at 17.9% and Ireland at 16.1%. Germany records 14.8%, Spain 14.1%, Belgium 14.0%, Latvia 12.3%, Denmark 11.3% and Slovenia 10.1%. That makes twelve Member States in which at least one resident in ten lacks the country's citizenship, against eight in 2014.
France, at 9.4% on provisional figures, Italy at 9.1%, Czechia at 9.0% and the Netherlands at 8.9% sit in the middle of the ranking, with Sweden at 7.8%, Finland at 7.3%, Greece at 7.1% and Lithuania at 5.2% below them.
Six Member States are under 5%, all of them in central and eastern Europe: Croatia at 4.0%, Hungary at 2.7%, Bulgaria at 2.3%, Romania at 1.9%, a value Eurostat marks as estimated, Slovakia at 1.2% and Poland at 1.2%, where the count is estimated and provisional. Poland's share is the lower of the last two, by less than a tenth of a point.
Portugal is the one Member State absent from the ranking. Eurostat has published its total population on 1 January 2025 but no count of its residents by citizenship.
Citizens of another EU country, or of the rest of the world
Eurostat also divides the count between citizens of another Member State and citizens of countries outside the Union, and the division changes how the top of the ranking reads. In Luxembourg, 244,291 of the 320,608 residents without its citizenship, or 76.2%, are citizens of another Member State. They alone make up 35.8% of Luxembourg's population, a derived share above the whole of Malta's. Citizens of other EU countries are also the larger group in Slovakia, at 60.8% of residents without Slovak citizenship, in Belgium, at 60.3%, and in Austria, where they number 923,854 against 909,689 citizens of non-EU countries, 50.2% of the total. In the other 22 Member States with a 2025 value, citizens of non-EU countries are the larger group.
In Luxembourg the mix is shifting inside a share that hardly moves. From 2017, the year its series breaks, to 2025 the total went from 47.6% to 47.0%, while citizens of other Member States fell from 39.6% of residents to 35.8% and citizens of non-EU countries rose from 7.9% to 11.2%.
The other extreme of the split is in the Baltic States. In Latvia the non-EU group makes up 98.2% of residents without Latvian citizenship, and in Estonia 90.8% of those without Estonian citizenship. In both, that group takes in people Eurostat classifies as recognised non-citizens: people who are citizens neither of the country they live in nor of any other, but who have established ties to it carrying some of the rights and obligations of its citizens. Eurostat describes them as mainly former Soviet citizens living in the Baltic States who have not applied for the citizenship of the country where they live.
A rise in nearly every Member State
Between 1 January 2014 and 1 January 2025 the share rose in 24 of the 26 Member States. Five of those rises cross a break in the series, in Luxembourg, Italy, Czechia, Croatia and Germany, whose years are listed under the limitations below. After Malta and Austria, Germany recorded the third largest rise, 6.1 points, from 8.7% to 14.8%, though its series breaks in 2023. Slovenia's share more than doubled, from 4.7% to 10.1%, and Cyprus's rose from 19.5% to 24.8%.
Several of the steepest increases in proportion started from very low levels. Lithuania's share went from 0.7% to 5.2%, more than seven times its 2014 level, with no flag anywhere in its series; the largest single step came between 2022 and 2023, from 1.2% to 3.4%. Croatia's went from 0.6% to 4.0%, but its series breaks in 2022, and from that year alone its share has gone from 0.9% to 4.0%.
Where the share fell
Latvia and Greece are the two exceptions. Latvia's share fell from 15.2% to 12.3% and Greece's from 8.1% to 7.1%, neither series carrying a flag. Both shares went down in every year but one, and in both that year was 2023. In Latvia the count shrank from 304,835 people to 229,681, while the population as a whole went from 2,001,468 to 1,860,565.
A smaller count can come from people leaving the country, from people acquiring its citizenship or from deaths, and the table does not separate them. It gives no reason for either fall, and none is offered here. Latvia's count also takes in its recognised non-citizens, described above, so the fall there describes them and citizens of other countries together.
Sweden is a series that has turned without falling below its starting point. Its share peaked in 2019, at 9.0%, and has fallen in every year since, to 7.8%, still above the 7.1% of 2014. Measured from 2019 rather than 2014, five Member States stand lower in 2025: Latvia, Sweden, Greece, Luxembourg and Slovakia.
The EU as a whole
Eurostat publishes an EU count of residents without the country's citizenship for every year from 2014 to 2024. On 1 January 2024, 43,006,349 of the 449,306,184 people living in the EU were not citizens of the country they lived in: 9.6%, by derived share, with both counts marked as estimated and provisional. Of them, 28,974,079 were citizens of non-EU countries and 13,974,500 citizens of another Member State, two in three and one in three, both counts estimated. In 2019, the one year from 2014 onwards in which neither EU count carries a flag, the share was 7.8%, and in 2014 it was 6.5%. The EU series breaks in 2015, 2017, 2021 and 2023, and its 2014 counts are flagged as a break and as estimated, so those three readings show a direction more reliably than a size.
For 1 January 2025 Eurostat publishes no such EU count, and none is built here by adding up the Member States. The ranking above therefore carries no EU row.
Residents without the citizenship of the country they live in, 1 January 2025
| Country | % of the resident population (derived) |
|---|---|
| Luxembourg | 47.0 |
| Malta | 29.4 |
| Cyprus | 24.8 |
| Romania | 1.9 |
| Slovakia | 1.2 |
| Poland | 1.2 |
This table as data: CSV · JSON
Every Member State for this indicator+
Members see every Member State for this indicator here, not only the rows the ranking prints. Become a Member
Embed this chart
Paste this code into a page. The frame carries the source and the extraction date, and links back to the study.
Change in the share of residents without the country's citizenship, 1 January 2014 to 1 January 2025
| Country | percentage points (derived) |
|---|---|
| Malta | 22.6 |
| Austria | 7.5 |
| Germany | 6.1 |
| Slovakia | 0.1 |
| Greece | -1.0 |
| Latvia | -2.9 |
This table as data: CSV · JSON
Every Member State for this indicator+
Members see every Member State for this indicator here, not only the rows the ranking prints. Become a Member
Embed this chart
Paste this code into a page. The frame carries the source and the extraction date, and links back to the study.
What these figures cannot tell you
- Citizenship, not migration
- The count follows a legal status. People who moved to a country and acquired its citizenship are not in it; children born in the country can be, where its law does not grant citizenship at birth; and people born abroad who hold the country's citizenship by descent are not. How quickly residents can become citizens differs between Member States, so a lower share can reflect easier naturalisation as well as fewer people from elsewhere. None of the figures here is a count of immigrants or of people born abroad, for which Eurostat publishes separate tables.
- Recognised non-citizens in Latvia and Estonia
- In Latvia and Estonia the count includes recognised non-citizens, people who hold neither the citizenship of the country nor that of any other but have established ties to it, mainly former Soviet citizens in Eurostat's description. They fall within the non-EU group of the split. The extraction used here does not separate them, so the Latvian and Estonian shares, and their changes, describe them and citizens of other countries together.
- A share computed from a matching total
- Eurostat publishes the count of residents without the country's citizenship, not its share. The share is derived here by dividing that count by the total population on the same date from migr_pop1ctz, the dataset the count is drawn from, so numerator and denominator come from the same dataset and the same date; every tps00157 value used equals the migr_pop1ctz value for the same country and year. Eurostat's metadata notes that its most recent total population figures appear in a separate table, demo_gind, and that the detailed breakdowns can follow later, so the total used here can differ from the headline population Eurostat publishes for the same date.
- Flags and breaks in series
- Poland's count is flagged as provisional in 2014 and 2015 and as estimated and provisional in 2016 to 2018 and in every year from 2020, and its total population breaks in 2021. Romania's count is estimated from 2020, and France's figures are provisional from 2023 and flagged as a break in 2014. Luxembourg's series breaks in 2017, Italy's in 2019, Czechia's in 2021, Croatia's in 2022 and Germany's in 2023, so a comparison of 2014 with 2025 crosses a break in each of those five. Two series drop sharply between 2021 and 2022 with no flag at all: Bulgaria's count from 108,438 to 63,861 and Slovakia's from 82,075 to 60,142. Neither drop is flagged, the study gives no reason for either, and the change since 2014 in those two countries should be read with both in mind.
- Not every country counts the same population
- EU rules recommend counting the usually resident population, and allow registered or legal residence where usual residence cannot be established. Eurostat's metadata lists Austria, Denmark, Luxembourg, the Netherlands and Sweden as reporting the population on their registers and Finland its legally resident population; Czechia, Germany and Spain appear under both the usual-residence and the register definitions, Czechia's usual-residence entry applying to non-nationals. Slovakia reports usual residence in the sense of permanent residence. The others report the usually resident population. Who counts as living in a country, and so who is in both the count and the total, is not drawn identically everywhere.
- No 2025 value for Portugal or for the EU
- Portugal has a total population for 1 January 2025 but no count by citizenship, so it is left out of both rankings and of every count of Member States; Portugal's earlier values are not used either, to keep each comparison over the same 26 countries. Eurostat publishes no EU total of residents without the country's citizenship for 2025. It does publish 2025 EU counts for citizens of other Member States and of non-EU countries separately, flagged as imputed by Eurostat or another receiving agency, and provisional; the study uses neither and quotes EU figures only for years with an EU total.
Frequently asked questions
- What share of EU residents are not citizens of the country they live in?
- 9.6% on 1 January 2024, the latest date for which Eurostat publishes an EU count: 43,006,349 people out of 449,306,184, both counts estimated and provisional, with the share derived from them. About two in three of them were citizens of countries outside the EU.
- Which EU country has the highest share of residents without its citizenship?
- Luxembourg, where 47.0% of residents were not Luxembourg citizens on 1 January 2025, about three quarters of them citizens of other EU countries. Malta follows at 29.4% and Cyprus at 24.8%. In number rather than share, Germany has the most, 12,392,275.
- How much has the share changed in Malta?
- It went from 6.8% on 1 January 2014 to 29.4% on 1 January 2025, a derived rise of 22.6 points and the largest of the 26 Member States with values for both years. Since 2021, the first year Eurostat splits Malta's count, most of the rise has been among citizens of non-EU countries. The table records citizenship only, not why people came or how long they have stayed.
- Is this the same as the number of immigrants?
- No. It counts residents without the country's citizenship, which leaves out people who moved there and became citizens and can include children born in the country. People born abroad are a different population, which Eurostat publishes separately. It is not a count of residence permits either, which cover only non-EU citizens holding a valid permit, nor a net migration rate, which measures arrivals and departures over a year rather than the people living in a country on one day.
- Why is there no EU figure for 2025?
- Eurostat has not published an EU count of residents without the country's citizenship for 1 January 2025, and Portugal's count by citizenship is missing for that date. The study does not add up the Member States to make one, so the 2025 ranking has no EU row and EU figures are quoted for 2024 and earlier only.
Methodological note
The study measures the number of people usually resident in each EU Member State on 1 January who do not hold the citizenship of that country, citizens of other countries and stateless people together, as Eurostat publishes it in table tps00157 for every year from 2014 to 2025, and sets it against the total resident population on the same date from migr_pop1ctz, the dataset tps00157 is drawn from. The same migr_pop1ctz extraction carries the split between citizens of other EU Member States and citizens of countries outside the Union, available for every Member State from 2021, and for the EU as a whole for 2021 and from 2023. All values are for both sexes and all ages, as numbers of persons.
The counts are quoted as Eurostat publishes them, with their flags stated wherever a flagged value is named. Silver Data Lab derived every percentage on the page: each share of the resident population, as a published count divided by the published total for the same country, or for the EU, on the same date; each group's share of the residents without the country's citizenship; the change in a share between two dates, in percentage points, which the second ranking shows for 2014 to 2025, computed from unrounded shares; the ratio of a share to its earlier level, for Malta, Lithuania and Slovenia, and of Malta's rise to Austria's; Malta's changes in population and in residents without Maltese citizenship from 2014 to 2025, as differences between published counts; the margin between Poland's and Slovakia's shares; the years in which a country's share rose or fell; and the number of Member States at or above 10% and below 5%, with a rise or a fall over a period, or with citizens of other Member States as the larger group. Every count, rank and comparison is taken over the 26 Member States with a 2025 value, Portugal being the one without. No other value is calculated.
Source data
This study draws on 2 datasets from Eurostat. Each can be inspected and re-downloaded from its catalogue, and the filters below are the ones applied.
Population without the citizenship of the reporting country
tps00157
- Filters applied:
- freq=A · citizen=FOR_STLS · age=TOTAL · unit=NR · sex=T
- Extracted:
- 2026-10-21
- Source last updated:
- 2026-09-25
Population on 1 January by age group, sex and citizenship
migr_pop1ctz
- Filters applied:
- freq=A · citizen=TOTAL, FOR_STLS, EU27_2020_FOR, NEU27_2020_FOR · age=TOTAL · unit=NR · sex=T · sinceTimePeriod=2014
- Extracted:
- 2026-10-21
- Source last updated:
- 2026-09-25
Download the data
The data the study you have just read is built on, exactly as it was downloaded and archived.
Yours as a Member.
Data downloadable by Members
How to cite
Record the vintage as well as the study: the figures on this page are the ones extracted on the dates below.
Silver Data Lab Research Desk (2026). The Share of People in Malta Without Maltese Citizenship Has Quadrupled. Silver Data Lab, published 21 October 2026, last updated 21 October 2026. https://www.silverdatalab.com/studies/foreign-citizens-in-the-eu
- Data: Eurostat, Population without the citizenship of the reporting country (tps00157), filters freq=A, citizen=FOR_STLS, age=TOTAL, unit=NR, sex=T; extracted 2026-10-21; source last updated 2026-09-25. https://doi.org/10.2908/tps00157
- Data: Eurostat, Population on 1 January by age group, sex and citizenship (migr_pop1ctz), filters freq=A, citizen=TOTAL, FOR_STLS, EU27_2020_FOR, NEU27_2020_FOR, age=TOTAL, unit=NR, sex=T, sinceTimePeriod=2014; extracted 2026-10-21; source last updated 2026-09-25. https://doi.org/10.2908/migr_pop1ctz
Silver Data Lab's analysis is licensed CC BY 4.0. The statistics remain their publisher's and keep its terms of reuse.
Ask the research desk
A question about this study — a definition, a filter, a break in the series, what the figures can and cannot support — answered by the desk that made the extraction.
Members can write to the research desk
Studies where the same country leads or trails
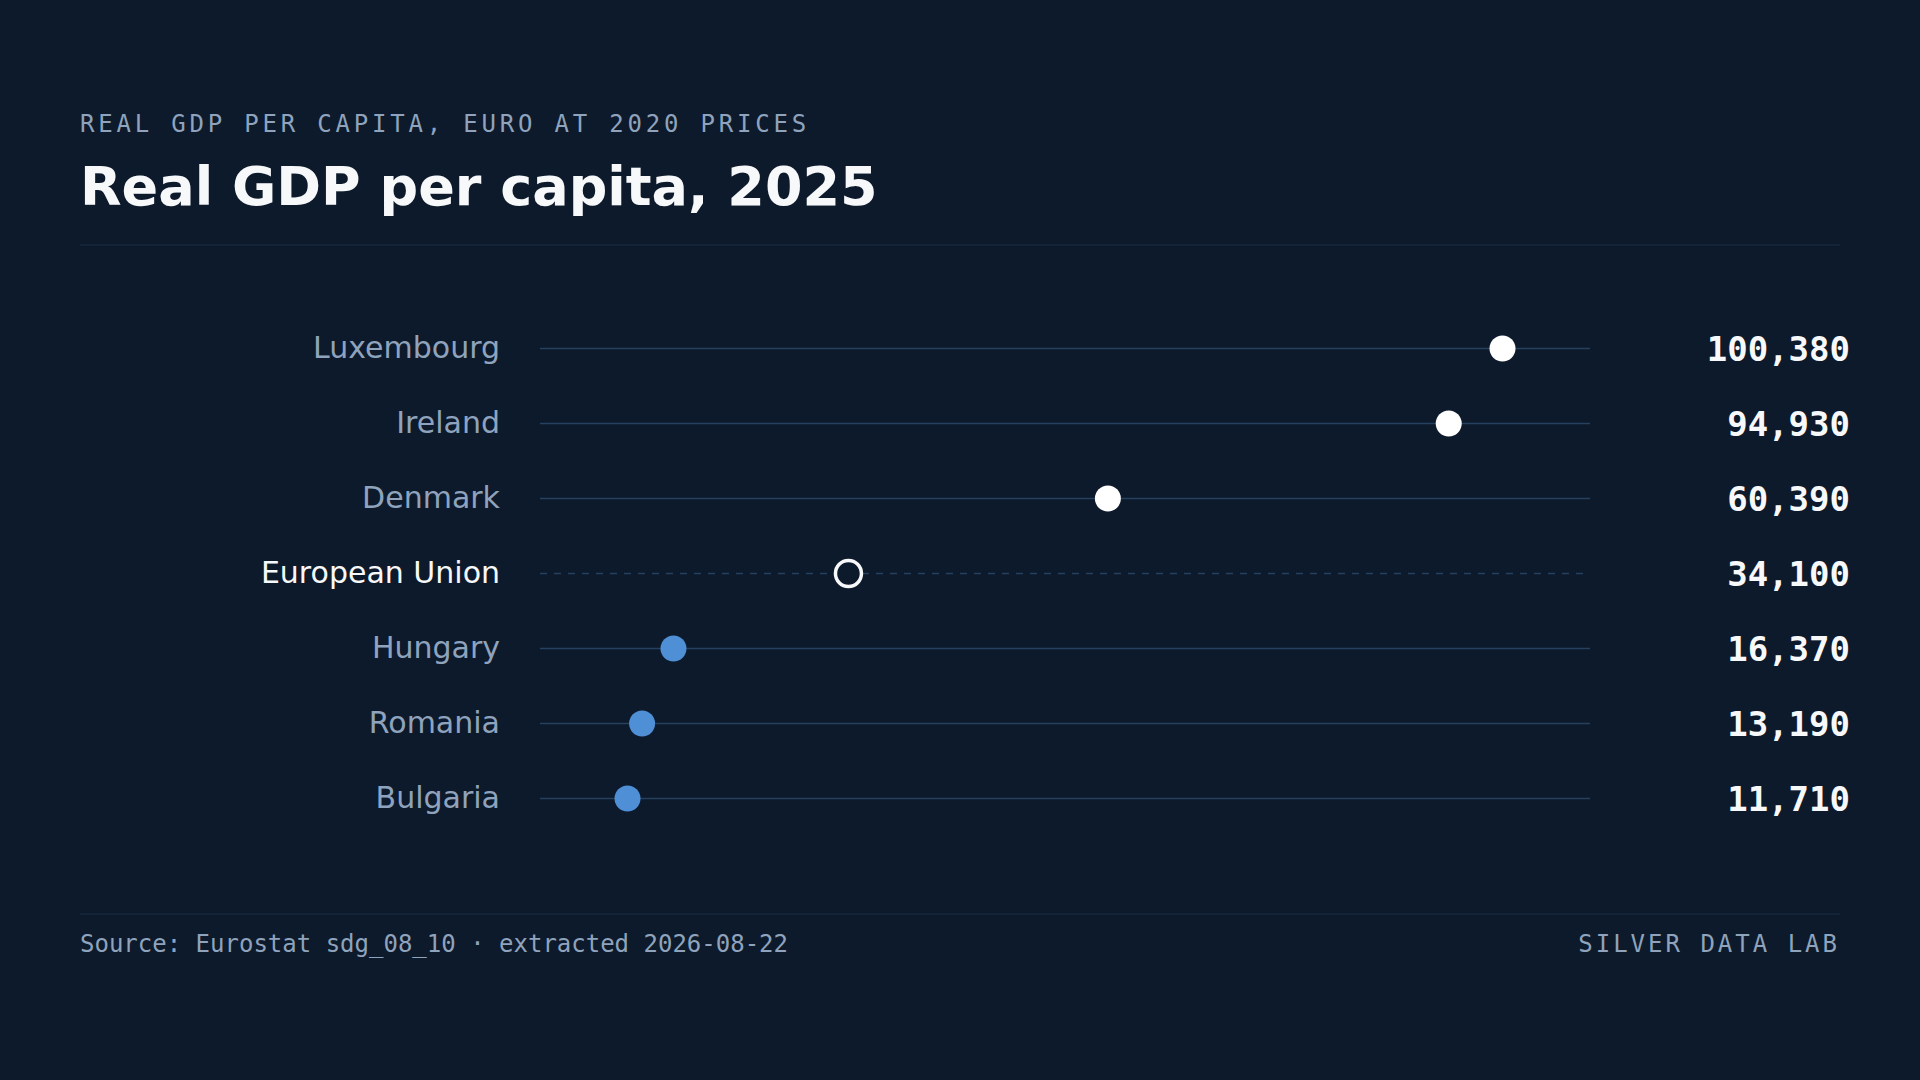
Bulgaria's GDP per Person Is About a Third of the EU Average
EU real GDP per capita was 34,250 euro in 2025, at 2020 prices.
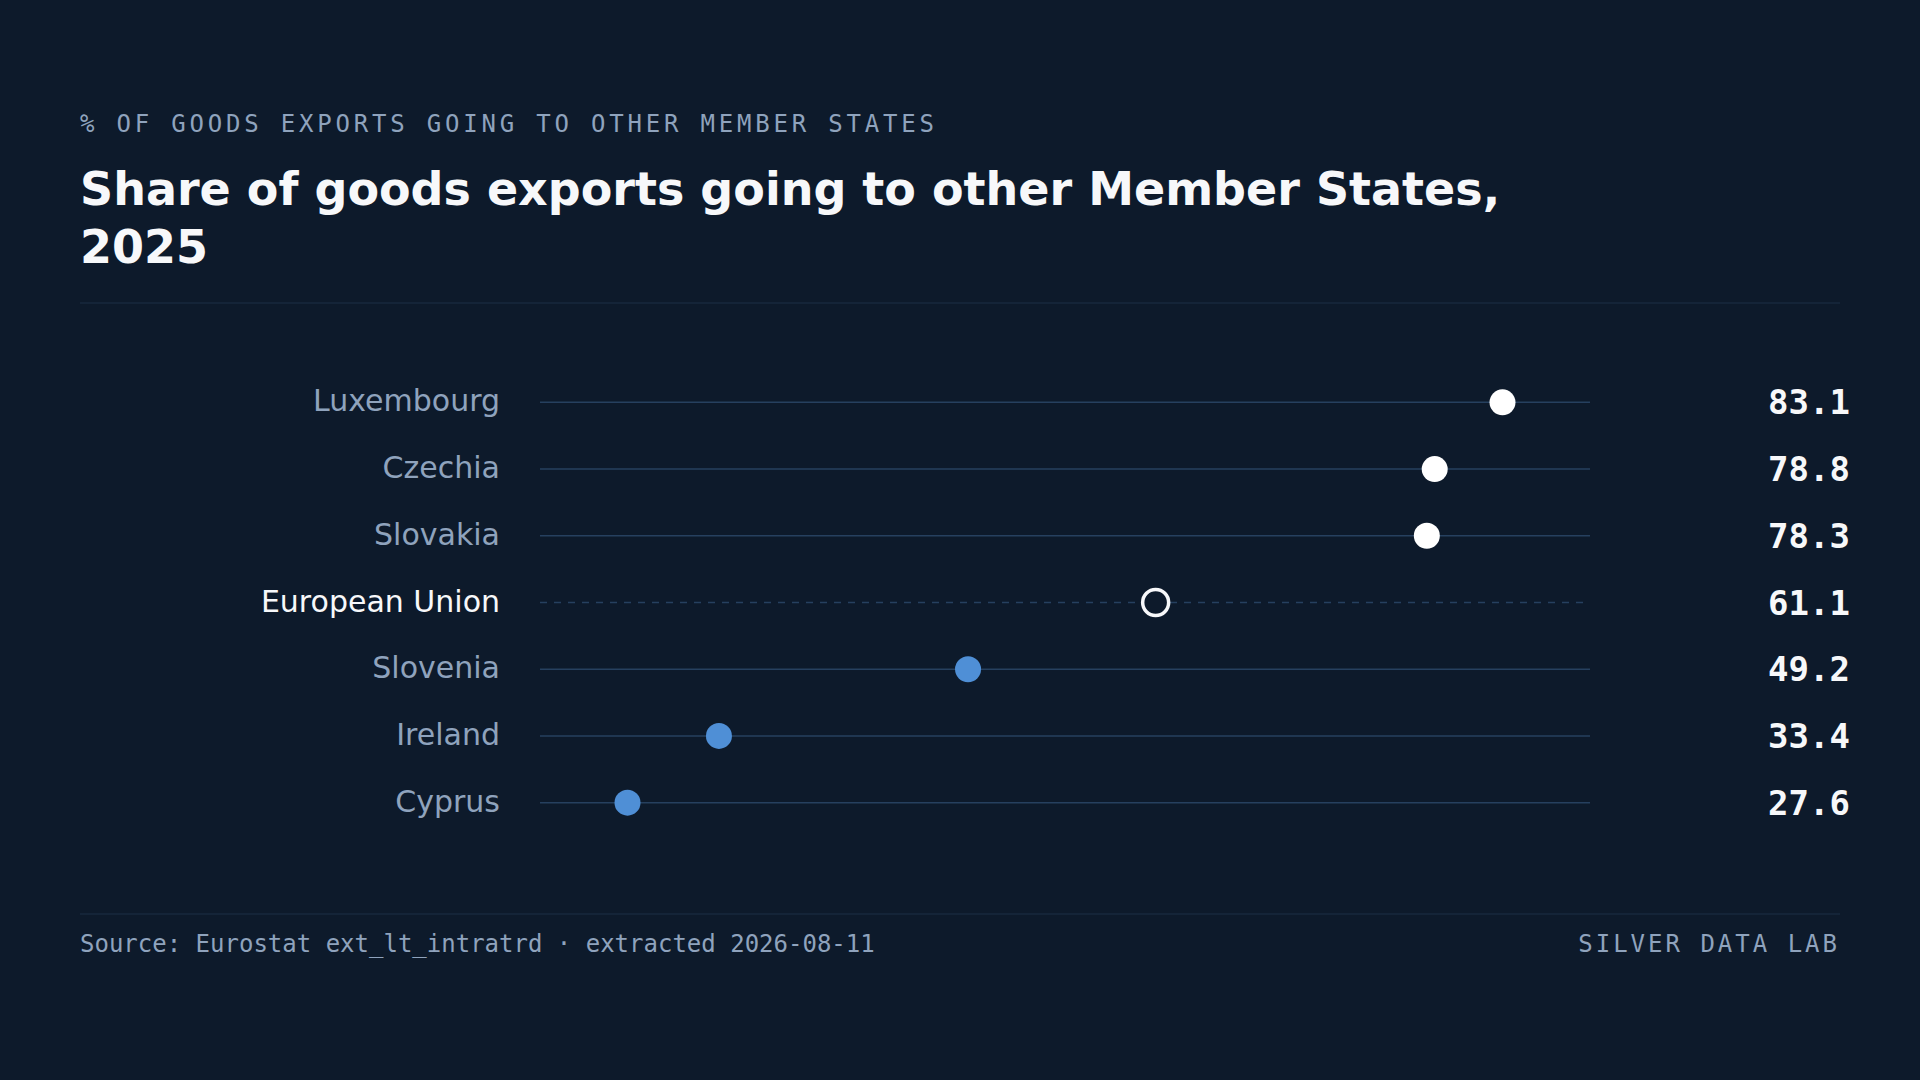
EU Countries Sell 61.1% of Their Goods Exports to Each Other
61.1% of the goods exported by EU Member States in 2025 went to other Member States.
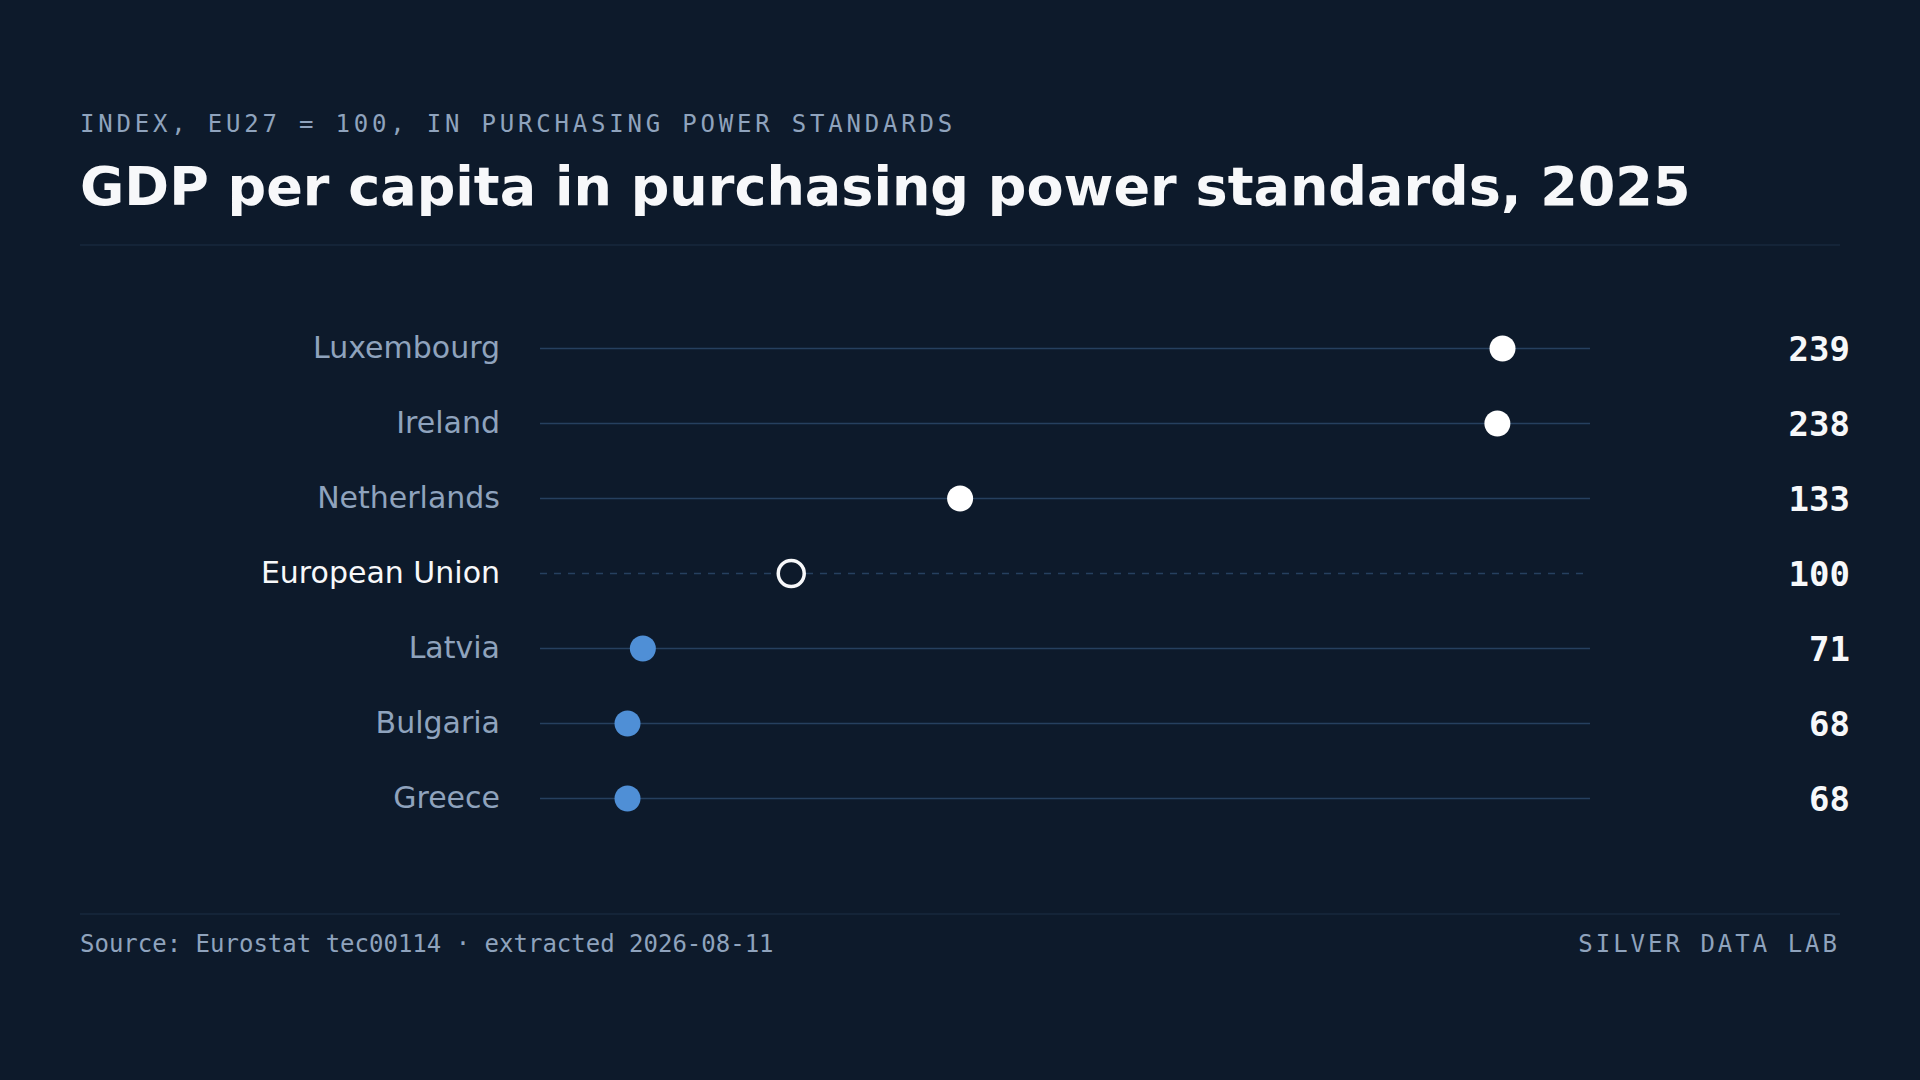
GDP per Head Makes Luxembourg and Ireland Look Richer Than They Are
Luxembourg records 239 and Ireland 238 against an EU average of 100 — more than double the Union's output per head.