EU Jobless Figures Miss Nearly Half of People Who Want a Job or More Hours
Silver Data Lab Research Desk · Statistical analysis · Published on 14 June 2026
This study is open to members only
Its sources, filters and extraction date are declared above, as they are for every study. Sign in to read the analysis in full.
- Data source
- Eurostat
- Reference period
- 2025
- Last updated
- 11 October 2026
Re-checked against the source on 11 September 2026. No value in its datasets has moved between the snapshots we hold. Every revision we have observed →
Key estimates
- 23.9 million people aged 20 to 64 in the EU wanted more paid work in 2025 than they were able to get — 11.0% of the extended labour force.
- Only 12.2 million of them were unemployed. The unemployment count captures slightly over half of the total.
- 5.0 million were available to work but not looking, and 5.0 million were working part time while wanting more hours. Neither group appears in the unemployment rate.
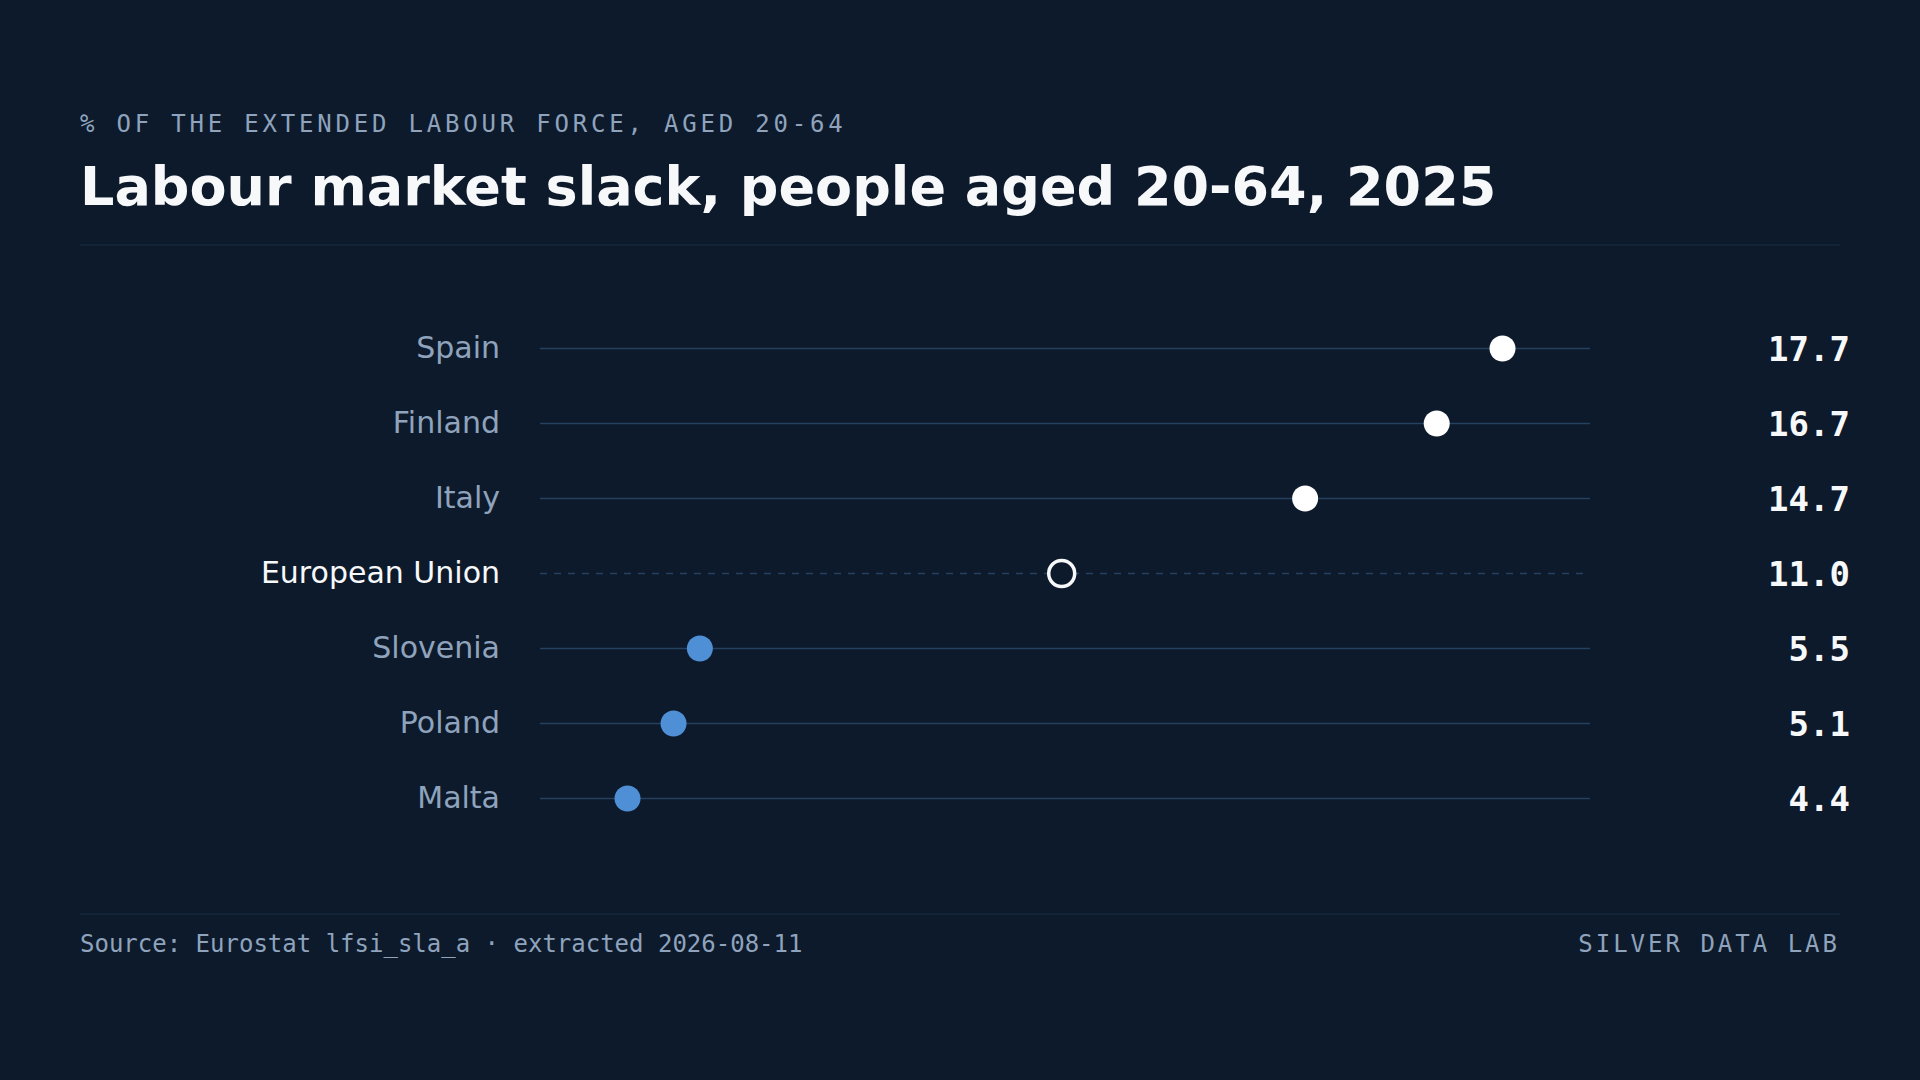
- Spain records the widest slack at 17.7%, followed by Finland at 16.7% and Italy at 14.7%. Malta is lowest at 4.4%.
- The distance between the widest and narrowest national rate is 13.3 percentage points — wider, proportionally, than the spread in employment rates.
A headline number that leaves half the story out
The unemployment rate is the most quoted labour market statistic in Europe, and it is built on a demanding definition. To be counted as unemployed, a person must be without work, available to start within two weeks, and have actively looked for a job in the previous four weeks. Fail any one of those three tests and you disappear from the number, however much you want a job.
Eurostat publishes a second measure that keeps those people visible. Labour market slack adds three groups to the unemployed: people available to work who are not currently searching, people searching who are not immediately available, and people already working part time who want more hours. Together they describe the unused capacity of the labour market rather than the subset of it that satisfies a survey definition.
In 2025 the difference between the two measures was 11.7 million people.
What the missing half is made of
Across the EU, 23.9 million people aged 20 to 64 fell into labour market slack in 2025, against 12.2 million counted as unemployed. The unemployed are 50.9% of the total — slightly over half.
The largest missing group is people available to work but not looking, at 5.0 million, or 21.0% of slack. This is the group the unemployment rate is structurally blind to: discouragement, caring responsibilities and areas with no realistic vacancies all produce people who would take a job but have stopped the formal search that the definition requires.
Almost exactly as large is underemployment: 5.0 million people already in work, on part-time contracts, who want more hours. They are employed by every official measure, and they appear in the employment rate as fully as anyone working forty hours.
The smallest group, 1.7 million, is people looking for work but not available to start within two weeks — often because a notice period, a course or a caring arrangement stands in the way.
Where slack is widest
Spain records the highest rate in the Union at 17.7% of its extended labour force, ahead of Finland at 16.7% and Italy at 14.7%. At the other end sit Malta at 4.4%, Poland at 5.1% and Slovenia at 5.5%.
The 13.3 point distance between Spain and Malta is the more striking figure once it is read proportionally: the widest national slack rate is four times the narrowest. National labour markets in the Union differ less in whether people hold jobs than in how much unmet demand for work sits behind the ones they hold.
Finland's position is the one that resists the obvious reading. It combines a high slack rate with an employment rate above the EU average, which rules out the simple story that slack tracks weak employment. A labour market can put a large share of its population in work and still leave a large share of them wanting more of it.
Labour market slack, people aged 20-64, 2025
| Country | % of extended labour force | Gap to EU averagepercentage points, derived |
|---|---|---|
| Spain | 17.7d | +6.7 |
| Finland | 16.7 | +5.7 |
| Italy | 14.7 | +3.7 |
| European Unionaggregate | 11.0 | — |
| Slovenia | 5.5 | −5.5 |
| Poland | 5.1 | −5.9 |
| Malta | 4.4 | −6.6 |
Flags carried by the source on these values: d definition differs
This table as data: CSV · JSON
Every Member State for this indicator+
Members see every Member State for this indicator here, not only the rows the ranking prints. Become a Member
What these figures cannot tell you
- Slack and unemployment use different denominators
- The unemployment rate is expressed as a share of the labour force. Labour market slack is expressed as a share of the extended labour force, which additionally includes the people available but not seeking and those seeking but not available. The two rates are therefore not directly subtractable, and this study compares the two measures as counts of people rather than as rates.
- The four components are counts of people, not of hours
- Underemployed part-time workers are counted as whole persons, exactly as the unemployed are, even though the shortfall they represent is a number of hours rather than a whole job. Slack should be read as a headcount of people whose working time falls short of what they want, not as an estimate of unused full-time equivalents.
- Results before and after 2021 are not fully comparable
- A break in the series falls on 1 January 2021 with the introduction of the new EU Labour Force Survey framework, which revised the treatment of several of these categories. Comparisons that span that date should be read with that discontinuity in mind.
- Components are rounded independently
- The four components published in thousands sum to 23,862 against a published total of 23,863. The difference is rounding in the source, not a missing category, and is reproduced here rather than silently corrected.
Frequently asked questions
- What is labour market slack?
- The unmet demand for paid work in an economy. Eurostat defines it as the sum of four groups: the unemployed, people available to work but not currently looking, people looking but not available to start within two weeks, and part-time workers who want more hours. In the EU in 2025 it covered 23.9 million people aged 20 to 64, or 11.0% of the extended labour force.
- How is slack different from unemployment?
- Unemployment is one of its four components, and in 2025 it was slightly over half of the total: 12.2 million of 23.9 million. To count as unemployed a person must be without work, available within two weeks and actively searching. The other 11.7 million fail at least one of those tests while still wanting more paid work.
- Which EU country has the most labour market slack?
- Spain, at 17.7% of its extended labour force in 2025, ahead of Finland at 16.7% and Italy at 14.7%. The lowest rates were in Malta at 4.4%, Poland at 5.1% and Slovenia at 5.5%.
- Are part-time workers really counted as underused labour?
- Only those who say they want more hours than they currently work. In 2025 that was 5.0 million people in the EU, or 20.9% of total slack. They are counted as employed in every other statistic, including the employment rate, which is why a country can report strong employment and still carry substantial unmet demand for work.
Methodological note
Labour market slack is the sum of four mutually exclusive groups: unemployed persons, persons available to work but not seeking, persons seeking work but not available, and underemployed persons working part time. The rate is expressed against the extended labour force, which is the labour force plus the two groups at the margin of it.
The age band is 20 to 64 throughout, matching the band used across this site so that slack, employment and unemployment can be read against one another.
Component shares quoted in the text — for example the 50.9% of slack accounted for by the unemployed — are derived by Silver Data Lab from the published counts. Eurostat publishes the counts, not the shares.
Source data
The underlying series can be inspected and re-downloaded from the Eurostat data browser. The filters below are the ones applied.
Labour market slack by sex and age — annual data
lfsi_sla_a
- Filters applied:
- freq=A · wstatus=SLACK, UNE, NSEEK_AVL, SEEK_NAVL, UEMP_PT · age=Y20-64 · sex=T · unit=PC_ELF, THS_PER
- Extracted:
- 2026-09-11
- Source last updated:
- 2026-09-10
Download the data
The data the study you have just read is built on, exactly as it was downloaded and archived.
Yours as a Member.
Data downloadable by Members
How to cite
Record the vintage as well as the study: the figures on this page are the ones extracted on the dates below.
Silver Data Lab Research Desk (2026). EU Jobless Figures Miss Nearly Half of People Who Want a Job or More Hours. Silver Data Lab, published 14 June 2026, last updated 11 October 2026. https://www.silverdatalab.com/studies/labour-market-slack-in-the-eu
- Data: Eurostat, Labour market slack by sex and age — annual data (lfsi_sla_a), filters freq=A, wstatus=SLACK, UNE, NSEEK_AVL, SEEK_NAVL, UEMP_PT, age=Y20-64, sex=T, unit=PC_ELF, THS_PER; extracted 2026-09-11; source last updated 2026-09-10. https://doi.org/10.2908/lfsi_sla_a
Silver Data Lab's analysis is licensed CC BY 4.0. The statistics remain their publisher's and keep its terms of reuse.
Ask the research desk
A question about this study — a definition, a filter, a break in the series, what the figures can and cannot support — answered by the desk that made the extraction.
Members can write to the research desk
Other studies on the same dataset
Studies where the same country leads or trails
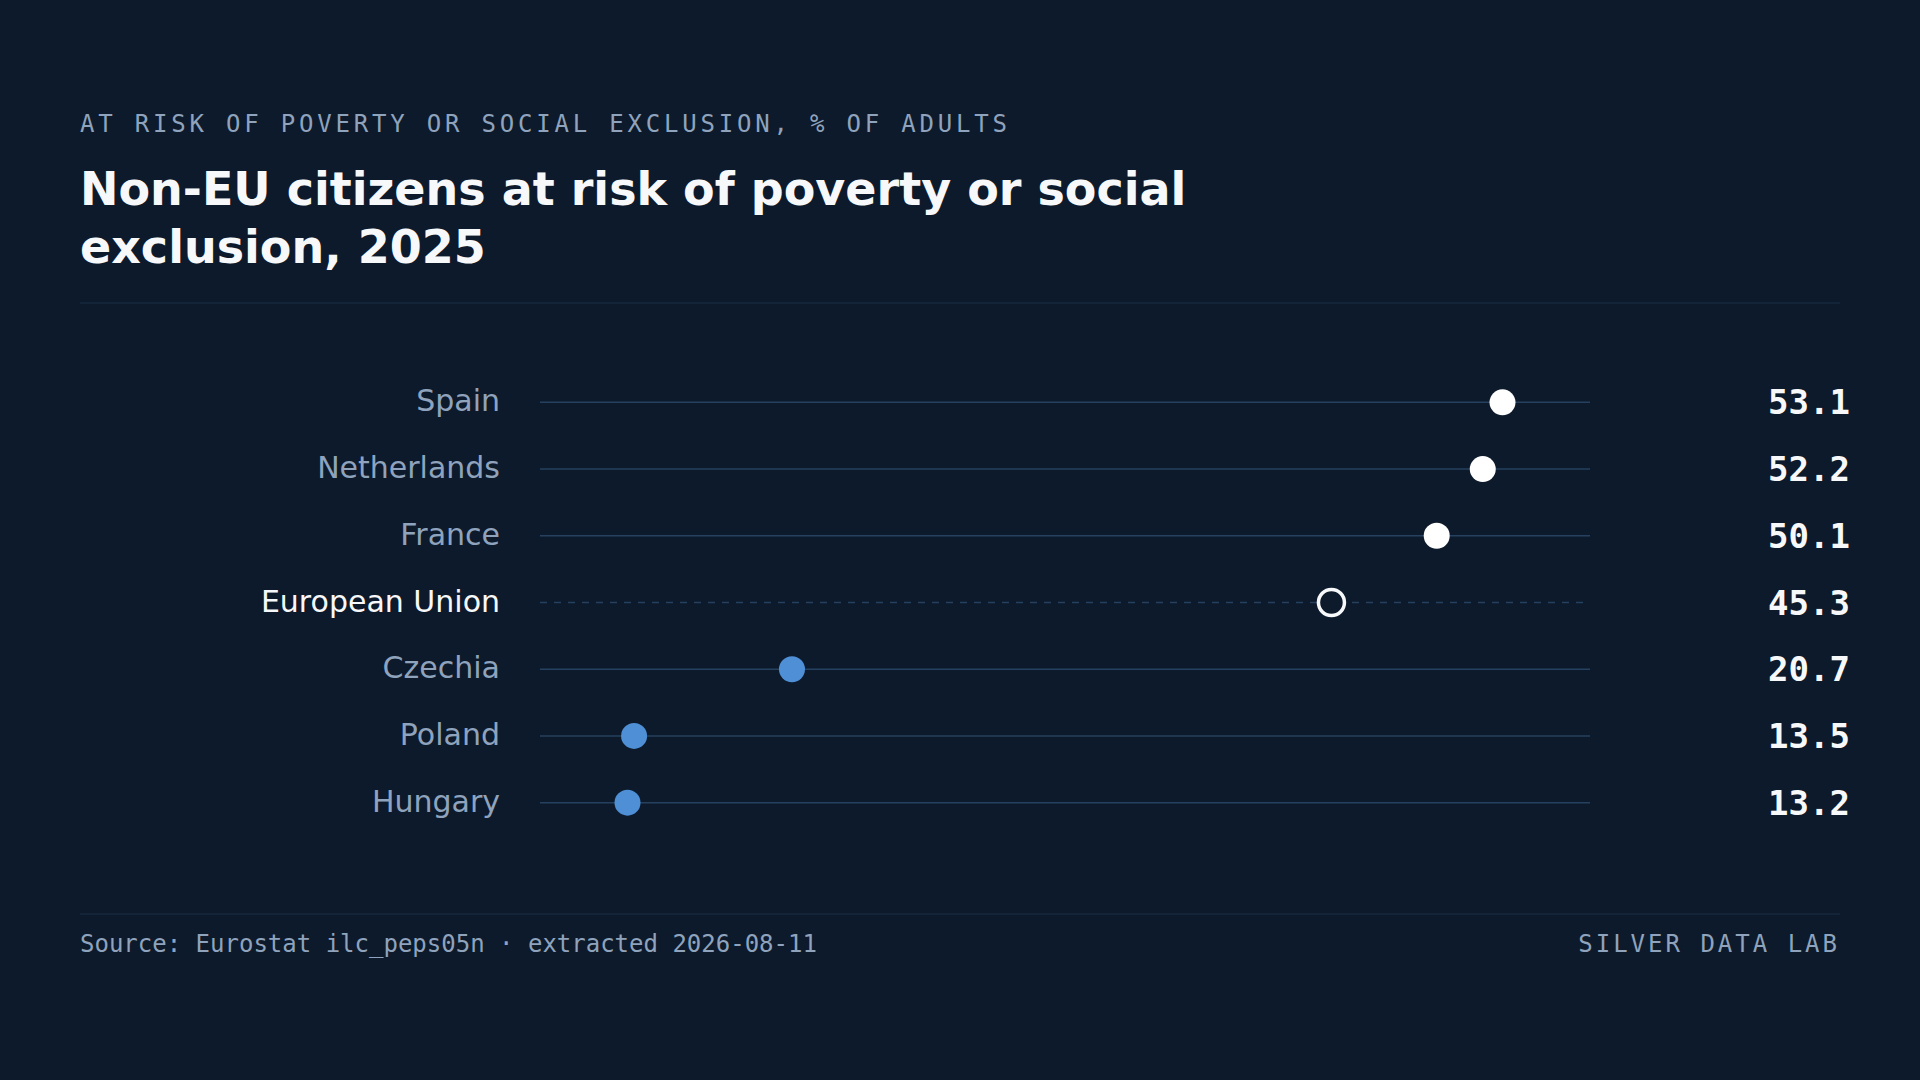
52.2% of Adult Non-EU Citizens in the Netherlands Risk Poverty or Exclusion
45.3% of non-EU citizens aged 18 and over in the EU were at risk of poverty or social exclusion in 2025, against 18.2% of nationals.
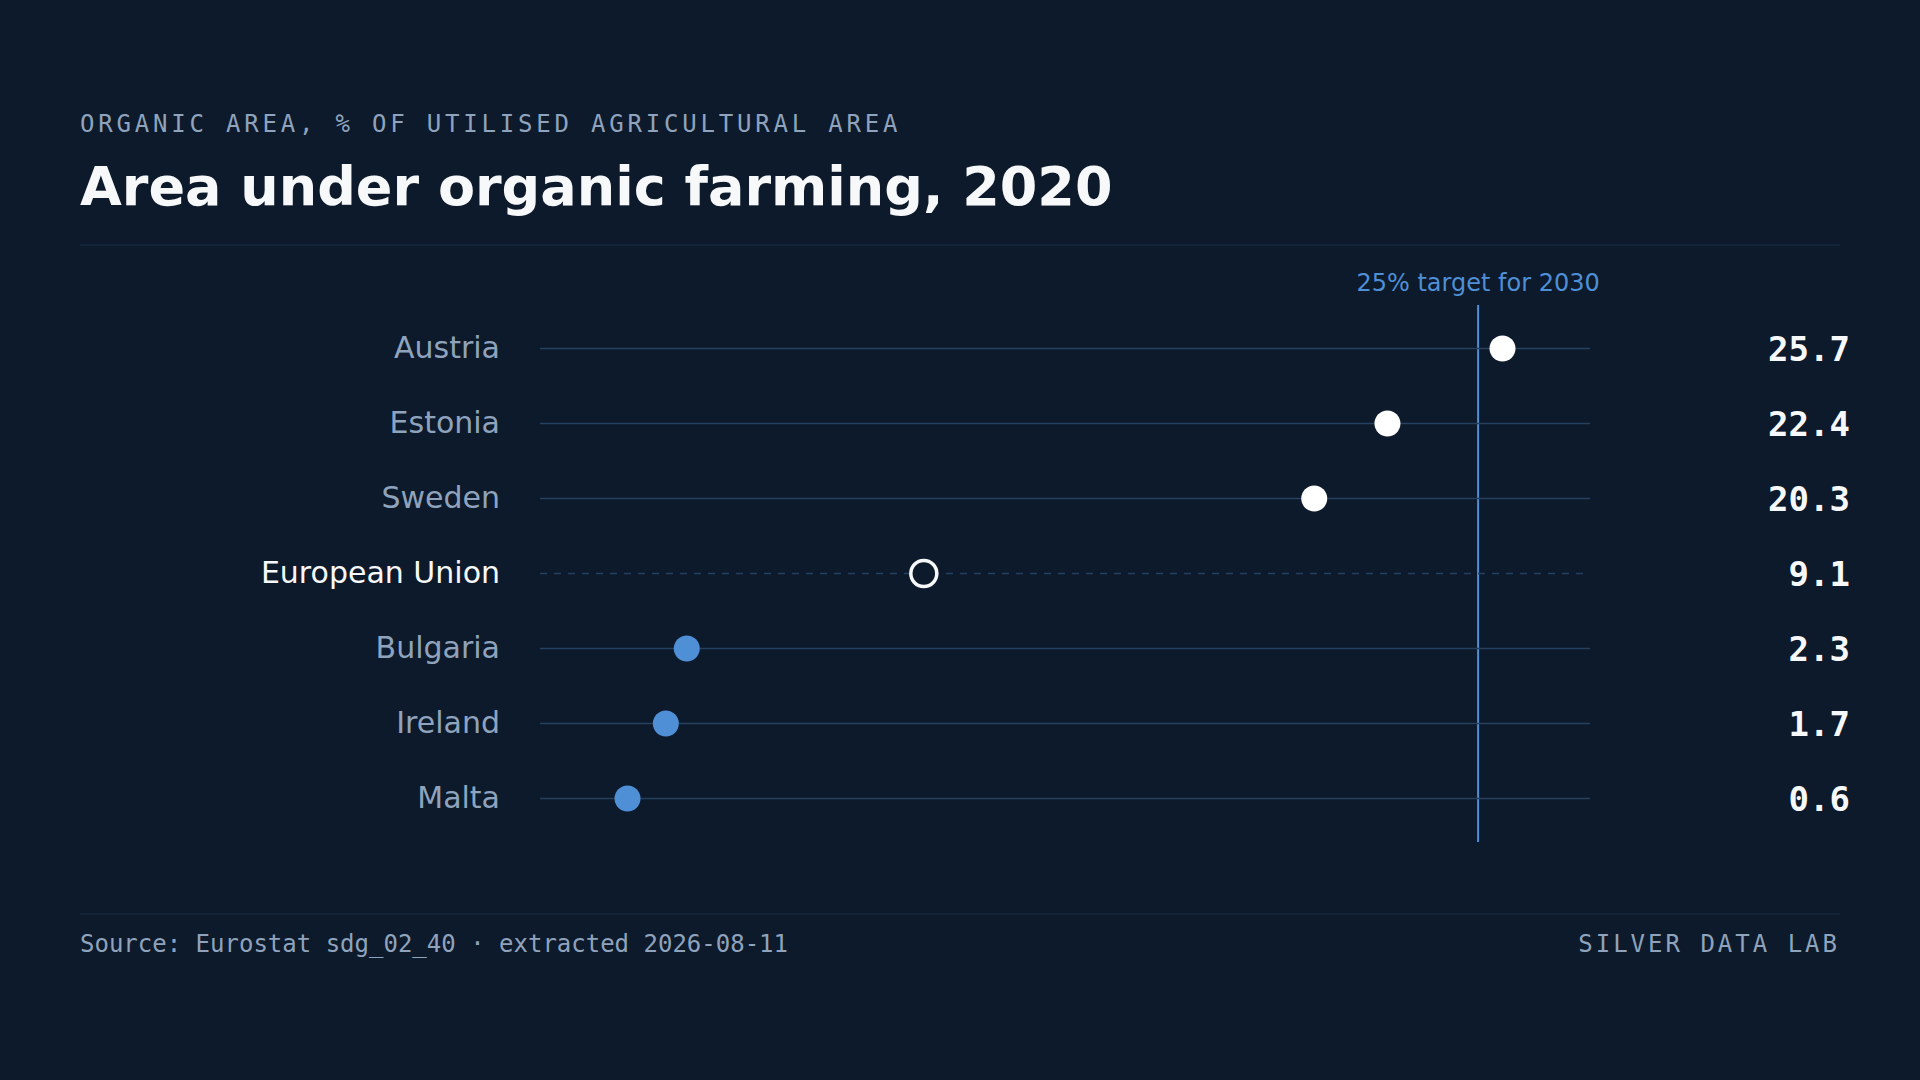
Austria Already Farms a Quarter of Its Farmland Organically
9.1% of the EU's utilised agricultural area was under organic management in 2020, against a target of 25% by 2030.
In No EU Country Are Enough Babies Born to Replace Their Parents
The EU total fertility rate was 1.34 children per woman in 2024, against the 2.1 conventionally taken as replacement level.