Wood and Similar Solid Fuels Are Still the EU's Largest Renewable Source
Silver Data Lab Research Desk · Statistical analysis · Published on 04 October 2026
This study is open to members only
Its sources, filters and extraction date are declared above, as they are for every study. Sign in to read the analysis in full.
- Data source
- Eurostat
- Reference period
- 2024
- Last updated
- 11 October 2026
Re-checked against the source on 04 October 2026. No value in its datasets has moved between the snapshots we hold. Every revision we have observed →
Key estimates
- Solid biomass supplied 34.3% of the renewable energy counted across the EU in 2024, almost twice the 17.8% from wind; hydropower supplied 12.4% and solar photovoltaics 10.8%.
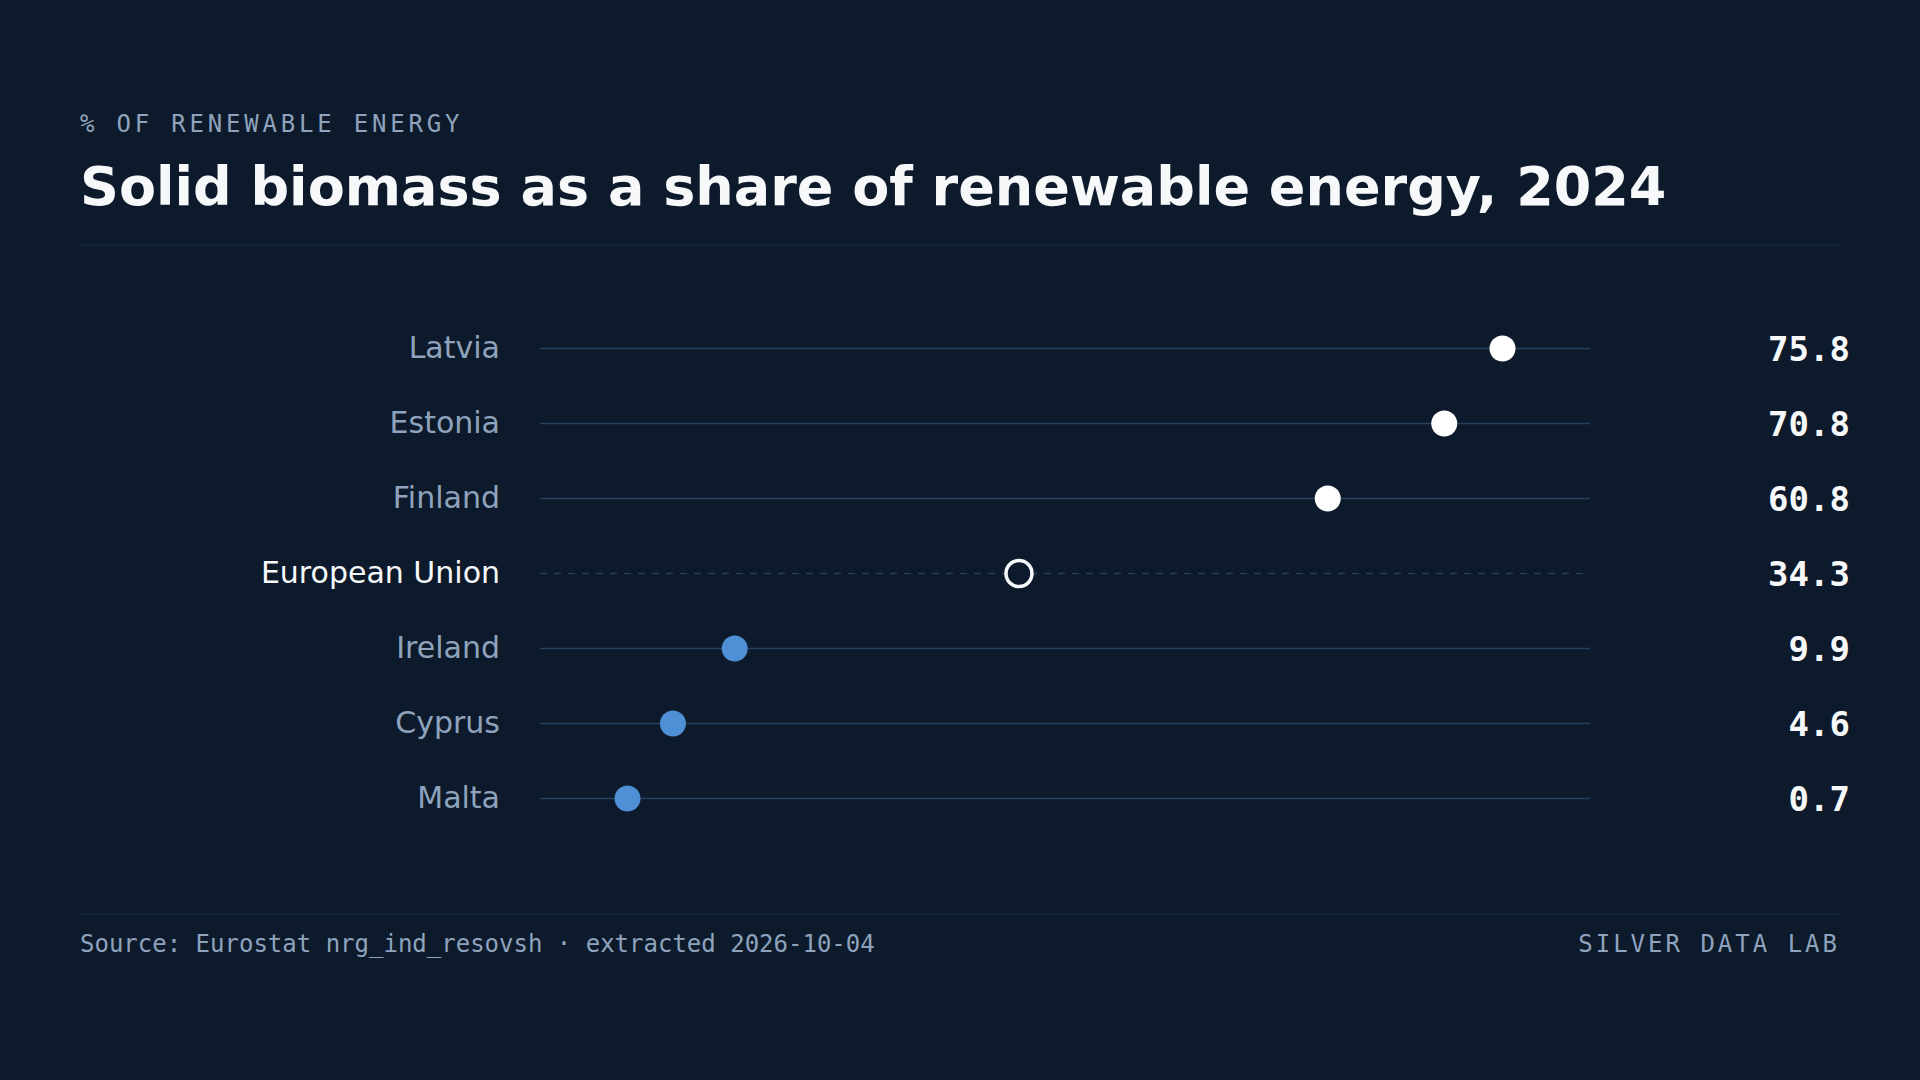
- Solid biomass is the largest renewable source in 20 of the 27 Member States and more than half of the renewable total in nine, led by Latvia at 75.8%.
- Between 2021 and 2024 the solid biomass the EU counted fell by 7.9%, from 90.3 to 83.2 million tonnes of oil equivalent, while solar photovoltaics grew by 90.9%.
- Solar photovoltaics, wind and heat pumps added 25.3 million tonnes of oil equivalent between them, more than the 20.1 million by which the whole renewable total grew.
- Wind is the leading source in five Member States, Ireland most of all at 53.4%; solar photovoltaics leads in Cyprus and renewable cooling in Malta.
What the renewable total is made of
Each Member State reports how much renewable energy it counts toward the EU's renewable energy target, and Eurostat splits that amount by the source that produced it: wind, sunlight, rivers, heat drawn from the air and the ground, and fuels made from plants and waste. This study reads that split. Its percentages are shares of the renewable total, so they describe what a country's renewable energy consists of rather than how much of its energy is renewable.
Quantities are expressed in tonnes of oil equivalent, a common yardstick that converts electricity, heat and fuel into the energy released by burning that weight of crude oil.
Solid biomass comes first
In 2024 solid biomass supplied 34.3% of the renewable energy counted across the EU. The category gathers solid fuels of plant and animal origin: fuelwood, wood chips, pellets and other wood residues, black liquor from pulp mills, bagasse left over from sugar cane, animal waste, other plant material and the renewable part of industrial waste.
Wind followed at 17.8%, hydropower at 12.4% and solar photovoltaics, the panels that turn sunlight into electricity, at 10.8%. Heat pumps, which take heat from the air, the ground or water, contributed 8.0%, and biofuels such as biodiesel and bioethanol 7.4%. Biogases, the gas given off as manure, sewage sludge and other organic matter ferments, supplied 4.0%; renewable municipal waste, the biodegradable part of the rubbish that incinerators burn for energy, 2.3%; and solar thermal collectors 1.3%. Geothermal energy, renewable cooling, bioliquids (liquid fuels from biomass burned for heat and power rather than in vehicles), charcoal and the energy of tides and waves make up the rest, each below 0.7%.
Set against one another, those published shares put solid biomass at almost twice the size of wind, and above wind and hydropower taken together. Added before rounding, the two come to 30.1%, a sum computed here.
Where biomass leads
Solid biomass is the largest renewable source in 20 of the 27 Member States. In nine of them it supplies more than half of the renewable total: Latvia at 75.8%, Estonia at 70.8%, Finland at 60.8%, Lithuania at 60.0%, Czechia at 59.8%, Slovakia at 54.0%, Croatia at 52.9%, and Hungary and Poland at 51.8% each.
That group is geographically compact. It is the three Baltic states and Finland, and a band of central European countries running from Poland down to Croatia.
Biomass also comes first in Austria at 41.5%, Slovenia at 39.7% and Sweden at 39.6%, but in all three it shares the load with rivers. Hydropower supplies 32.6% of Austrian renewable energy, 32.7% of Slovenian, the highest hydro share in the Union, and 26.2% of Swedish.
Where wind, sunlight or cooling come first
Seven Member States put another source at the top. In five it is wind. Ireland draws 53.4% of its renewable energy from wind, which makes it the only Member State where any source other than biomass passes half. The Netherlands follows at 32.1%, Germany at 27.4%, Spain at 26.3% and Greece at 23.8%.
Cyprus leads with solar photovoltaics at 25.1%, with solar thermal collectors close behind at 20.9%. Malta is the most unusual case: its leading source is renewable cooling, the category that counts renewable energy used to cool buildings and processes, at 42.2% of its renewable total.
These are also the countries where biomass counts least. Ireland takes 9.9% of its renewable energy from solid biomass, Cyprus 4.6% and Malta 0.7%, the only three Member States below 10%.
Solar photovoltaics draws almost the reverse map. Its share is highest in Cyprus at 25.1%, Hungary at 24.8% and Malta at 23.0%, and lowest in Latvia at 2.5%, Sweden at 1.6% and Finland at 0.6%. Hungary is the exception to that pattern. It is the only Member State where solid biomass supplies more than half of renewable energy and solar photovoltaics more than a fifth, at 51.8% and 24.8%.
What changed between 2021 and 2024
The dataset begins in 2021. Over the three years to 2024 the EU's renewable total rose from 222.4 to 242.6 million tonnes of oil equivalent, an increase of 20.1 million or 9.1%. Solid biomass moved the other way, from 90.3 to 83.2 million, a fall of 7.1 million or 7.9%. These changes are computed by Silver Data Lab from the published quantities in thousand tonnes, before rounding.
Three sources carried the growth. Solar photovoltaics rose from 13.7 to 26.1 million tonnes, up 90.9%, so it nearly doubled. Wind rose by 23.2% to 43.1 million and heat pumps by 32.1% to 19.5 million. Together they added 25.3 million tonnes, more than the increase in the total, which is arithmetically possible only because biomass was shrinking at the same time. Hydropower was almost flat, up 0.4%.
Six sources each supply more than 7% of the EU's renewable energy, and solid biomass is the only one of them whose quantity fell. Its share fell faster than its quantity, from 40.6% to 34.3%, because the total around it was growing.
The same movement shows up country by country. The biomass share of renewable energy fell in 25 of the 27 Member States, held at 9.9% in Ireland and rose only in Luxembourg, from 35.8% to 41.9%. The steepest falls in share were in Poland, from 68.1% to 51.8%, Hungary, from 66.2% to 51.8%, and Lithuania, from 73.8% to 60.0%. In Lithuania the quantity of biomass in fact edged up; its share dropped because the country's renewable total grew much faster. Measured as a quantity, solid biomass fell in 18 Member States.
Three Member States changed their leading source along the way. In Germany biomass came first in 2021 and 2022, and wind in 2023 and 2024. In Cyprus solar thermal collectors led until 2023 and photovoltaics overtook them in 2024, while Malta's lead passed from photovoltaics in 2021 to renewable cooling from 2022 onwards.
What the mix does not show
A large biomass share says nothing on its own about how much renewable energy a country uses. The companion study on this site ranks Member States by the renewable share of their whole energy consumption; this one asks what that renewable energy is. A country can lean heavily on biomass with a large renewable share or a small one, and the percentages here cannot tell the two apart.
Nor do they record causes. A mild winter that lowers the demand for heating, a pulp mill that closes and a subsidy for rooftop panels would all register the same way in these figures, and the dataset does not separate one from another.
Solid biomass as a share of renewable energy, 2024
| Country | % of renewable energy | Gap to EU averagepercentage points, derived |
|---|---|---|
| Latvia | 75.8 | +41.5 |
| Estonia | 70.8 | +36.5 |
| Finland | 60.8 | +26.5 |
| European Unionaggregate | 34.3 | — |
| Ireland | 9.9 | −24.4 |
| Cyprus | 4.6 | −29.7 |
| Malta | 0.7 | −33.6 |
This table as data: CSV · JSON
Every Member State for this indicator+
Members see every Member State for this indicator here, not only the rows the ranking prints. Become a Member
Renewable energy in the EU by source, 2024
| Country | % of renewable energy |
|---|---|
| Solid biomass | 34.3 |
| Wind | 17.8 |
| Hydropower | 12.4 |
| Solar photovoltaic | 10.8 |
| Heat pumps | 8.0 |
| Biofuels | 7.4 |
| Biogases | 4.0 |
| Renewable municipal waste | 2.3 |
| Solar thermal | 1.3 |
This table as data: CSV · JSON
Every Member State for this indicator+
Members see every Member State for this indicator here, not only the rows the ranking prints. Become a Member
Solar photovoltaics as a share of renewable energy, 2024
| Country | % of renewable energy | Gap to EU averagepercentage points, derived |
|---|---|---|
| Cyprus | 25.1 | +14.3 |
| Hungary | 24.8 | +14.0 |
| Malta | 23.0 | +12.2 |
| European Unionaggregate | 10.8 | — |
| Latvia | 2.5 | −8.3 |
| Sweden | 1.6 | −9.2 |
| Finland | 0.6 | −10.2 |
This table as data: CSV · JSON
Every Member State for this indicator+
Members see every Member State for this indicator here, not only the rows the ranking prints. Become a Member
What these figures cannot tell you
- A share of renewables, not of all energy
- Every percentage here is one source's part of a country's renewable total. Latvia's 75.8% means that three quarters of its renewable energy is solid biomass, not three quarters of all the energy it uses. A share can also fall while the quantity behind it rises, as happened to biomass in Lithuania, which is why the changes are read from the quantities as well as the shares.
- Solid biomass is reported as one category
- The dataset publishes sustainable primary solid biofuels as a single source covering fuelwood, wood residues and pellets, black liquor, bagasse, animal waste, other plant material and the renewable fraction of industrial waste. It does not say how much of that is wood. Only biomass in categories the dataset labels sustainable is counted, and the same applies to biofuels, bioliquids and biogases; the cube does not report how much fuel falls outside them.
- The parts are not an exact sum of the whole
- The renewable total is an accounting quantity built for the EU target. The dataset's own percentage for the total, which adds up the sources and the transfers between countries, reads above 100 in 2024 for Poland at 101.4, Austria at 100.5, Romania at 100.2 and the EU at 100.11, so there the parts come to slightly more than the whole; other countries do the same in earlier years. The transfers are energy credited from one country to another through statistical transfers, joint projects and joint support schemes. The largest addition in 2024 is Luxembourg's, equal to 9.2% of its renewable total, and the largest deduction Denmark's, equal to 1.4%.
- Only four years, and a different share from the EU target
- The series starts in 2021, so it cannot show whether the move away from biomass is new or continues an older trend. Its percentages are also different in kind from the renewable share the EU target is measured against, which divides renewable energy by all the energy a country consumes. That indicator is published in a separate dataset and is not restated here.
Frequently asked questions
- What is the main source of renewable energy in the EU?
- Solid biomass — fuelwood, pellets, wood residues and other solid fuels of plant or animal origin — which supplied 34.3% of the renewable energy the EU counted in 2024. Wind supplied 17.8%, hydropower 12.4% and solar photovoltaics 10.8%.
- Which EU countries rely most on biomass for renewable energy?
- Latvia, where solid biomass supplied 75.8% of renewable energy in 2024, then Estonia at 70.8% and Finland at 60.8%. Biomass is the largest renewable source in 20 of the 27 Member States and more than half of the renewable total in nine.
- Is the EU burning less biomass for energy?
- On this measure, yes. The solid biomass counted toward the EU's renewable target fell from 90.3 million tonnes of oil equivalent in 2021 to 83.2 million in 2024, a drop of 7.9% computed from the published quantities, while total renewable energy rose by 9.1%. Its share of renewables went from 40.6% to 34.3%.
- Which EU countries get the most renewable energy from solar panels?
- Cyprus, where solar photovoltaics supplied 25.1% of renewable energy in 2024, followed by Hungary at 24.8% and Malta at 23.0%. Finland has the lowest share at 0.6%. Across the EU the share was 10.8%, up from 6.2% in 2021.
Methodological note
The source divides the renewable energy each Member State counts in its overall renewable share into fourteen sources, coded under the Standard International Energy Product Classification (SIEC, the classification Eurostat uses for energy products), with wind split into onshore and offshore and heat pumps by type; a further line for blended biogases is not added into the total. It publishes each source as a quantity in thousand tonnes of oil equivalent and as a percentage of the renewable total. The study reads the energy-balance line labelled "overall target calculation without aviation cap adjustment", the line on which the quantities are published; on it, each source's published percentage equals its quantity divided by the renewable total, and the fourteen sources plus the transfers added, minus those deducted, reproduce the total's own percentage. The cube's second line, "overall target calculation adjusted", carries percentages only, on a different base, and is not used.
Values cover all 27 Member States and the EU aggregate for every year from 2021 to 2024, with no missing cell and no Eurostat flag on any value. The EU aggregate is Eurostat's own and is used as published; the rankings print values to one decimal, as the source publishes the national figures.
Silver Data Lab derived the following from the published figures: the conversion of quantities from thousand to million tonnes of oil equivalent, rounded to one decimal; the changes between 2021 and 2024 in quantities and shares, as differences and as percentage changes; the combined increase of solar photovoltaics, wind and heat pumps; the comparison of solid biomass with wind, and with wind and hydropower taken together, whose shares are added before rounding; the leading source of each Member State in each year; and the counts of Member States above or below a given share, or whose biomass share or quantity fell. Nothing else is computed.
Source data
The underlying series can be inspected and re-downloaded from the Eurostat data browser. The filters below are the ones applied.
Renewable energy sources in overall share
nrg_ind_resovsh
- Filters applied:
- freq=A · nrg_bal=GFC_E_OT_NAVICAPA · unit=PC, KTOE · time=2021, 2022, 2023, 2024
- Extracted:
- 2026-10-04
- Source last updated:
- 2026-09-23
Download the data
The data the study you have just read is built on, exactly as it was downloaded and archived.
Yours as a Member.
Data downloadable by Members
How to cite
Record the vintage as well as the study: the figures on this page are the ones extracted on the dates below.
Silver Data Lab Research Desk (2026). Wood and Similar Solid Fuels Are Still the EU's Largest Renewable Source. Silver Data Lab, published 04 October 2026, last updated 11 October 2026. https://www.silverdatalab.com/studies/renewable-energy-mix-in-the-eu
- Data: Eurostat, Renewable energy sources in overall share (nrg_ind_resovsh), filters freq=A, nrg_bal=GFC_E_OT_NAVICAPA, unit=PC, KTOE, time=2021, 2022, 2023, 2024; extracted 2026-10-04; source last updated 2026-09-23. https://doi.org/10.2908/nrg_ind_resovsh
Silver Data Lab's analysis is licensed CC BY 4.0. The statistics remain their publisher's and keep its terms of reuse.
Ask the research desk
A question about this study — a definition, a filter, a break in the series, what the figures can and cannot support — answered by the desk that made the extraction.
Members can write to the research desk
Studies where the same country leads or trails
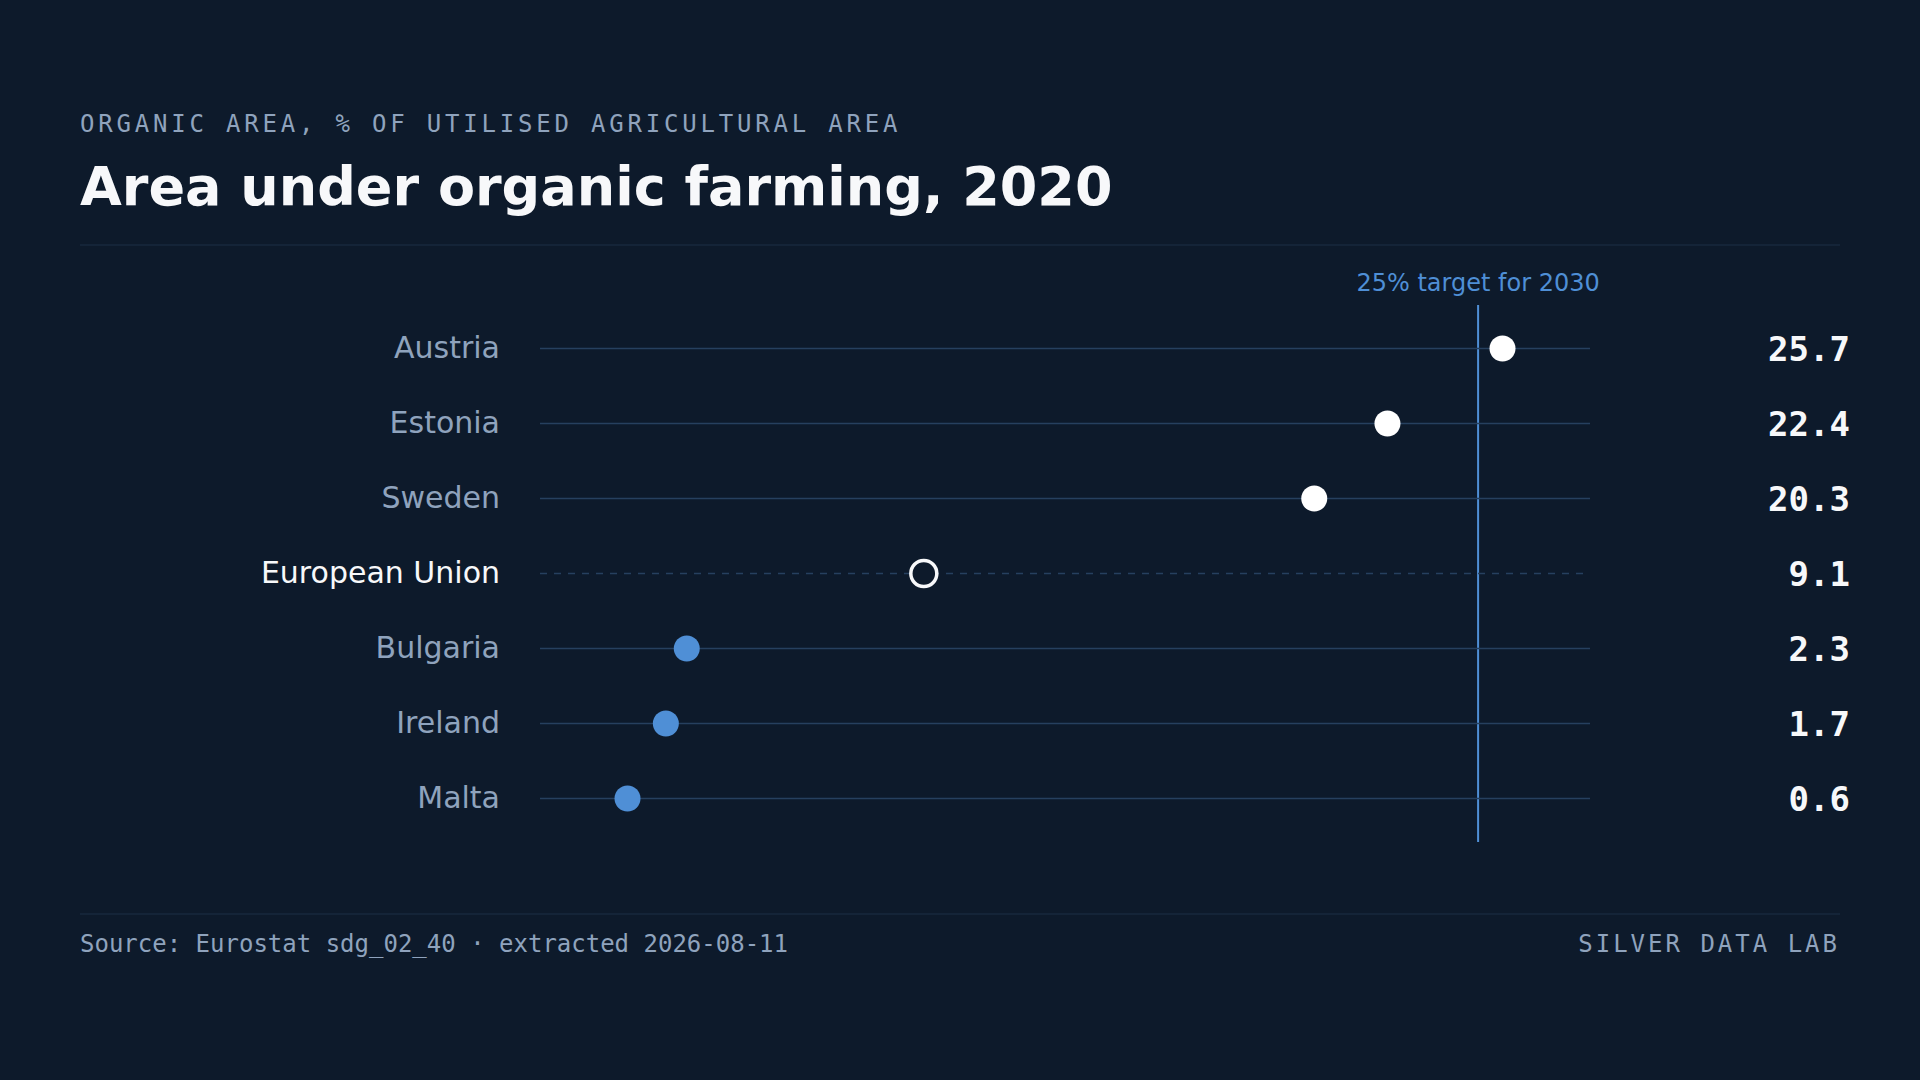
Austria Already Farms a Quarter of Its Farmland Organically
9.1% of the EU's utilised agricultural area was under organic management in 2020, against a target of 25% by 2030.
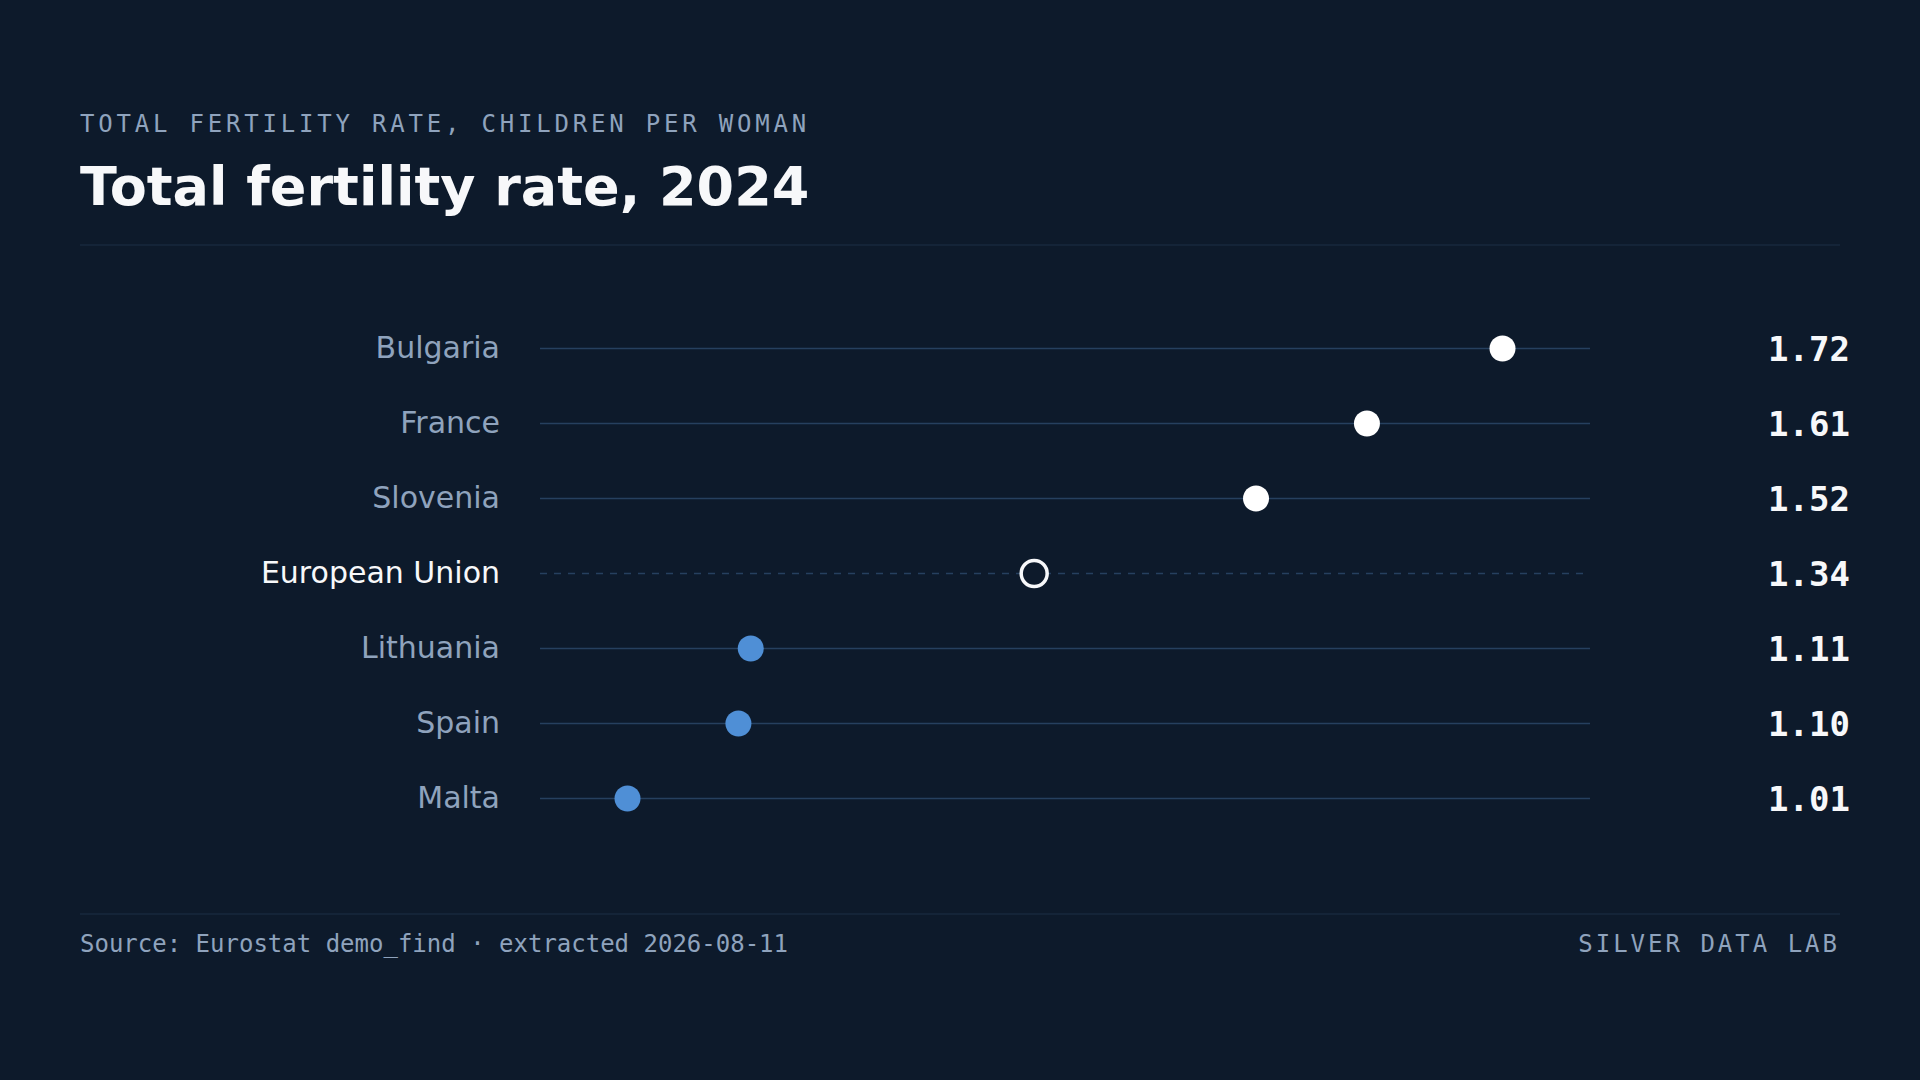
In No EU Country Are Enough Babies Born to Replace Their Parents
The EU total fertility rate was 1.34 children per woman in 2024, against the 2.1 conventionally taken as replacement level.
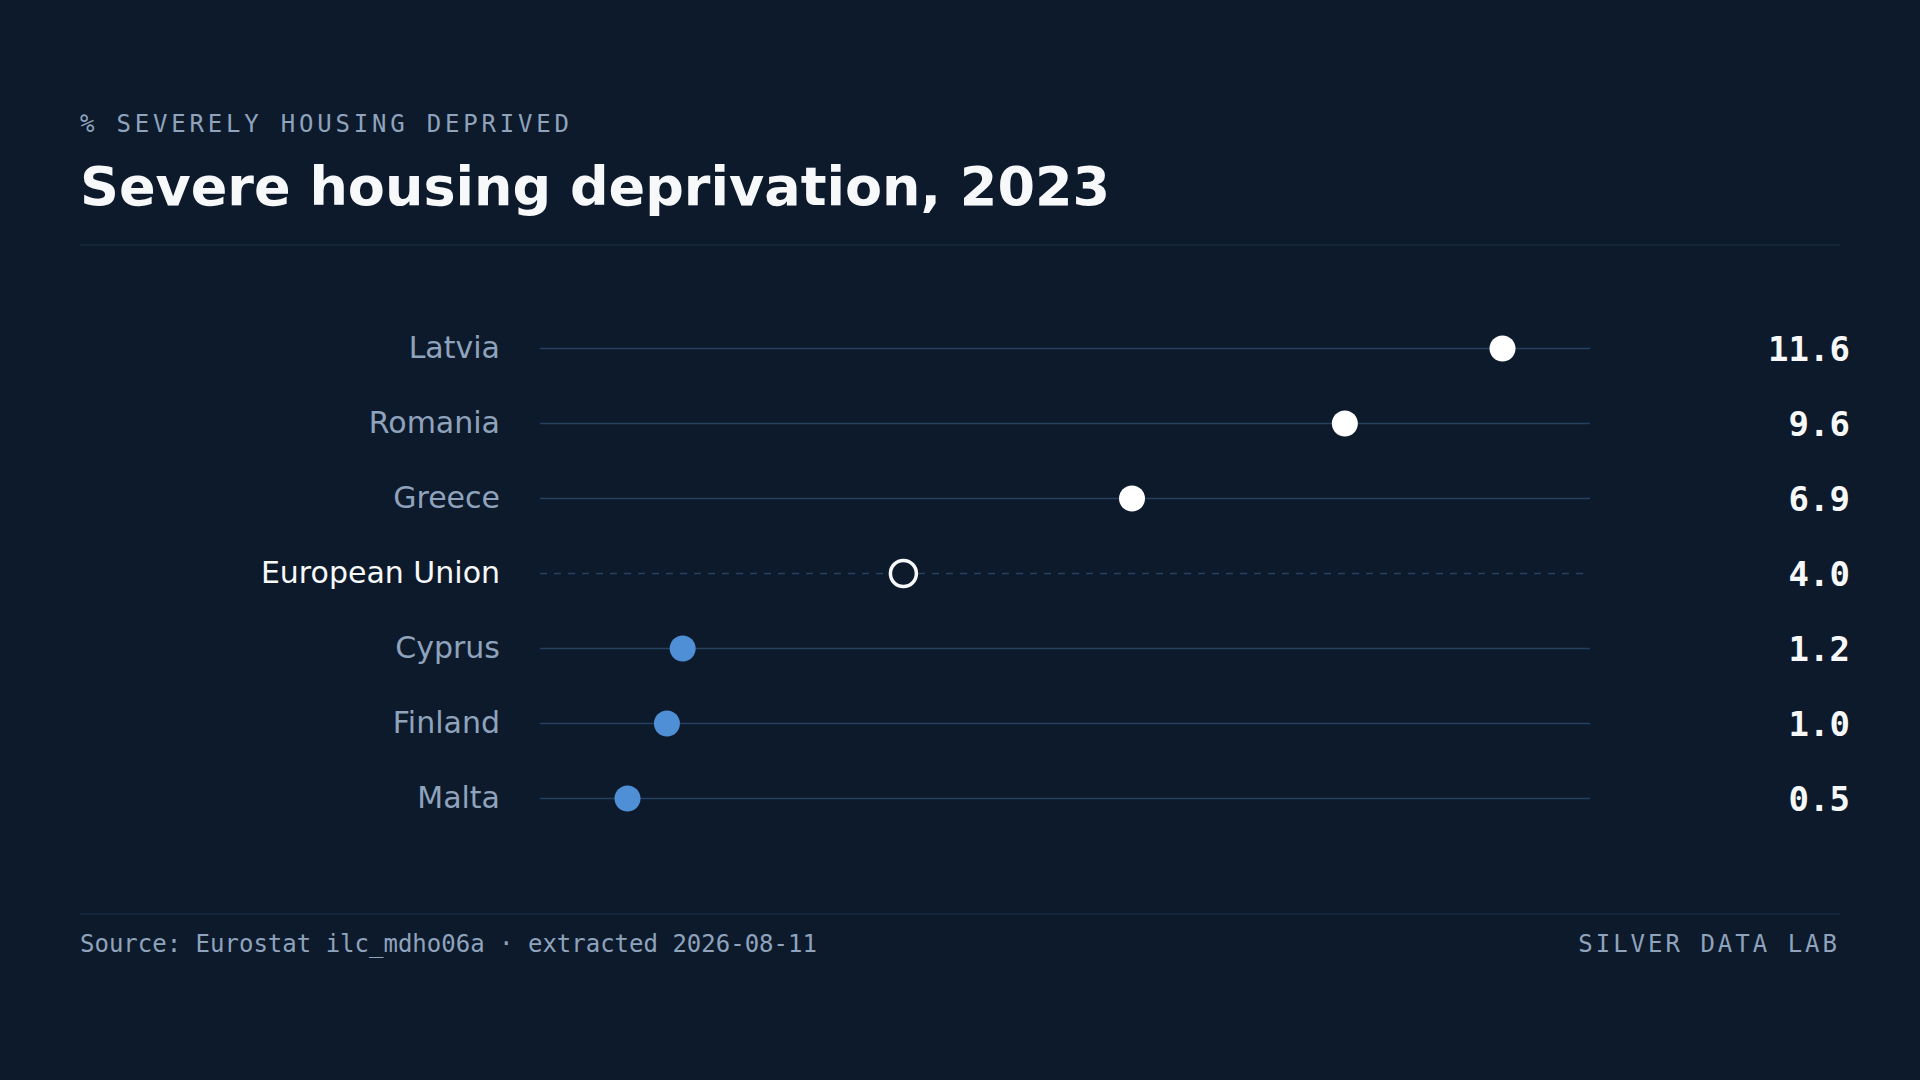
More Than One Latvian in Nine Lives in a Crowded, Run-Down Home
4.0% of the EU population lived in severely deprived housing in 2023.