Ireland and Finland Lead the EU in STEM Graduates, and Nowhere Do Women Outnumber Men
Silver Data Lab Research Desk · Statistical analysis · Published on 17 September 2026
- Data source
- Eurostat
- Reference period
- 2024
- Last updated
- 17 September 2026
Re-checked against the source on 17 September 2026. No value in its datasets has moved between the snapshots we hold. Every revision we have observed →
Key estimates
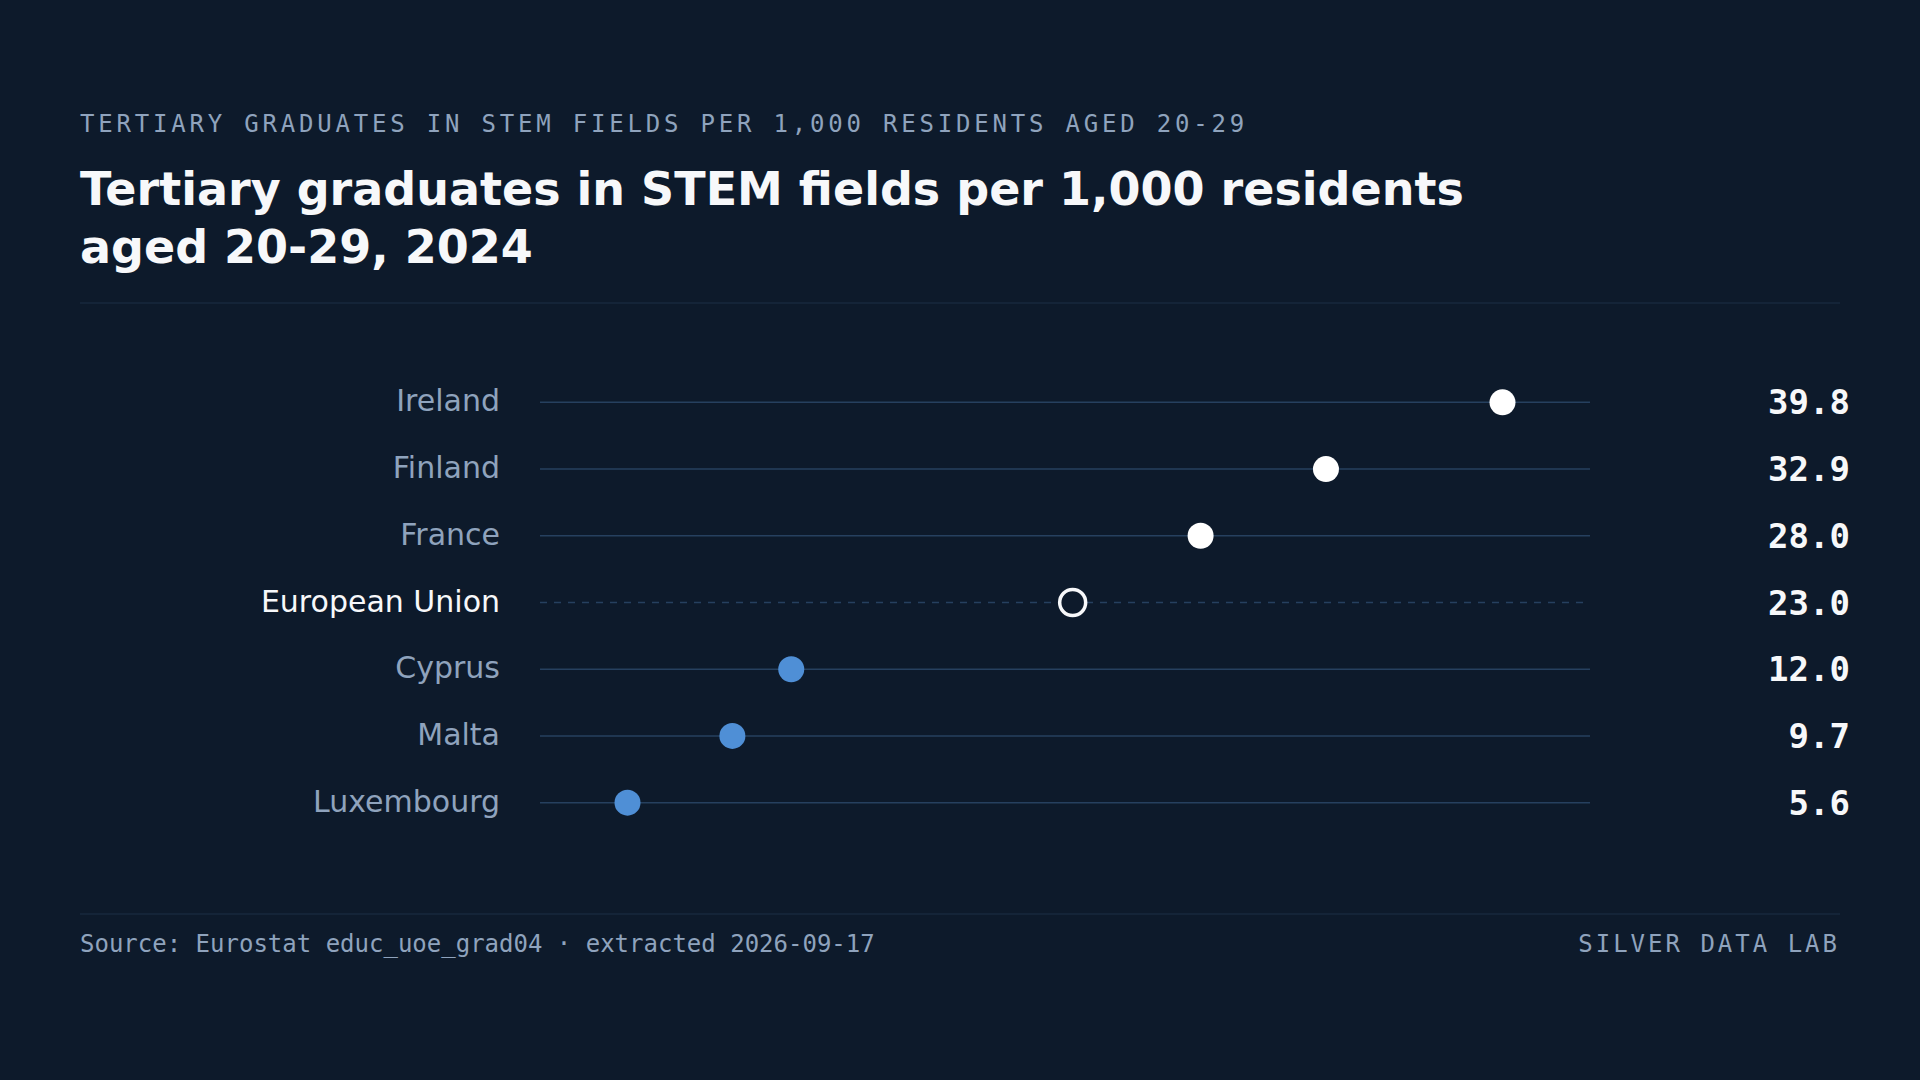
- In 2024 the EU produced 23.0 tertiary graduates in science, mathematics, computing, engineering, manufacturing and construction for every 1,000 residents aged 20 to 29.
- Ireland records 39.8, Finland 32.9, France 28.0, Denmark 26.5 and Austria 25.5; Luxembourg 5.6, Malta 9.7 and Cyprus 12.0 are the three lowest.
- Men graduate in these fields at 29.7 per 1,000 and women at 15.9, and in no Member State does the female rate reach the male one.
- In six Member States the male rate is at least twice the female one, a ratio derived from the two published rates: Spain, Belgium, Hungary, Austria, Germany and Slovakia.
- Greece is the closest to parity: 24.4 among men against 19.2 among women, a male rate 1.27 times the female one.
Graduates measured against a generation
Eurostat counts the people who complete a tertiary degree in natural sciences, mathematics and statistics, in information and communication technologies, and in engineering, manufacturing and construction, and sets that count against the resident population aged 20 to 29. The result is a rate per 1,000 young adults: how many members of a cohort a country's universities and colleges turn into scientists, engineers and programmers each year.
For the EU in 2024 the rate was 23.0. In a generation of a thousand twenty-somethings, twenty-three graduated in a STEM field that year.
Where the rate is highest
Ireland records 39.8, the highest in the Union and the only Member State above 35. Finland follows at 32.9, France at 28.0, Denmark at 26.5, Austria at 25.5, Spain and Portugal at 24.8, Germany at 24.4 and Slovenia at 23.3. Nine Member States are above the EU figure.
Ireland's figure is flagged by Eurostat as following a definition that differs from the common one, and it is worth reading alongside the denominator: a country that attracts students from abroad graduates them against its own resident population, which raises the rate.
Where it is lowest
Luxembourg records 5.6, Malta 9.7, Cyprus 12.0, Slovakia 13.9 and Hungary 14.4, the five Member States below 15. Latvia at 15.5, Bulgaria at 17.0, Czechia and the Netherlands at 17.1, Lithuania at 17.3 and Belgium at 17.5 come next.
The three lowest are the Union's three smallest Member States, and the explanation is the mirror of Ireland's. Luxembourg, Malta and Cyprus send a large share of their students to universities abroad, where their degrees are counted in another country's numerator while they remain in their own country's denominator. The rate measures where degrees are awarded, not where graduates come from or where they go on to work.
Belgium and the Netherlands are a different case: large, well-resourced higher education systems that produce STEM graduates at roughly three quarters of the EU rate.
Men and women
Across the EU, men graduated in STEM fields at 29.7 per 1,000 and women at 15.9. In no Member State is the female rate higher than the male one, and in six the male rate is at least double: Spain, where the two rates are 35.1 and 14.0, Belgium at 24.7 and 10.1, Hungary at 20.0 and 8.5, Austria at 34.9 and 15.4, Germany at 33.3 and 14.7, and Slovakia at 18.4 and 9.1. The ratios are computed here from the published rates.
Greece is the closest to parity: 24.4 among men and 19.2 among women, a male rate 1.27 times the female one. Romania at 1.30, Estonia at 1.37 and Italy at 1.39 are the next closest ratios. In Ireland, Finland and Denmark, which lead the overall ranking, the female rates of 29.5, 23.2 and 19.6 are the three highest in the Union, and the male rates of 49.9, 41.9 and 33.1 are higher still.
Measured in points rather than ratios, the gap is widest where the overall rate is highest, at 21.1 points in Spain, 20.4 in Ireland and 19.5 in Austria, and narrowest where it is lowest, at 3.4 points in Luxembourg and 3.7 in Malta. Spain, Austria and Germany produce many engineers and few of them are women; Greece and Italy produce fewer engineers and the split is closer to even.
What a graduation rate does not measure
The rate counts degrees awarded in a year, not the stock of qualified people in the workforce, and it says nothing about whether graduates stay. A country can educate engineers for its neighbours, as Ireland partly does, or import them, as Luxembourg does. It also treats a short-cycle diploma and a doctorate alike, since both are tertiary degrees.
Tertiary graduates in STEM fields per 1,000 residents aged 20-29, 2024
| Country | graduates per 1,000 | Gap to EU averagepercentage points, derived |
|---|---|---|
| Ireland | 39.8d | +16.8 |
| Finland | 32.9 | +9.9 |
| France | 28.0 | +5.0 |
| European Unionaggregate | 23.0 | — |
| Cyprus | 12.0 | −11.0 |
| Malta | 9.7 | −13.3 |
| Luxembourg | 5.6 | −17.4 |
Flags carried by the source on these values: d definition differs
This table as data: CSV · JSON
Every Member State for this indicator+
Members see every Member State for this indicator here, not only the rows the ranking prints. Become a Member
Embed this chart
Paste this code into a page. The frame carries the source and the extraction date, and links back to the study.
Female tertiary graduates in STEM fields per 1,000 women aged 20-29, 2024
| Country | graduates per 1,000 | Gap to EU averagepercentage points, derived |
|---|---|---|
| Ireland | 29.5d | +13.6 |
| Finland | 23.2 | +7.3 |
| Denmark | 19.6 | +3.7 |
| European Unionaggregate | 15.9 | — |
| Hungary | 8.5 | −7.4 |
| Cyprus | 8.5 | −7.4 |
| Malta | 7.5 | −8.4 |
| Luxembourg | 3.9 | −12.0 |
Flags carried by the source on these values: d definition differs
This table as data: CSV · JSON
Every Member State for this indicator+
Members see every Member State for this indicator here, not only the rows the ranking prints. Become a Member
Embed this chart
Paste this code into a page. The frame carries the source and the extraction date, and links back to the study.
What these figures cannot tell you
- Degrees are counted where they are awarded
- The numerator is graduates of a country's own institutions; the denominator is its resident population aged 20 to 29. A country with many students from abroad scores high and a country whose students study abroad scores low, independently of how many of its own young people qualify in these fields.
- Two figures carry Eurostat flags
- Ireland's rates are flagged as following a definition that differs from the common one, and Poland's as differing and estimated. Both are used as published and the flags are noted here.
- The gender ratio is derived
- Eurostat publishes rates for men and women separately. The ratio of the male rate to the female rate is computed by Silver Data Lab and labelled as derived wherever it appears.
- All tertiary levels together
- The rate covers every tertiary level, from short-cycle diplomas to doctorates. Countries differ in how much of their STEM education sits at each level, and a country with many short vocational tertiary programmes counts them in the same way as one whose graduates hold master's degrees.
Frequently asked questions
- How many STEM graduates does the EU produce?
- 23.0 per 1,000 residents aged 20 to 29 in 2024, counting every tertiary degree in natural sciences, mathematics and statistics, information and communication technologies, and engineering, manufacturing and construction.
- Which EU country produces the most STEM graduates?
- Ireland, at 39.8 per 1,000 residents aged 20 to 29 in 2024, followed by Finland at 32.9 and France at 28.0. Ireland's figure carries a Eurostat flag for a differing definition and is raised by the students it attracts from abroad.
- Why are Luxembourg, Malta and Cyprus so low?
- Because the rate counts degrees where they are awarded. The three smallest Member States send many of their students to universities abroad, so those graduates are counted in another country's numerator while remaining in their own country's population. Luxembourg records 5.6, Malta 9.7 and Cyprus 12.0.
- Is there an EU country where more women than men graduate in STEM?
- No. Across the EU the rates are 29.7 for men and 15.9 for women, and the male rate is higher in all 27 Member States. Greece is closest to parity, at 24.4 against 19.2; in Spain, Belgium, Hungary, Austria, Germany and Slovakia the male rate is at least twice the female one.
Methodological note
Eurostat publishes the number of tertiary graduates in the fields of natural sciences, mathematics and statistics, information and communication technologies, and engineering, manufacturing and construction, per 1,000 of the resident population aged 20 to 29, drawing on the joint UNESCO, OECD and Eurostat education data collection for the graduates and on Eurostat's population statistics for the denominator.
This study uses the 2024 figures for all tertiary levels together, for the total population and separately for men and women, across all 27 Member States and the EU aggregate. The reference year is the academic year ending in 2024.
The ratio between the male and female rates, the difference between them in points, the counts of Member States above the EU figure and below 15, and the statement that no Member State's female rate exceeds its male one are made by Silver Data Lab from the published rates and labelled as derived. Rates are quoted as published, to one decimal place.
Source data
The underlying series can be inspected and re-downloaded from the Eurostat data browser. The filters below are the ones applied.
Graduates in tertiary education, in science, mathematics, computing, engineering, manufacturing and construction, by sex - per 1000 of population aged 20-29
educ_uoe_grad04
- Filters applied:
- freq=A · unit=P_THAB · isced11=ED5-8 · sex=T, M, F · time=2024
- Extracted:
- 2026-09-17
- Source last updated:
- 2026-07-17
Download the data
The data the study you have just read is built on, exactly as it was downloaded and archived.
Yours as a Member.
Data downloadable by Members
How to cite
Record the vintage as well as the study: the figures on this page are the ones extracted on the dates below.
Silver Data Lab Research Desk (2026). Ireland and Finland Lead the EU in STEM Graduates, and Nowhere Do Women Outnumber Men. Silver Data Lab, published 17 September 2026, last updated 17 September 2026. https://www.silverdatalab.com/studies/stem-graduates-in-the-eu
- Data: Eurostat, Graduates in tertiary education, in science, mathematics, computing, engineering, manufacturing and construction, by sex - per 1000 of population aged 20-29 (educ_uoe_grad04), filters freq=A, unit=P_THAB, isced11=ED5-8, sex=T, M, F, time=2024; extracted 2026-09-17; source last updated 2026-07-17. https://doi.org/10.2908/educ_uoe_grad04
Silver Data Lab's analysis is licensed CC BY 4.0. The statistics remain their publisher's and keep its terms of reuse.
Ask the research desk
A question about this study — a definition, a filter, a break in the series, what the figures can and cannot support — answered by the desk that made the extraction.
Members can write to the research desk
Studies where the same country leads or trails
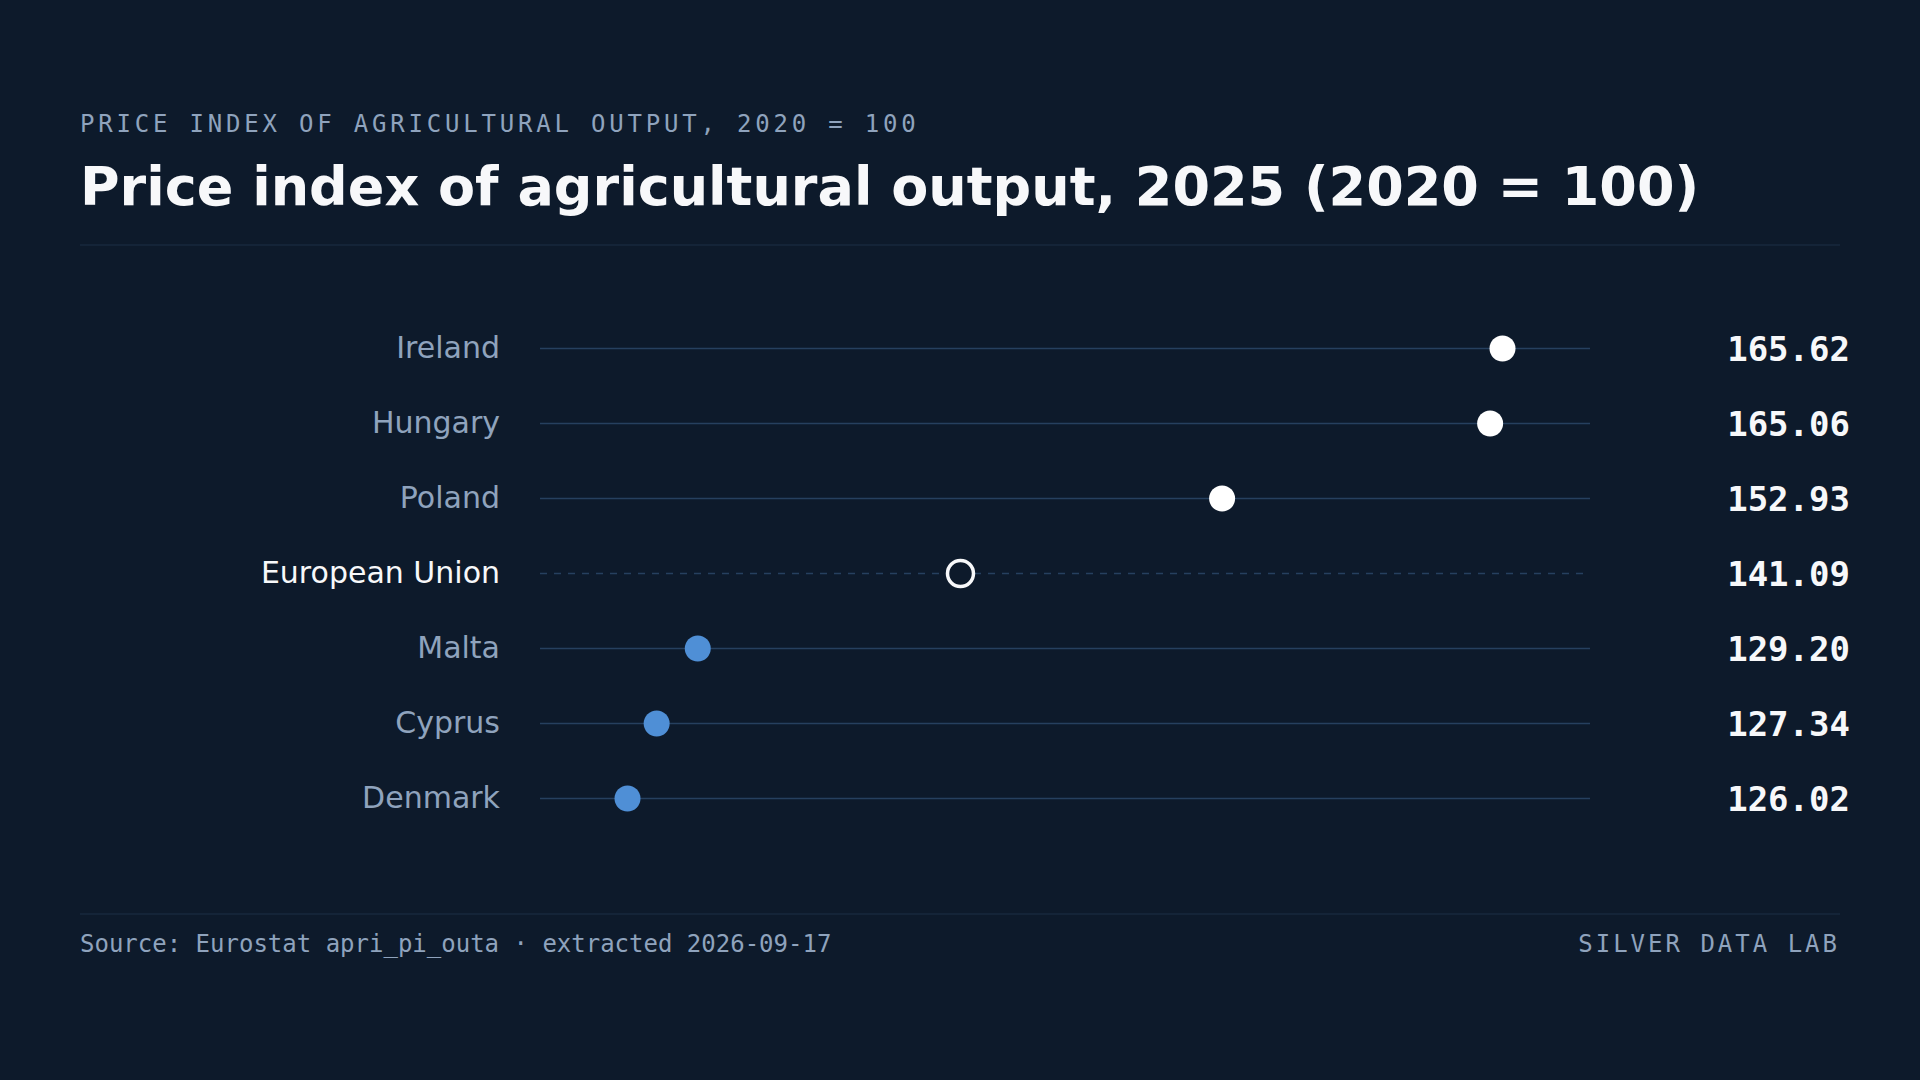
Farm-Gate Prices Are Two Fifths Above Their 2020 Level in the EU, and Two Thirds Above It in Ireland
The prices EU farmers received for their output in 2025 stood at 141.09 against a 2020 base of 100: a rise of just over two fifths in five years.
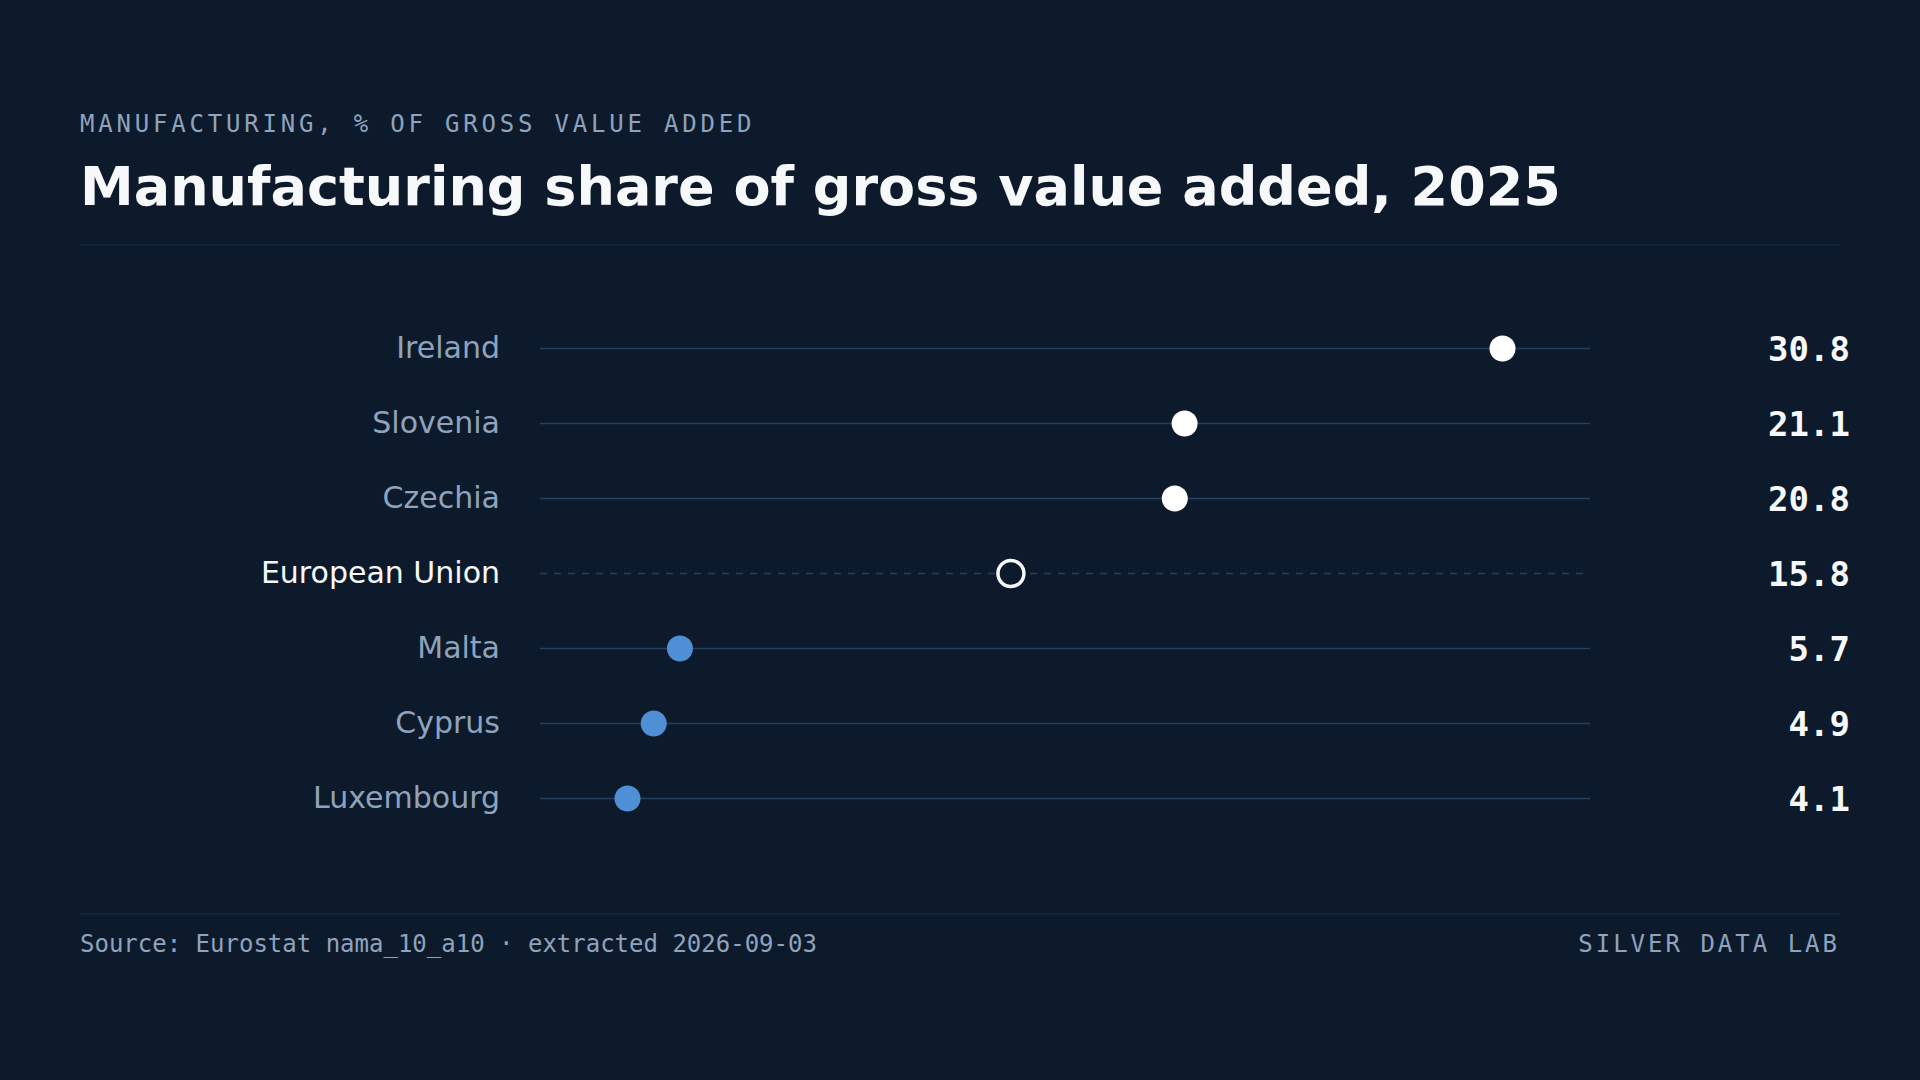
France Manufactures a Smaller Share of Its Economy Than Bulgaria
Manufacturing accounted for 15.8% of gross value added in the EU in 2025.
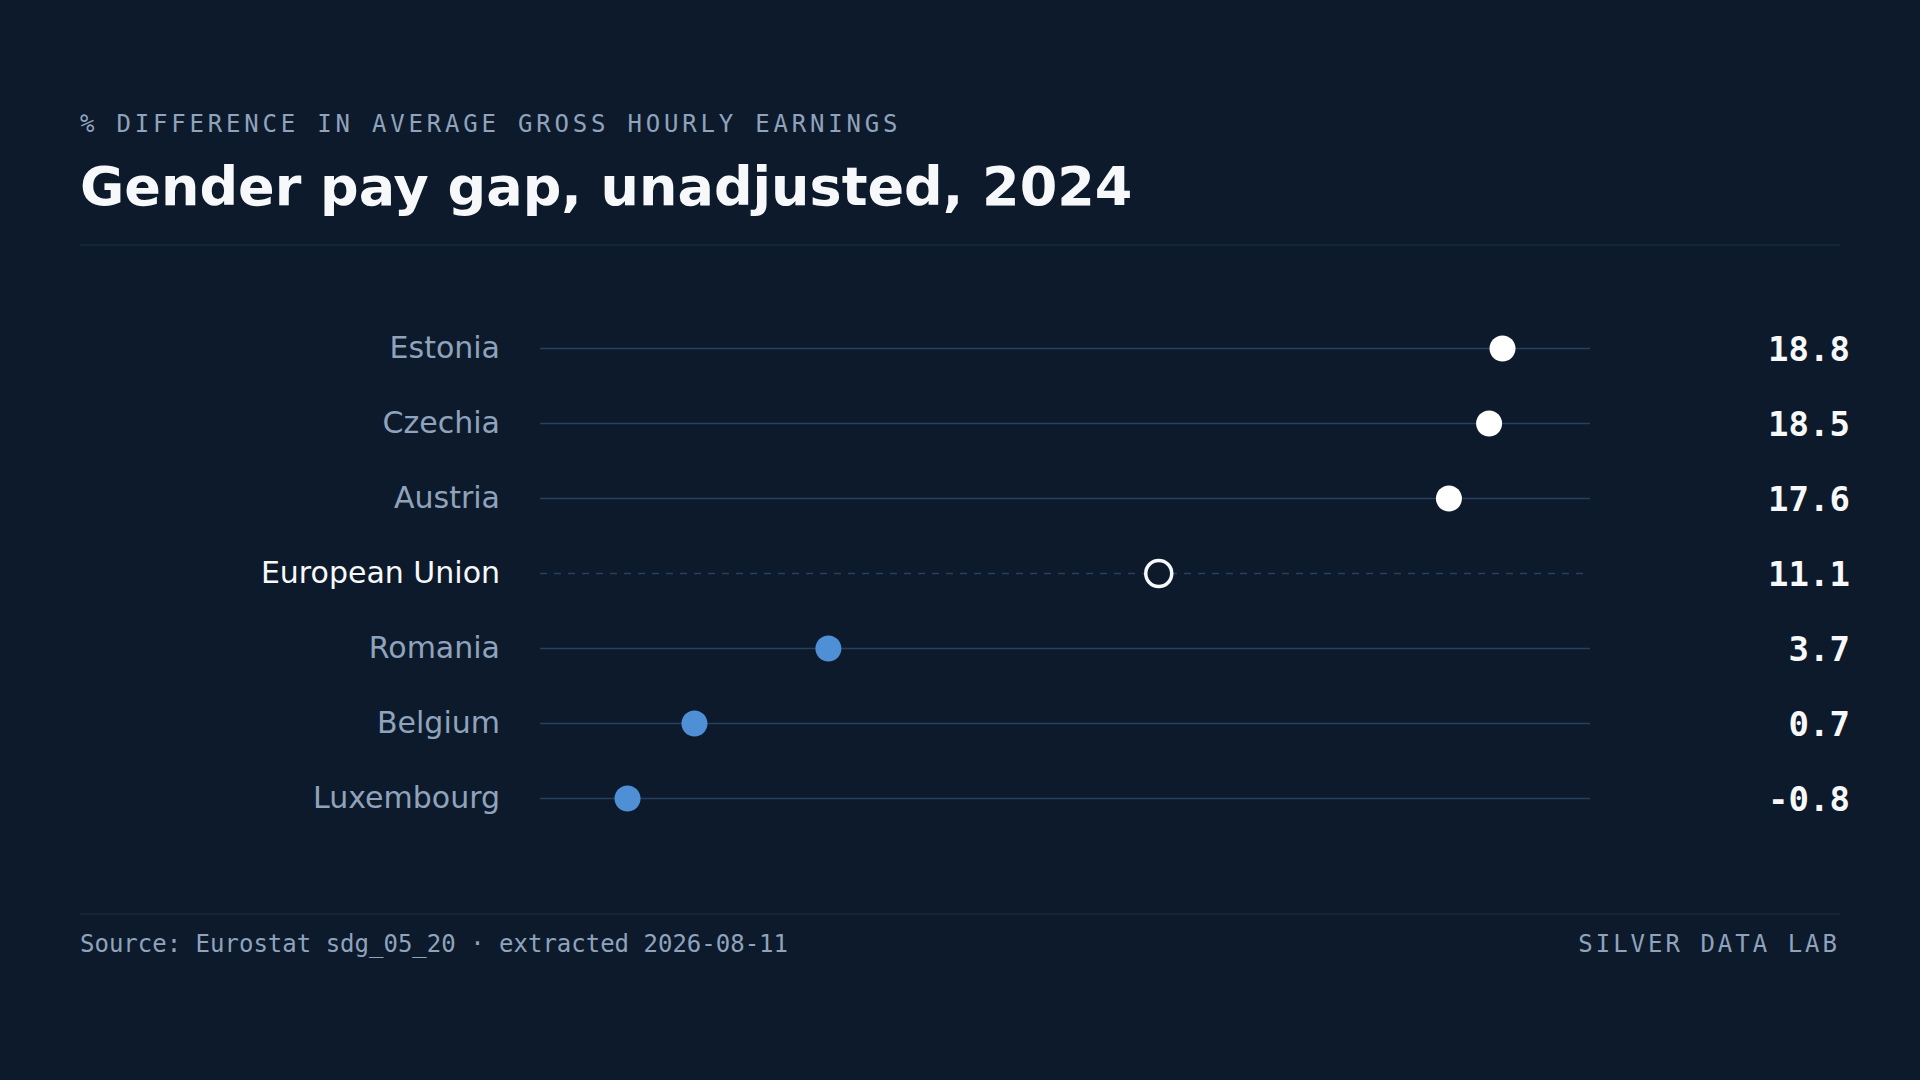
In Luxembourg, Women Are Paid More Than Men
Women in the EU earned 11.1% less per hour than men in 2024, before any adjustment for occupation or hours.