This Decade, Most EU States' Imports Got Dearer Faster Than Their Exports
Silver Data Lab Research Desk · Statistical analysis · Published on 18 October 2026
- Data source
- Eurostat
- Reference period
- 2025
- Last updated
- 18 October 2026
Re-checked against the source on 17 October 2026. No value in its datasets has moved between the snapshots we hold. Every revision we have observed →
Key estimates
- In 2025 the terms of trade of 19 of the 27 Member States stood below 100: since 2021, the average price of the goods each of them sells abroad has risen less than the average price of the goods it buys from abroad.
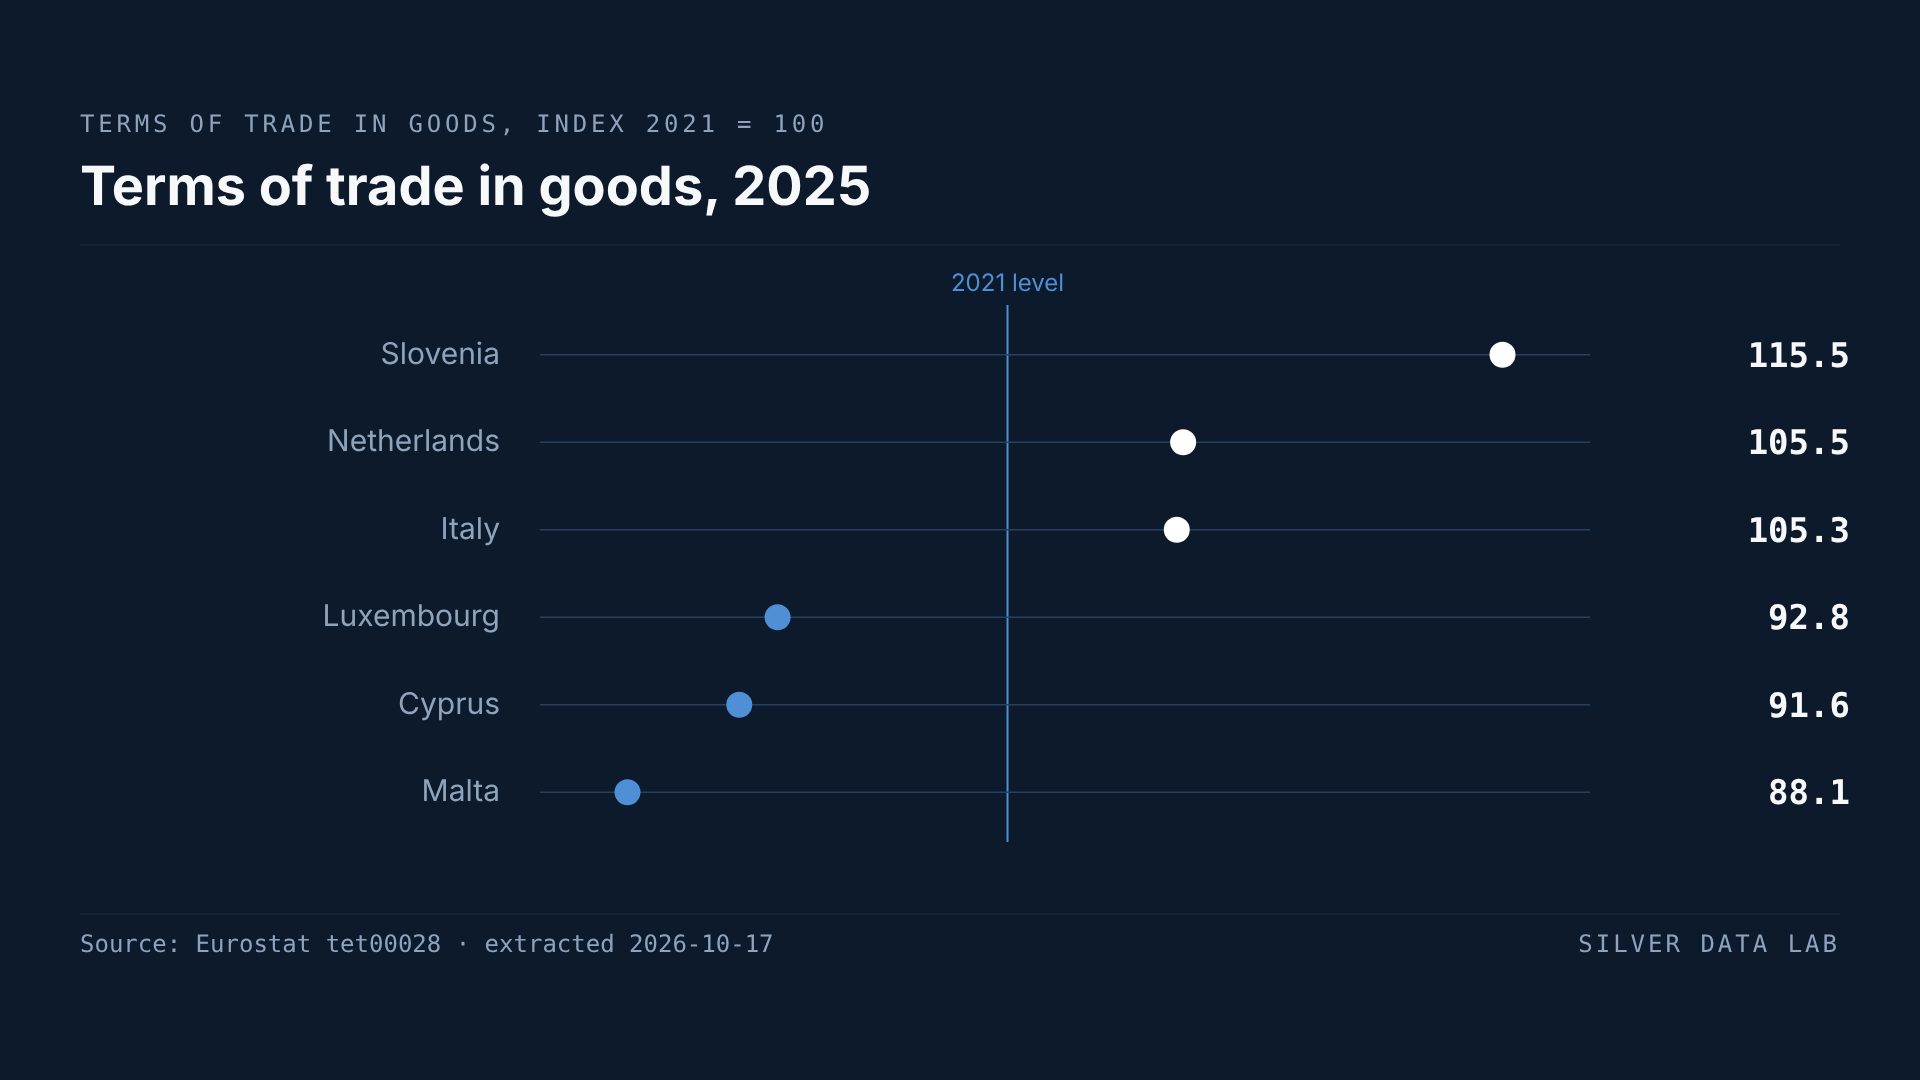
- Slovenia has the highest terms of trade in the EU, 115.5, after its export unit value index climbed to 148.3, the highest of the 27. Malta has the lowest, 88.1, and also the lowest export index, 111.8.
- In 2022, 24 Member States fell below their 2021 level, and for 14 of them that year is the lowest point of a series that starts in 2014.
- Italy went from the lowest terms of trade in the EU in 2022, 89.6, to the third highest in 2025, 105.3, a derived rise of 15.7 points, as its export index rose and its import index fell.
- Luxembourg lost the most ground after 2022, a derived fall of 8.5 points, as its import unit value index rose from 119.4 to 134.0, the highest in the Union.
What a country's exports fetch against what its imports cost
In 2025, in 19 of the 27 Member States, the average price of the goods a country sold abroad had risen less since 2021 than the average price of the goods it bought from abroad. In the other eight it had risen more. Eurostat records this as the terms of trade: an index of export unit values divided by an index of import unit values, both set to 100 in 2021. A reading below 100 means that, on average, the same quantity of exports now pays for a smaller quantity of imports than it did in 2021; a reading above 100 means it pays for more.
A unit value is the value of a shipment divided by its quantity, recorded as a weight in kilograms and, for some goods, also in litres, pieces or another unit: an average price per unit of goods. Eurostat computes it product by product and partner by partner, links the year-on-year changes into a chain and publishes the result as an index. Because it averages over whatever was shipped, it moves when the mix of goods changes as well as when prices do. It stands in for trade prices; it is not a survey of them.
Average prices rose in both directions everywhere. In 2025 every Member State's export index and every import index stood above 100: exports from 111.8 in Malta to 148.3 in Slovenia, imports from 117.2 in the Netherlands to 134.0 in Luxembourg. The terms of trade say which of the two rose faster.
Most below the line, many only just
The nineteen Member States below 100 are not all far from it. Nine sit between 99.0 and 99.9: Belgium, Portugal, Estonia, Greece, Slovakia, Ireland, France, Romania and Austria. The other ten are below 99, down to Malta at 88.1, Cyprus at 91.6 and Luxembourg at 92.8, with Bulgaria at 93.7, Croatia at 94.4 and Denmark at 95.3 above them.
Eight are above 100. Slovenia leads at 115.5, followed by the Netherlands at 105.5, Italy at 105.3, Czechia at 105.1, Germany at 104.7 and Poland at 103.9. Lithuania at 102.0 and Latvia at 101.1 sit closer to the line.
The year almost everyone lost ground
In 2022 import unit values outran export unit values almost everywhere, and 24 of the 27 Member States fell below their 2021 level. Only Luxembourg and Finland, both at 101.3, and Slovenia at 101.1 stayed above it. For 14 Member States, Germany, France, Italy, Spain and the Netherlands among them, 2022 is the lowest point of a series that begins in 2014. Italy recorded the lowest terms of trade in the Union that year, 89.6, with Malta at 90.1 and Ireland at 91.4 next. The table covers all goods together, so it cannot show which products drove the jump.
Greece is a reminder that large swings in average prices and a large swing in the terms of trade are different things. In 2022 it had both the highest export index in the EU, 136.6, and the highest import index, 138.7. Because the two climbed almost together, its terms of trade only slipped to 98.5.
Who recovered, and from which side
Between 2022 and 2025 the terms of trade rose in 18 Member States and fell in nine. Reading the export and import indices separately shows that the gains came from different directions.
Italy's was the largest, 15.7 points by derived difference, from 89.6 to 105.3: from the bottom of the ranking to third place. Both halves moved its way. Its export unit value index went from 118.5 to 132.6 while its import index fell from 132.3 to 125.9.
Slovenia's rise of 14.4 points, also derived, came almost entirely from what it sells. Its import index hardly moved, from 128.7 to 128.4, while its export index went from 130.1 to 148.3, well clear of Italy's 132.6 in second place. Slovenia is the only Member State whose terms of trade stayed above 100 in every year from 2022 to 2025, and it has ranked first since 2023.
The Netherlands, third with a derived gain of 8.6 points, gained on both sides in about equal measure: its import index fell from 122.7 to 117.2, the lowest of the 27 in 2025, while its export index rose from 118.9 to 123.7. Germany climbed from 97.3 to 104.7 with its exports doing more of the work, rising from 116.4 to 122.9 while its imports eased from 119.6 to 117.4.
Who fell further behind
Luxembourg lost most, 8.5 points by derived difference, from 101.3 to 92.8, and the loss sits on the import side. Its import unit value index was the joint third lowest in the Union in 2022, at 119.4 like Finland's, and the highest in 2025, at 134.0, while its export index rose only from 121.0 to 124.4.
Cyprus lost a derived 7.7 points on the export side: its export index fell from 127.9 to 116.5 while its import index eased from 128.8 to 127.2. Its terms of trade have fallen in every year since 2018, from 116.8 to 91.6. Finland, one of the three Member States above 100 in 2022, dropped a derived 3.7 points to 97.6, as its export index fell from 121.0 to 116.5 and its import index ended where it started, at 119.4.
Malta has ranked second lowest in every year from 2022 to 2024 and lowest in 2025, when it reads 88.1, its export index of 111.8 set against an import index of 126.9.
Why the EU's own figure is left out
Eurostat's table also carries an index for the EU, and in 2025 it reads 110.4, the highest value in its series since 2014 and above every Member State except Slovenia. It is not an average of the 27. In the dataset this table is drawn from, Eurostat publishes the EU's indices for trade with countries outside the Union, with the same values, and each Member State's for its trade with every country. A national index therefore includes trade between Member States, where one country's export is another's import, and the EU index leaves that trade out.
What the EU figure does say is that, in trade with the rest of the world, the Union's export unit value index rose from 119.2 in 2022 to 128.7 in 2025 while its import index fell from 129.1 to 116.6. That describes the Union's dealings with non-EU countries, not the typical Member State, and neither ranking here carries an EU reference row.
A base year that was not a quiet one
2021 is the reference year Eurostat chose, and it was not a neutral one. In 24 Member States the terms of trade were higher in 2020 than in 2021, so the base already sits after a fall. Set against 2019 instead, nine Member States read higher in 2025, 17 lower, and France exactly the same at 99.3. Belgium and Estonia join the gainers on that comparison and Lithuania leaves them, but most Member States are behind on either base.
Terms of trade in goods, 2025
| Country | index, 2021 = 100 |
|---|---|
| Slovenia | 115.5 |
| Netherlands | 105.5 |
| Italy | 105.3 |
| Luxembourg | 92.8 |
| Cyprus | 91.6 |
| Malta | 88.1 |
This table as data: CSV · JSON
Every Member State for this indicator+
Members see every Member State for this indicator here, not only the rows the ranking prints. Become a Member
Embed this chart
Paste this code into a page. The frame carries the source and the extraction date, and links back to the study.
Change in the terms of trade in goods between 2022 and 2025
| Country | index points (derived) |
|---|---|
| Italy | 15.7 |
| Slovenia | 14.4 |
| Netherlands | 8.6 |
| Finland | -3.7 |
| Cyprus | -7.7 |
| Luxembourg | -8.5 |
This table as data: CSV · JSON
Every Member State for this indicator+
Members see every Member State for this indicator here, not only the rows the ranking prints. Become a Member
Embed this chart
Paste this code into a page. The frame carries the source and the extraction date, and links back to the study.
What these figures cannot tell you
- Average prices per unit, not a price survey
- A unit value index divides the value of trade by its quantity, so it tracks the average price paid per kilogram or per unit of whatever crossed the border. When a country starts exporting more expensive goods within the same product code, or fewer cheap ones, its index rises with no price having changed. Eurostat treats unit values as an indicator of price movements, not as prices collected from sellers. Ireland's terms of trade fell in every year from 2016 to 2023, from 137.5 to 87.2; how much of a movement like that comes from prices and how much from what is being traded, the table cannot say.
- The EU row covers trade with non-EU countries only
- The table lists the EU under the partner 'all countries of the world', but the dataset it is drawn from, ext_lt_intertrd, publishes the same EU values as an index of extra-EU trade, while each Member State's index there covers all of its trade, the trade with other Member States included. The EU figure of 110.4 for 2025 is therefore not comparable with the national rows and is not an average of them. The euro area rows in the table carry no values at all.
- Everything is measured against 2021
- Each index reads 100 in 2021, so a value describes the change since that year and not a level that can be compared across countries in any absolute sense: Slovenia at 115.5 and Malta at 88.1 say how far each moved from its own 2021 position. Eurostat moved the reference year from 2015 to 2021 with the release of March 2025 and describes the effect of the change as limited, because the indices are chained year to year. One sentence of the dataset's own description in the API still names 2015 as the reference year, while its labels, its opening sentence and its metadata page give 2021.
- Goods only, all products together
- These are indices for trade in goods; services are outside them. They cover all products at once, so the table cannot show whether a change came from fuel, food, machinery or anything else, and a country whose exports are concentrated in a few product lines can move further than one with a broad mix.
- Values are revised
- Eurostat updates the long-term trade indicators at each monthly release, when Member States supply new detailed data and revisions, so earlier years can change. The figures here come from the release of 16 October 2026.
Frequently asked questions
- What are the terms of trade?
- The ratio of a country's export prices to its import prices, as an index. In this Eurostat table both sides are unit value indices, the average value per unit of goods exported and imported, with 2021 = 100. Below 100, the same quantity of exports pays for fewer imports than in 2021; above 100, for more.
- Which EU country has the highest terms of trade?
- Slovenia, at 115.5 in 2025, then the Netherlands at 105.5 and Italy at 105.3. Slovenia's export unit value index reached 148.3, the highest of the 27, while its import index stood at 128.4. Malta is lowest at 88.1.
- Did the terms of trade fall in 2022?
- In 24 of the 27 Member States, which all fell below their 2021 level; only Luxembourg, Finland and Slovenia stayed above it. For 14 Member States 2022 is the lowest value since the series starts in 2014. Italy had the lowest reading that year, 89.6.
- Is a unit value index the same as a price index?
- No. It divides the value of trade by its quantity, so it changes when the mix of goods shifts as well as when prices do. Eurostat uses it as an indicator of price movements; it is not built from prices collected from sellers.
- Why is the EU's index higher than almost every Member State's?
- The two do not measure the same thing, so they cannot be ranked together. The EU index, 110.4 in 2025, covers the Union's trade with non-EU countries only, while each Member State's covers all its trade, including trade with other Member States. It is not an average of the national figures.
Methodological note
Eurostat publishes, from the international trade in goods statistics, an export unit value index, an import unit value index and their ratio, the terms of trade, for the EU and each Member State, with partner set to all countries and all products together, as annual indices with 2021 = 100. This study uses all three for the 27 Member States from 2014 to 2025, and the EU row over the same years only to explain why it is not used as a reference. Each terms-of-trade value was checked against the ratio of the two published indices for the same country and year and agrees with it to within rounding.
The indices are quoted exactly as published. Silver Data Lab derived the change in the terms of trade between 2022 and 2025 for each Member State, as the published 2025 value minus the published 2022 value, in index points, which is what the second ranking shows. Every count, rank and comparison of Member States is taken over all 27: the number above and below 100 in each year cited, the grouping of 2025 values into above 100, between 99.0 and 99.9, and below 99, the years in which a series reached its lowest point, the number of Member States whose 2020 value exceeded 100, and the comparison of each Member State's 2025 value with its 2019 value. Nothing else is computed.
Source data
The underlying series can be inspected and re-downloaded from the Eurostat data browser. The filters below are the ones applied.
Trade unit value indices, by reporting country
tet00028
- Filters applied:
- freq=A · partner=WORLD · indic_et=IVU_EXP, IVU_IMP, RT_IVU · sitc06=TOTAL
- Extracted:
- 2026-10-17
- Source last updated:
- 2026-10-16
Download the data
The data the study you have just read is built on, exactly as it was downloaded and archived.
Yours as a Member.
Data downloadable by Members
How to cite
Record the vintage as well as the study: the figures on this page are the ones extracted on the dates below.
Silver Data Lab Research Desk (2026). This Decade, Most EU States' Imports Got Dearer Faster Than Their Exports. Silver Data Lab, published 18 October 2026, last updated 18 October 2026. https://www.silverdatalab.com/studies/terms-of-trade-in-the-eu
- Data: Eurostat, Trade unit value indices, by reporting country (tet00028), filters freq=A, partner=WORLD, indic_et=IVU_EXP, IVU_IMP, RT_IVU, sitc06=TOTAL; extracted 2026-10-17; source last updated 2026-10-16. https://doi.org/10.2908/tet00028
Silver Data Lab's analysis is licensed CC BY 4.0. The statistics remain their publisher's and keep its terms of reuse.
Ask the research desk
A question about this study — a definition, a filter, a break in the series, what the figures can and cannot support — answered by the desk that made the extraction.
Members can write to the research desk
Studies where the same country leads or trails
Austria Already Farms a Quarter of Its Farmland Organically
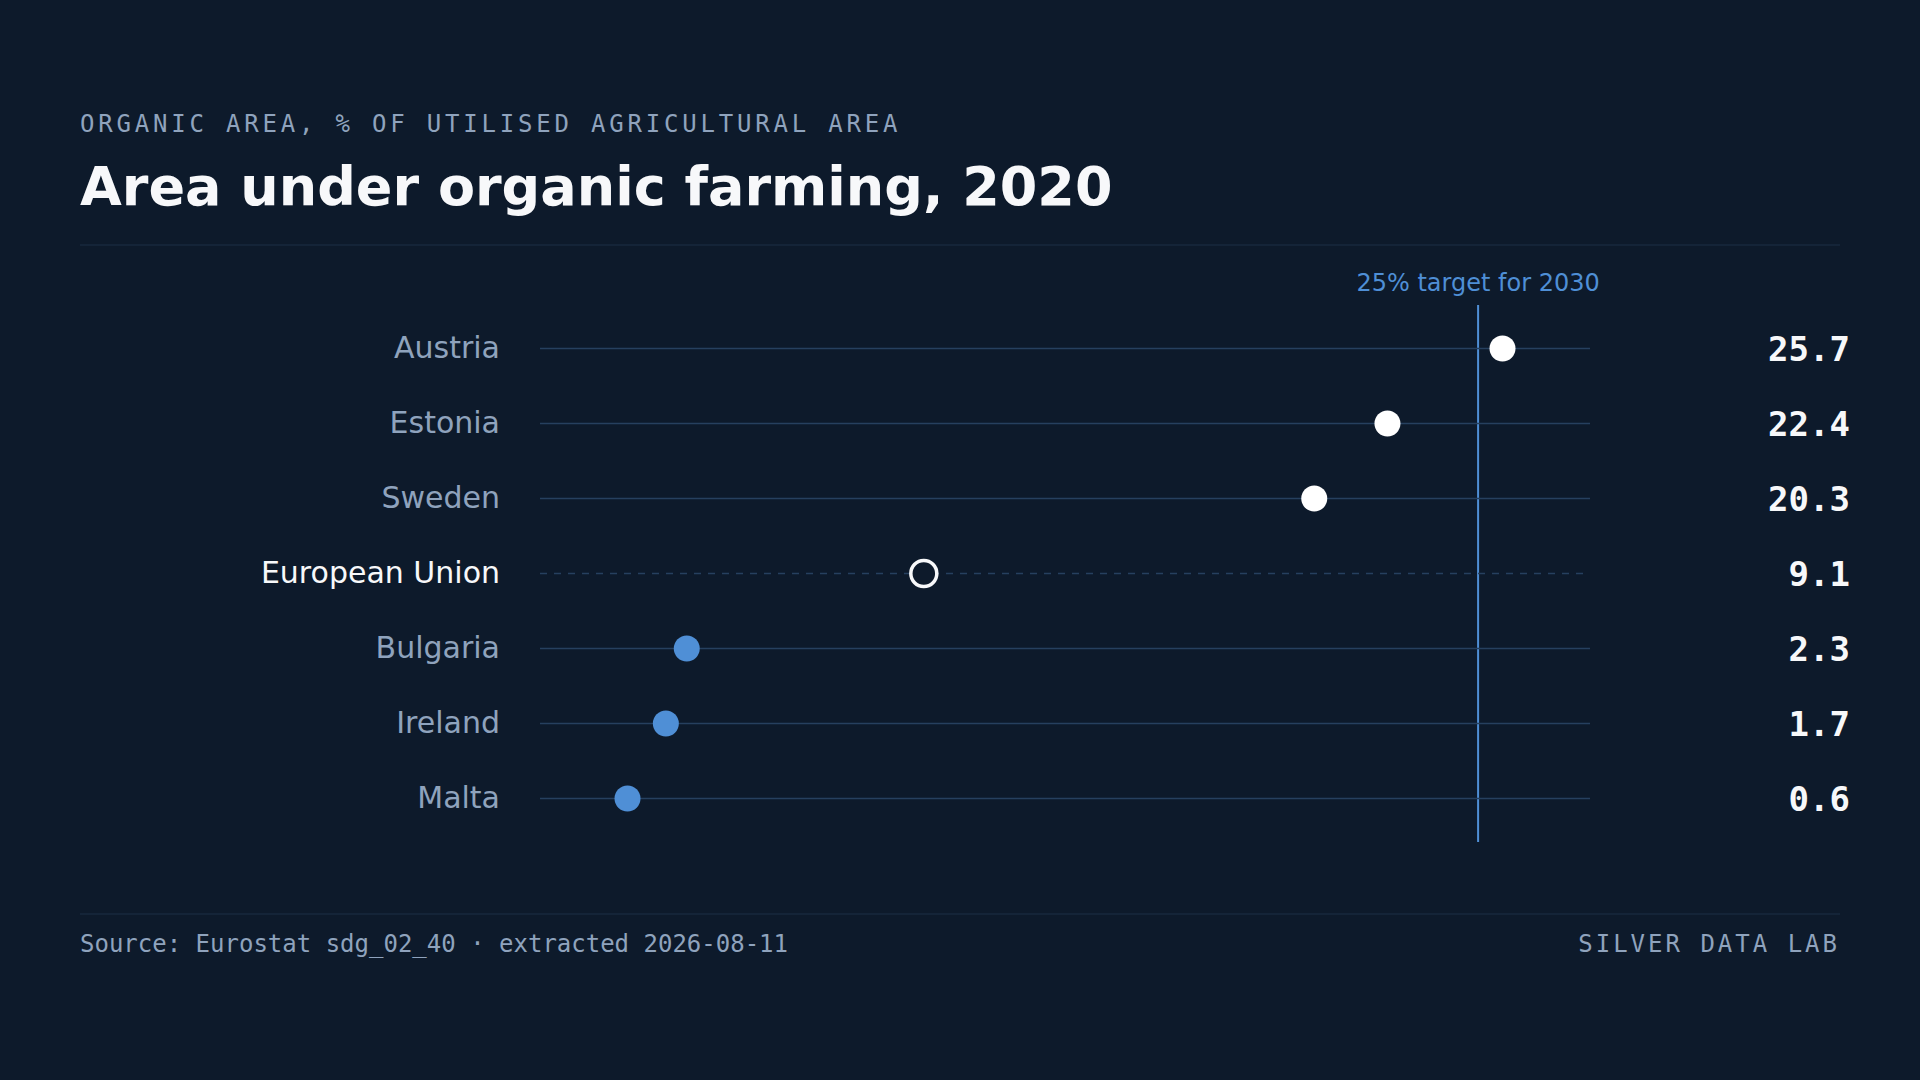
9.1% of the EU's utilised agricultural area was under organic management in 2020, against a target of 25% by 2030.
Extreme Weather Costs Slovenia Five Times the EU Average per Person
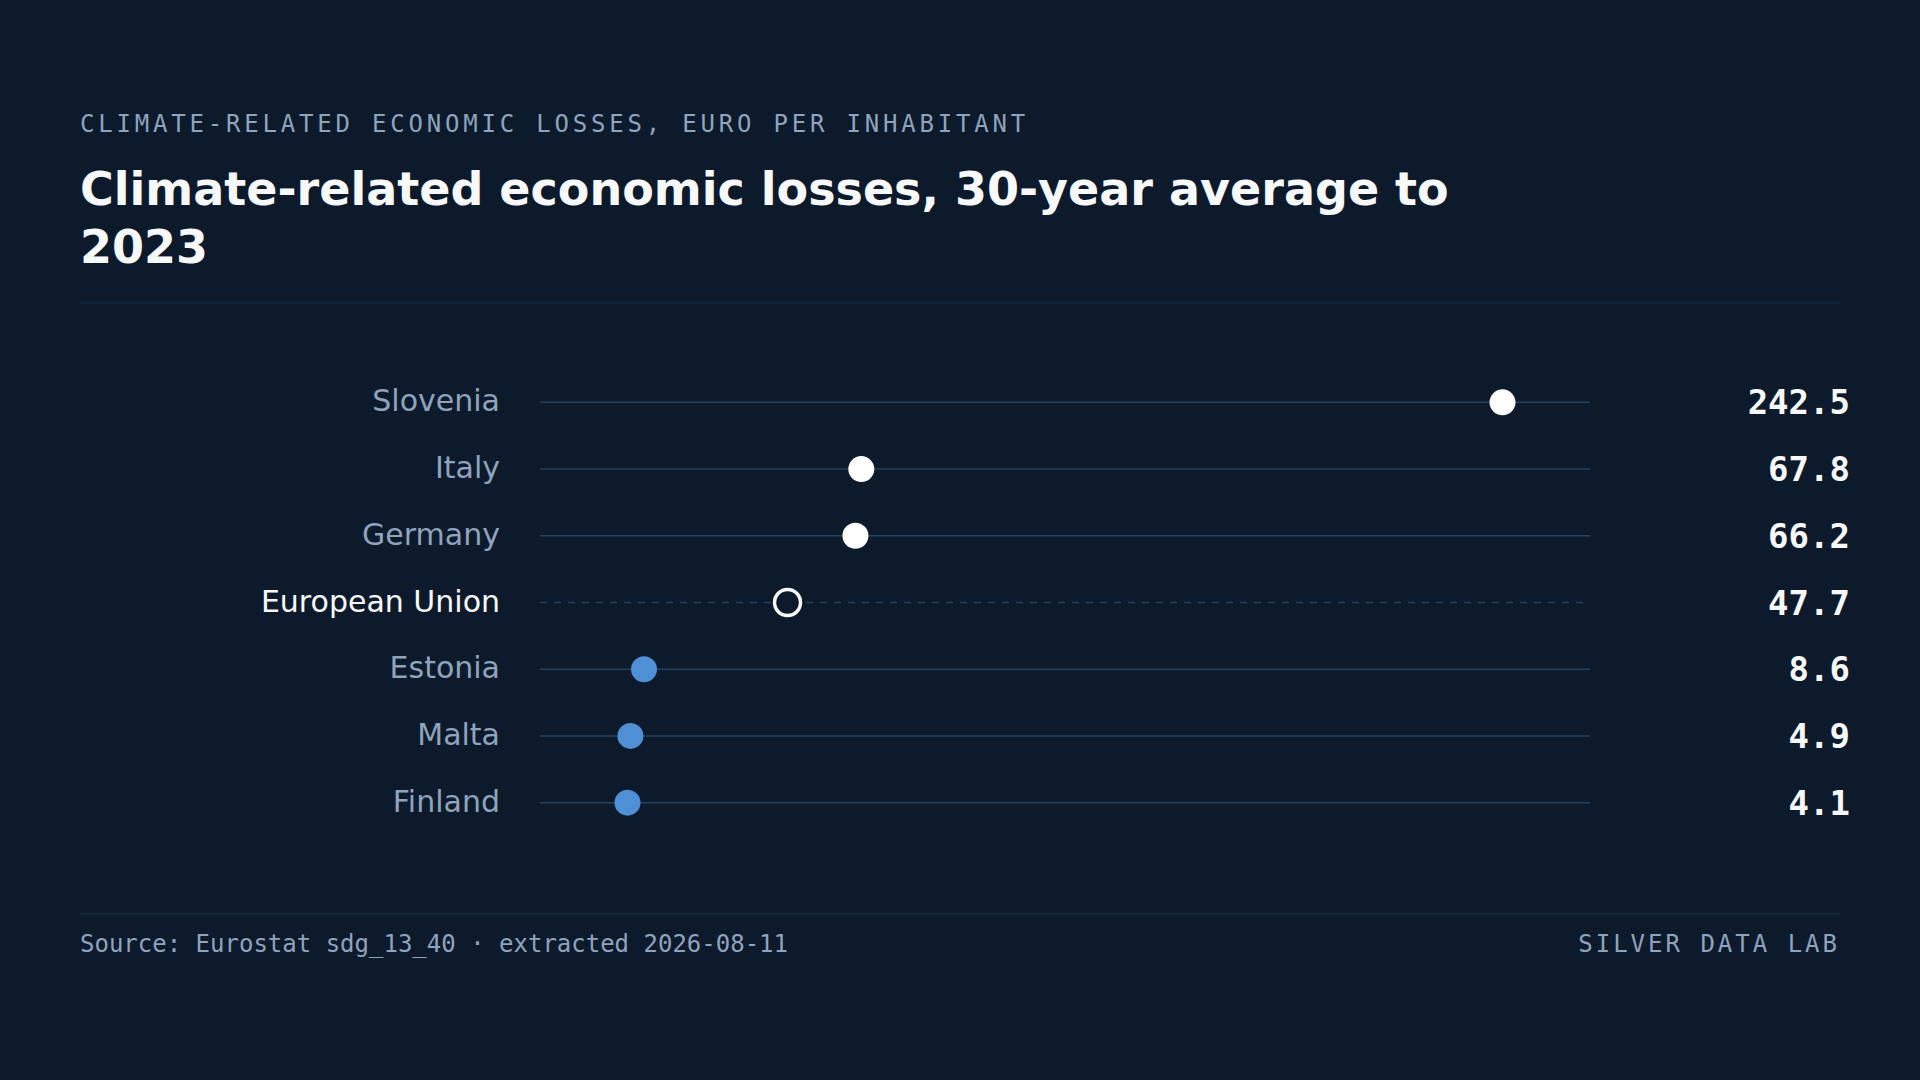
Climate-related disasters cost the EU 47.7 euro per inhabitant a year, averaged over the thirty years to 2023.
In No EU Country Are Enough Babies Born to Replace Their Parents
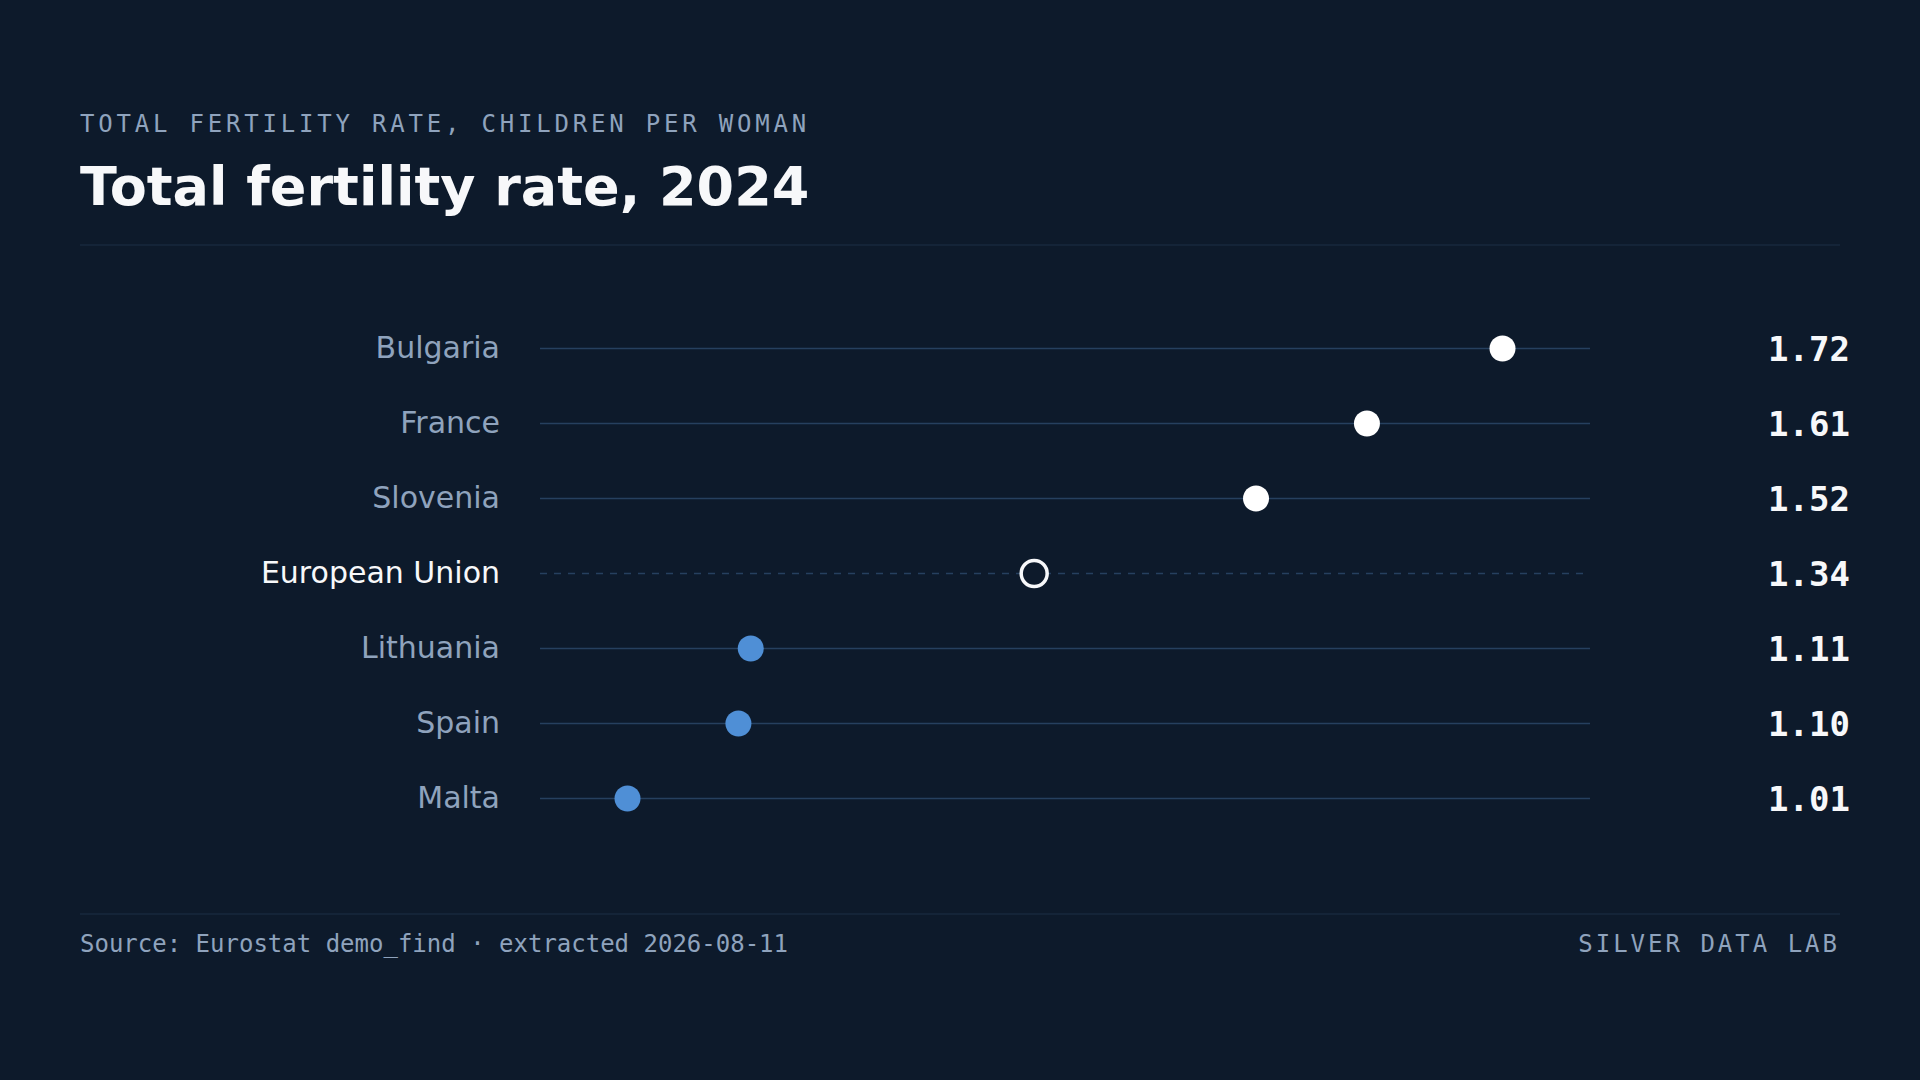
The EU total fertility rate was 1.34 children per woman in 2024, against the 2.1 conventionally taken as replacement level.