Four Countries Produce More Than Half of the EU's Farm Output
Silver Data Lab Research Desk · Statistical analysis · Published on 16 May 2026
This study is open to members only
Its sources, filters and extraction date are declared above, as they are for every study. Sign in to read the analysis in full.
- Data source
- Eurostat
- Reference period
- 2025
- Last updated
- 20 October 2026
Re-checked against the source on 04 October 2026. No value in its datasets has moved between the snapshots we hold. Every revision we have observed →
Key estimates
- EU agricultural output was worth 541.7 billion euro at basic prices in 2025.
- France produced 88.1 billion of it, 16.3% of the Union's total.
- France, Germany, Spain and Italy together account for 56.5% of EU agricultural output.
- Adding Poland and the Netherlands brings six Member States to 72.1%.
- The Netherlands produces 39.3 billion euro of output — nearly twice Romania's — on a fraction of the land.
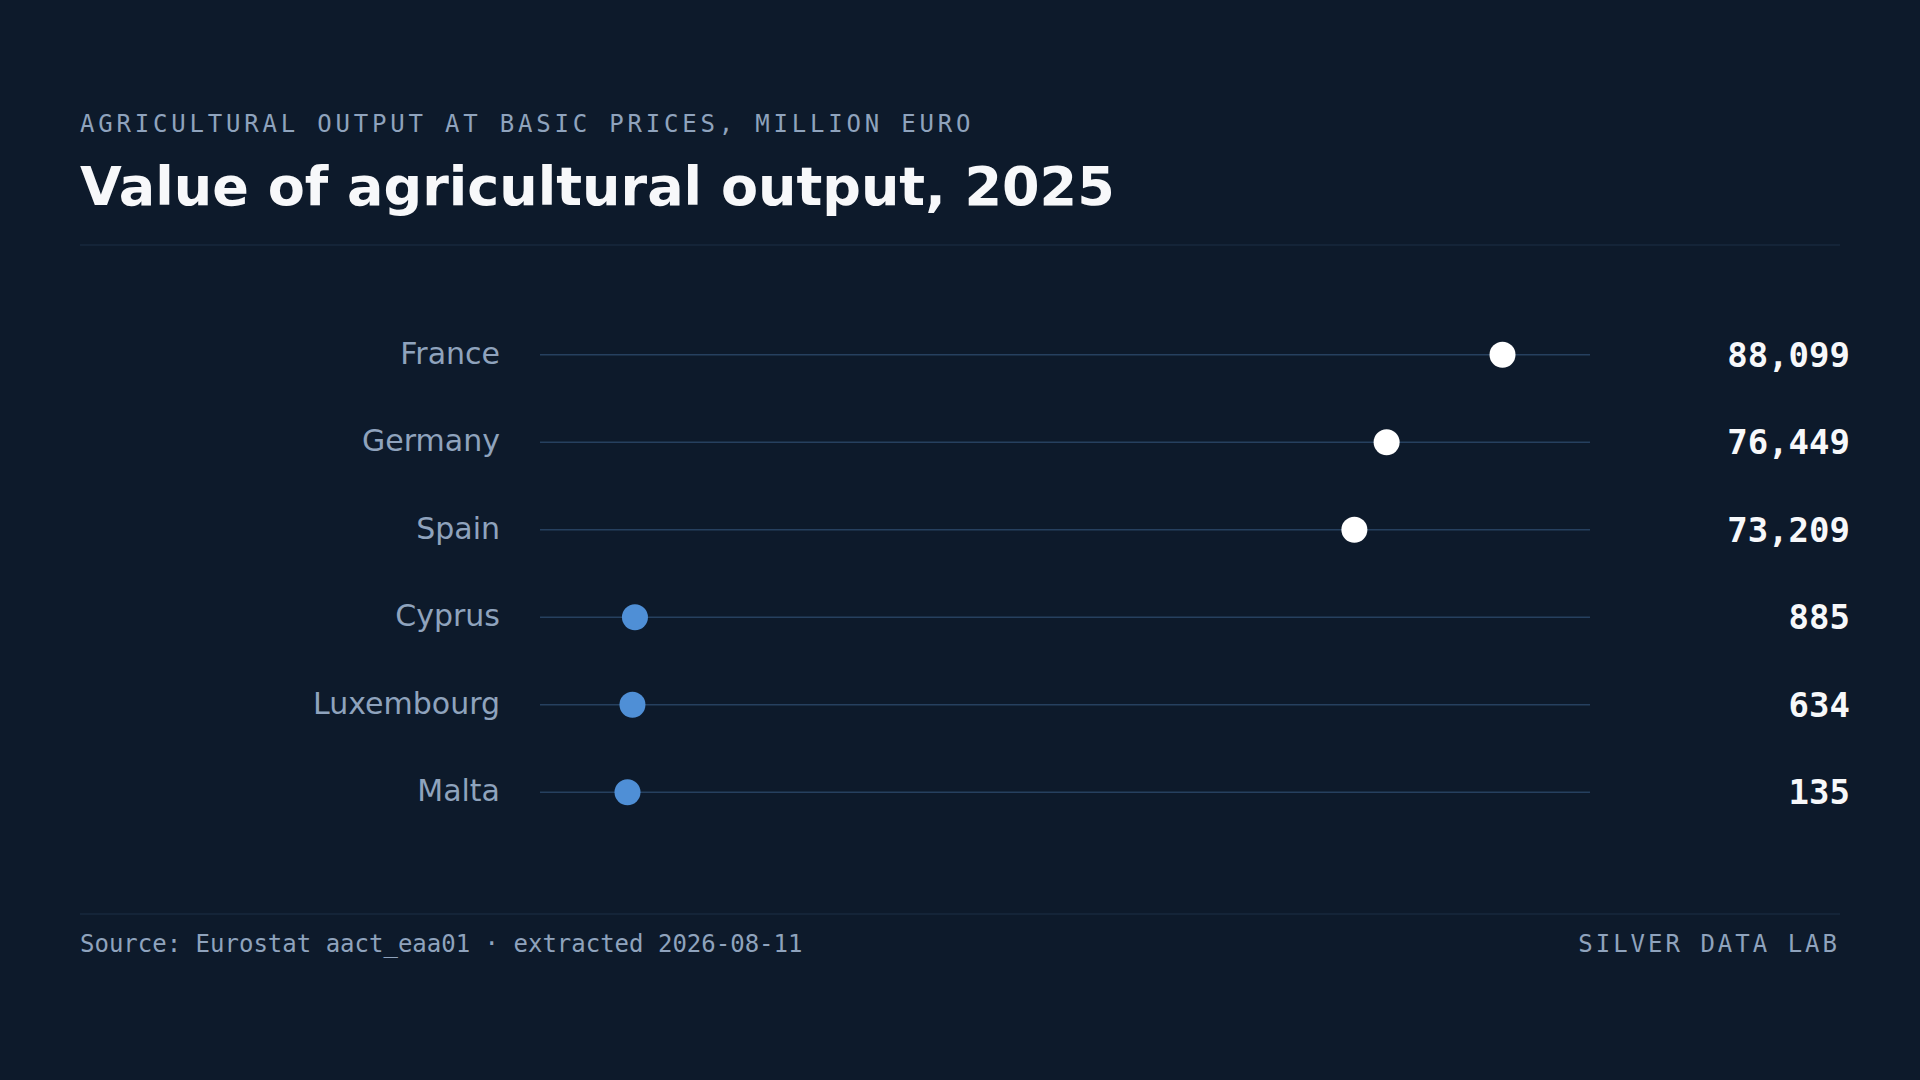
Where Europe's food is produced
The economic accounts for agriculture value everything the sector produces at the prices farmers receive. For the European Union in 2025 that came to 541.7 billion euro.
The distribution of it is concentrated. France produces 88.1 billion, Germany 76.4 billion, Spain 73.2 billion and Italy 68.2 billion. Those four Member States together account for 56.5% of the Union's agricultural output.
Add Poland at 45.3 billion and the Netherlands at 39.3 billion, and six Member States account for 72.1%. The remaining twenty-one share just over a quarter.
The Dutch case
The Netherlands is the entry that does not follow from size. It is a small country — 37,391 square kilometres on the land-area series declared below, under one per cent of the Union's territory — and it produces 7.3% of the Union's agricultural output, more than Romania and Greece combined.
Dutch agriculture is concentrated in horticulture, greenhouse production and intensive livestock, all of which generate high output value per hectare. Where French or Polish agriculture is extensive and covers a large area, Dutch agriculture is intensive and covers a small one.
That comparison is the reason a ranking of output value should not be read as a ranking of agricultural land, of employment or of environmental footprint. Those rank differently, and two of them are covered separately on this site.
What concentration means and what it does not
A concentrated output distribution is what one would expect from a Union whose members differ enormously in size. France's 16.3% share sits against a population share of 15.3%, taken from the demographic balance declared below, which is close to proportionate.
The observation worth making is not that the large producers are large. It is that the Union's food supply rests on a small number of national agricultural systems, each with its own weather, its own dominant crops and its own exposure to a bad year. France and Spain are neighbours and produce 29.8% of EU output between them, so one weather system can put close to a third of it at risk at once. The twenty-one smallest producers come to almost the same share, 27.9%, but they run from Ireland to Cyprus, and losing it would take twenty-one separate bad years.
Reading the figures
These are values, not quantities. An output figure rises when farmers receive higher prices as well as when they produce more, so a movement between two years can be either, and this study measures no price series that would separate them.
For year-on-year comparison the volume measures in the same accounts are the appropriate series. For the question this study asks — how EU farm output is distributed between Member States in a given year — the value measure is the right one.
Value of agricultural output, 2025
| Country | million euro |
|---|---|
| France | 88,099e |
| Germany | 76,449e |
| Spain | 73,209e |
| Cyprus | 885e |
| Luxembourg | 634e |
| Malta | 135e |
Flags carried by the source on these values: e estimated
This table as data: CSV · JSON
Every Member State for this indicator+
Members see every Member State for this indicator here, not only the rows the ranking prints. Become a Member
What these figures cannot tell you
- Values move with prices
- Output is measured in euro at the prices farmers received. A country's figure rises when prices rise as well as when production does, so these values should not be compared across years as if they were quantities.
- Absolute size, not intensity
- This ranking measures total output, so large countries rank high. It says nothing about output per hectare, per worker or per euro of input, and the Netherlands is the clearest demonstration that those rank very differently.
- Basic prices include product subsidies
- Output at basic prices excludes taxes on products and includes subsidies on products. Support paid to farmers as direct income payments rather than on products does not appear here at all, so this is not a measure of farm income.
- Eurostat publishes all of these values as estimates
- Every figure in this study carries the source's estimate flag, the EU total and all twenty-seven national values alike. The shape of the distribution is not in doubt: the distances between the largest and smallest producers are far wider than any plausible revision. But an estimate is not a final figure, and no individual value here should be read as one.
- A narrower total than the accounts' widest
- The economic accounts publish more than one total. This study uses agricultural output: crop output, animal output and agricultural services. The accounts also publish output of the agricultural industry, which adds the non-agricultural secondary activities a holding cannot separate from its farming, such as processing its own produce. A figure from this study will therefore sit below any figure quoted for the same country and year on that wider basis.
- Agricultural output is not food supply
- The accounts cover what is produced in a country, not what is consumed there. A country's agricultural output is therefore not its food supply, and no trade flow is measured here: this study declares no import or export series.
Frequently asked questions
- Which EU country produces the most agricultural output?
- France, at 88.1 billion euro in 2025, or 16.3% of the EU total. Germany follows at 76.4 billion, Spain at 73.2 billion and Italy at 68.2 billion.
- How much is EU agriculture worth?
- 541.7 billion euro of output at basic prices in 2025. That is the value of what farms produced, measured at the prices farmers received, and it excludes direct income support paid to them.
- How concentrated is EU farm production?
- France, Germany, Spain and Italy together produce 56.5% of EU agricultural output. Adding Poland and the Netherlands brings six Member States to 72.1%, leaving just over a quarter for the remaining twenty-one.
- Why does the Netherlands produce so much?
- Dutch agriculture is intensive rather than extensive — horticulture, greenhouse production and intensive livestock generate high output value per hectare. The Netherlands produces 7.3% of EU agricultural output on under one per cent of the Union's land area.
Methodological note
The economic accounts for agriculture value agricultural output at basic prices in millions of euro at current prices. This study uses the agricultural output item, which combines crop output, animal output and agricultural services output. The same accounts publish a wider total as well, and the limitation below says why this study does not use it.
Values are for 2025 and cover all 27 Member States. The EU figure published in the source matches the sum of the 27 national values to the precision Eurostat publishes it, which was verified at the extraction date.
Eurostat's own observation flags are read from the extraction rather than only its values, and here they apply to all of it: every value in the series this study uses, the EU total included, is flagged as an estimate.
The shares of the EU total held by individual Member States, by the largest four and six producers, by France and Spain together and by the twenty-one smallest producers are computed by Silver Data Lab from the published values and are labelled as derived. So are the Dutch share of the Union's land area and the French share of its population, each from the further extraction declared below for that series; the land area is total area by the source's own land-use classification, and the population is the annual average.
Source data
This study draws on 3 datasets from Eurostat. Each can be inspected and re-downloaded from its catalogue, and the filters below are the ones applied.
Economic accounts for agriculture - values at current prices
aact_eaa01
- Filters applied:
- freq=A · indic_agr=PRD_BP · unit=MIO_EUR · am_item=AM160000 · time=2025
- Extracted:
- 2026-08-11
- Source last updated:
- 2026-05-13
Area by NUTS 3 region
reg_area3
- Filters applied:
- freq=A · landuse=TOTAL · unit=KM2 · time=2024
- Extracted:
- 2026-09-16
- Source last updated:
- 2026-01-22
Population change — demographic balance, average population
demo_gind
- Filters applied:
- freq=A · indic_de=AVG · time=2025
- Extracted:
- 2026-10-04
- Source last updated:
- 2026-09-30
Download the data
The data the study you have just read is built on, exactly as it was downloaded and archived.
Yours as a Member.
Data downloadable by Members
How to cite
Record the vintage as well as the study: the figures on this page are the ones extracted on the dates below.
Silver Data Lab Research Desk (2026). Four Countries Produce More Than Half of the EU's Farm Output. Silver Data Lab, published 16 May 2026, last updated 20 October 2026. https://www.silverdatalab.com/studies/agricultural-output-in-the-eu
- Data: Eurostat, Economic accounts for agriculture - values at current prices (aact_eaa01), filters freq=A, indic_agr=PRD_BP, unit=MIO_EUR, am_item=AM160000, time=2025; extracted 2026-08-11; source last updated 2026-05-13. https://doi.org/10.2908/aact_eaa01
- Data: Eurostat, Area by NUTS 3 region (reg_area3), filters freq=A, landuse=TOTAL, unit=KM2, time=2024; extracted 2026-09-16; source last updated 2026-01-22. https://doi.org/10.2908/reg_area3
- Data: Eurostat, Population change — demographic balance, average population (demo_gind), filters freq=A, indic_de=AVG, time=2025; extracted 2026-10-04; source last updated 2026-09-30. https://doi.org/10.2908/demo_gind
Silver Data Lab's analysis is licensed CC BY 4.0. The statistics remain their publisher's and keep its terms of reuse.
Ask the research desk
A question about this study — a definition, a filter, a break in the series, what the figures can and cannot support — answered by the desk that made the extraction.
Members can write to the research desk
Other studies on the same dataset
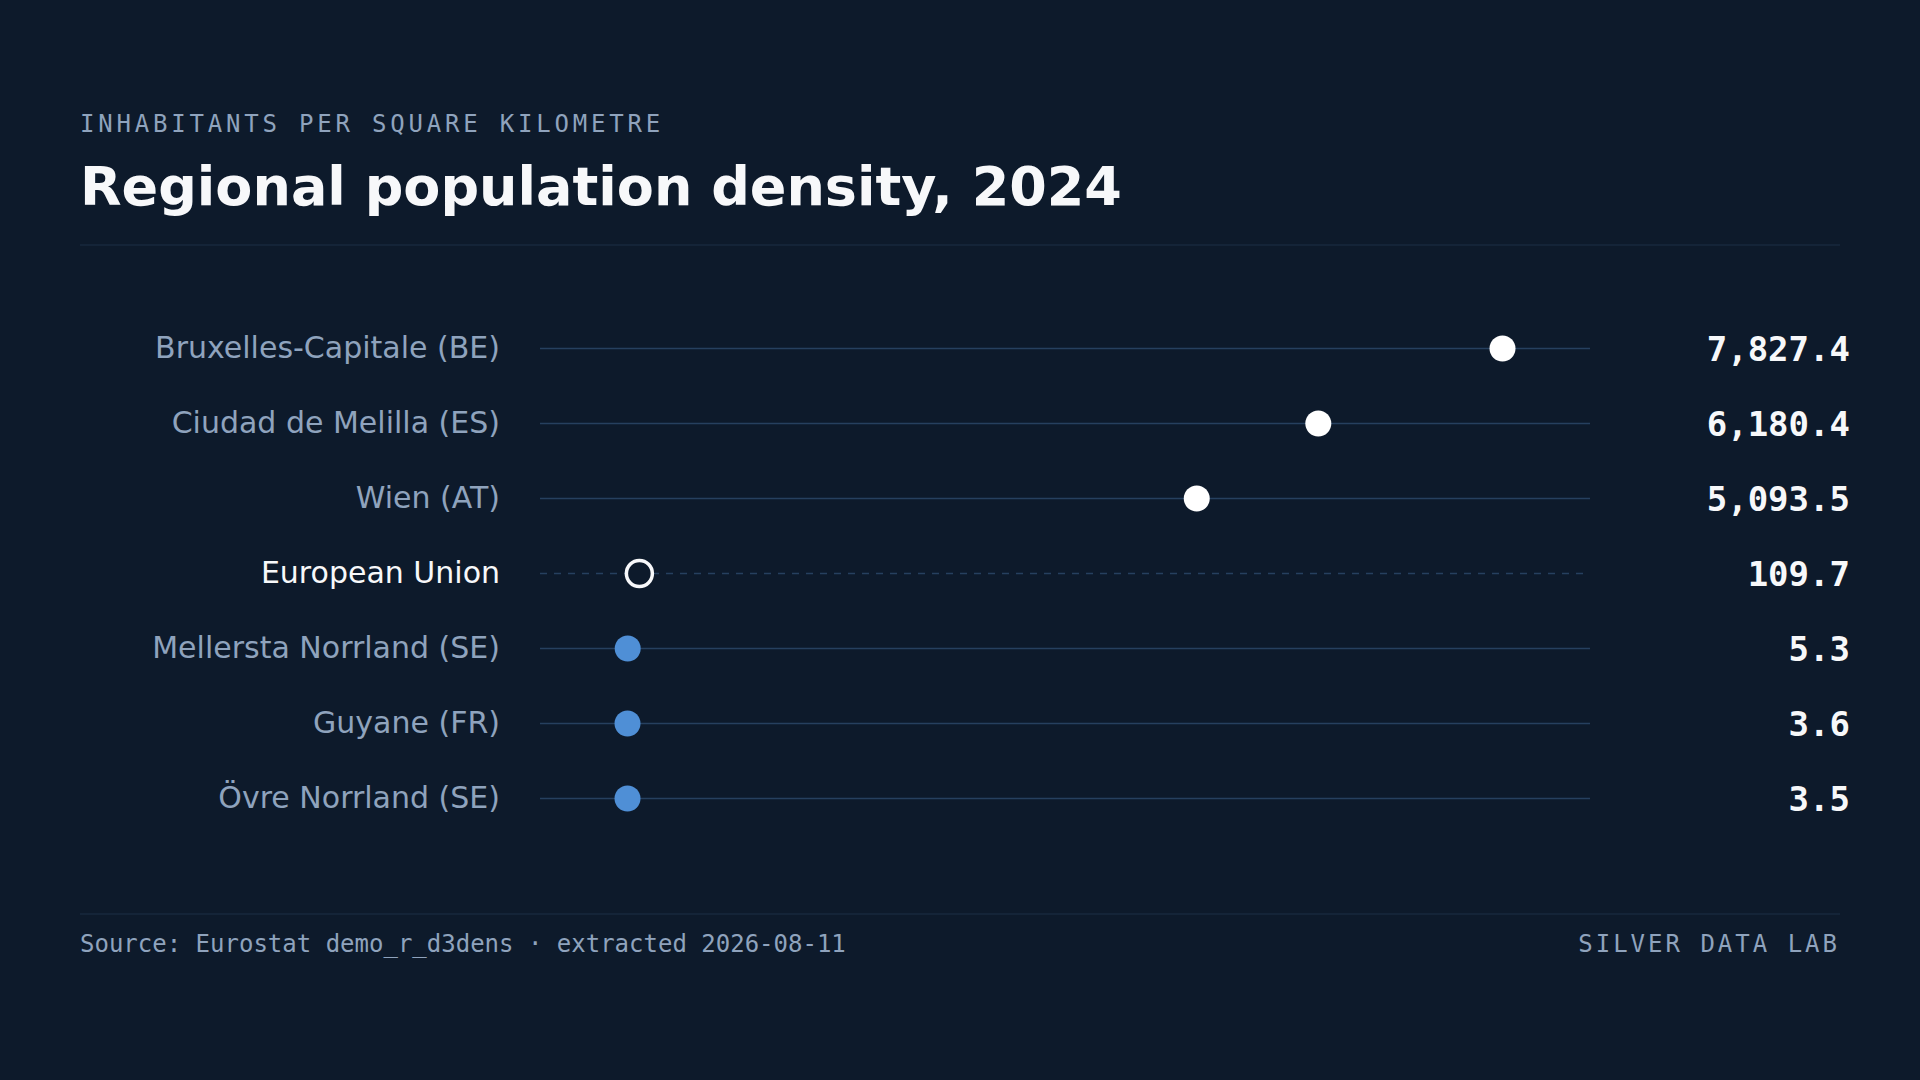
Brussels Is 2,200 Times More Crowded Than Northern Sweden
The EU averages 109.7 inhabitants per square kilometre.
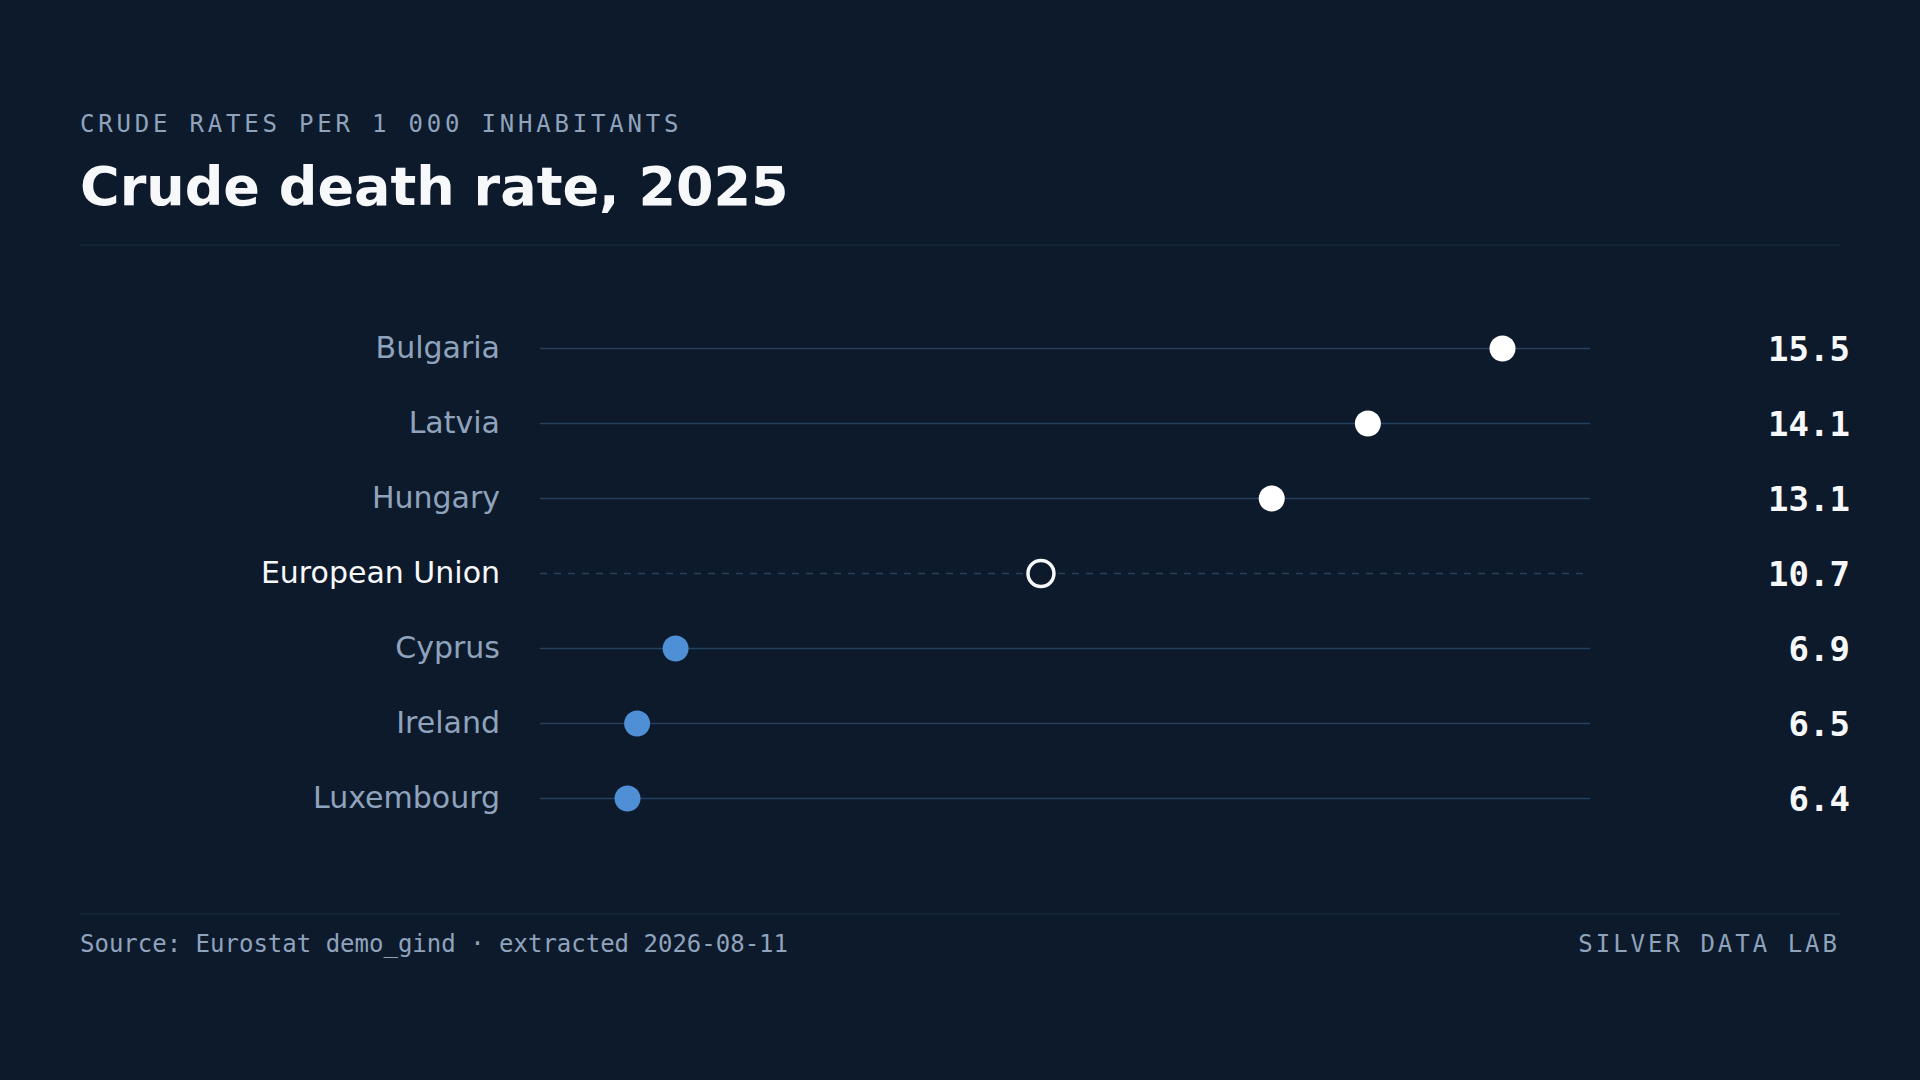
Deaths Outnumber Births in Twenty-One EU Countries
The EU recorded 7.7 births and 10.7 deaths per thousand inhabitants in 2025: a natural change of −3.0.
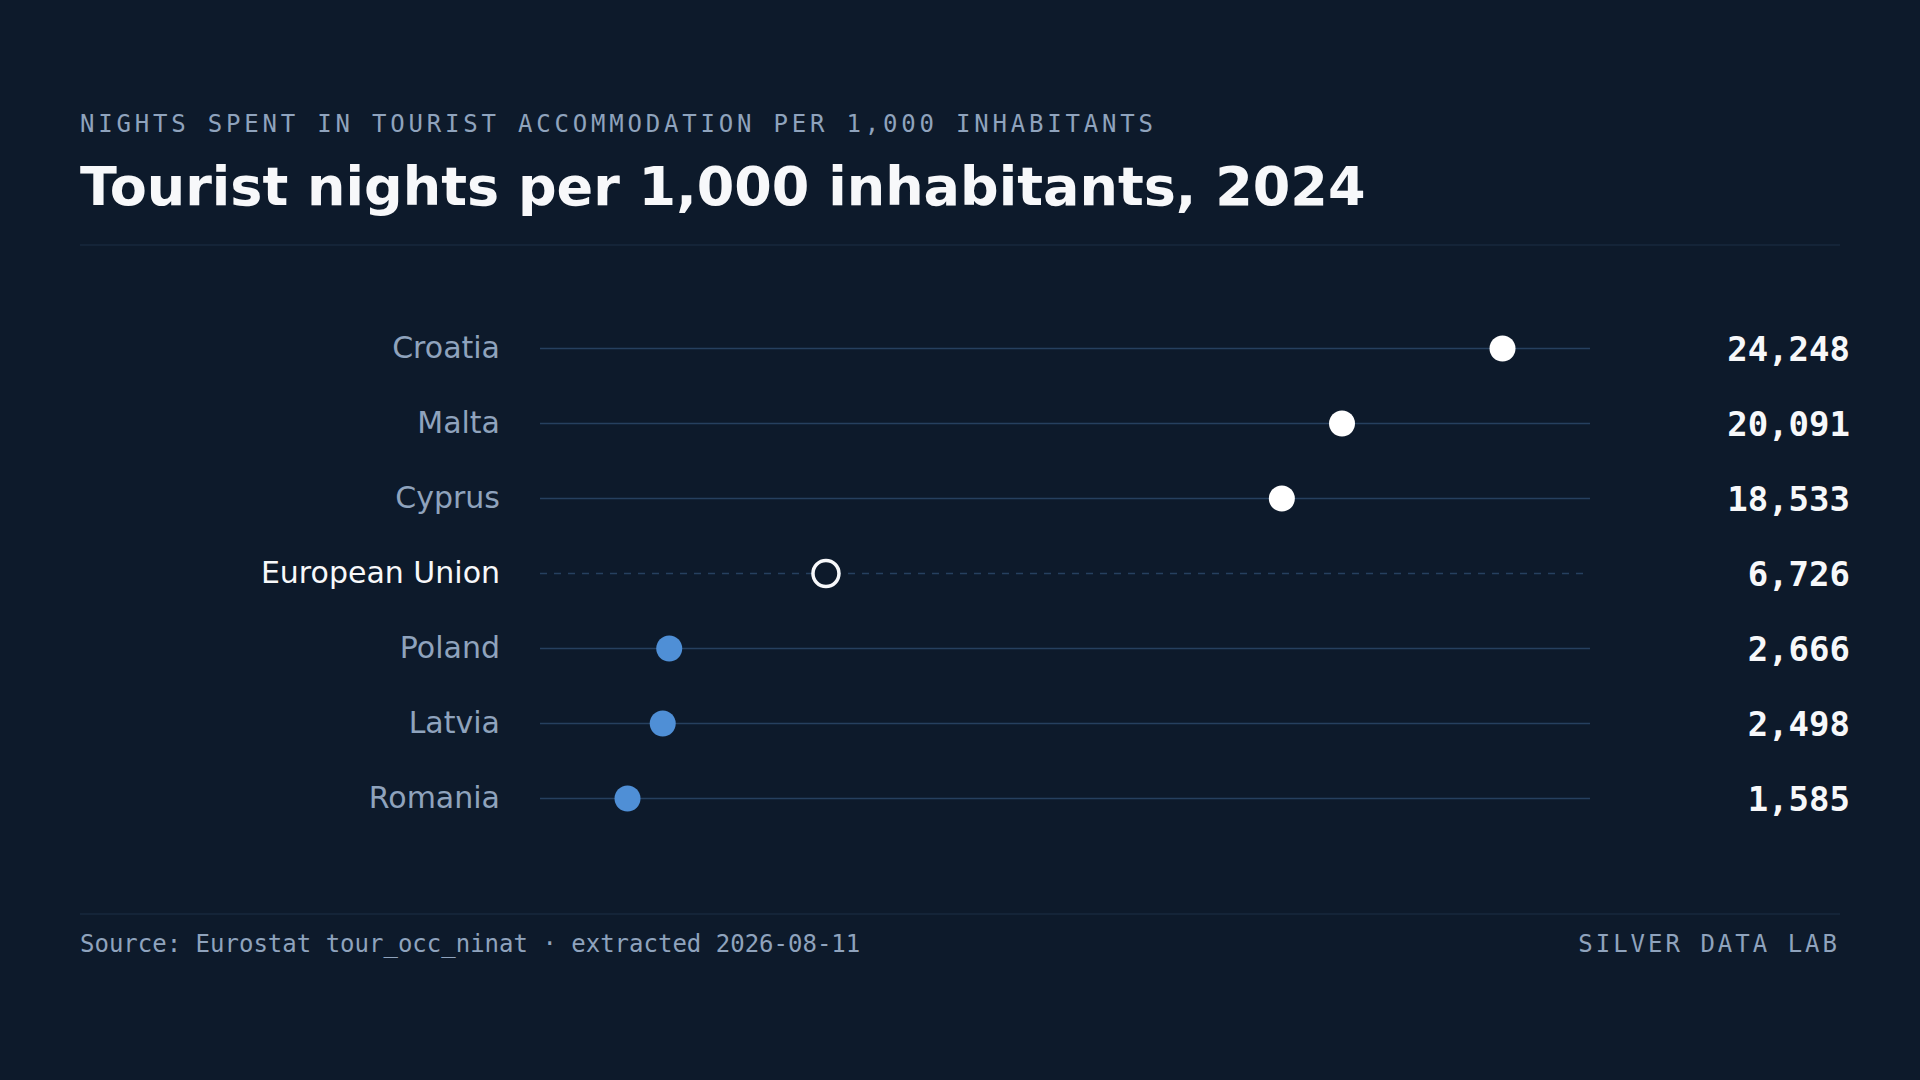
For Its Population, Croatia Has the Most Tourist Overnight Stays in the EU
The EU recorded 6,978 tourist nights per 1,000 inhabitants in 2025, about 7.0 nights per resident.
Studies where the same country leads or trails
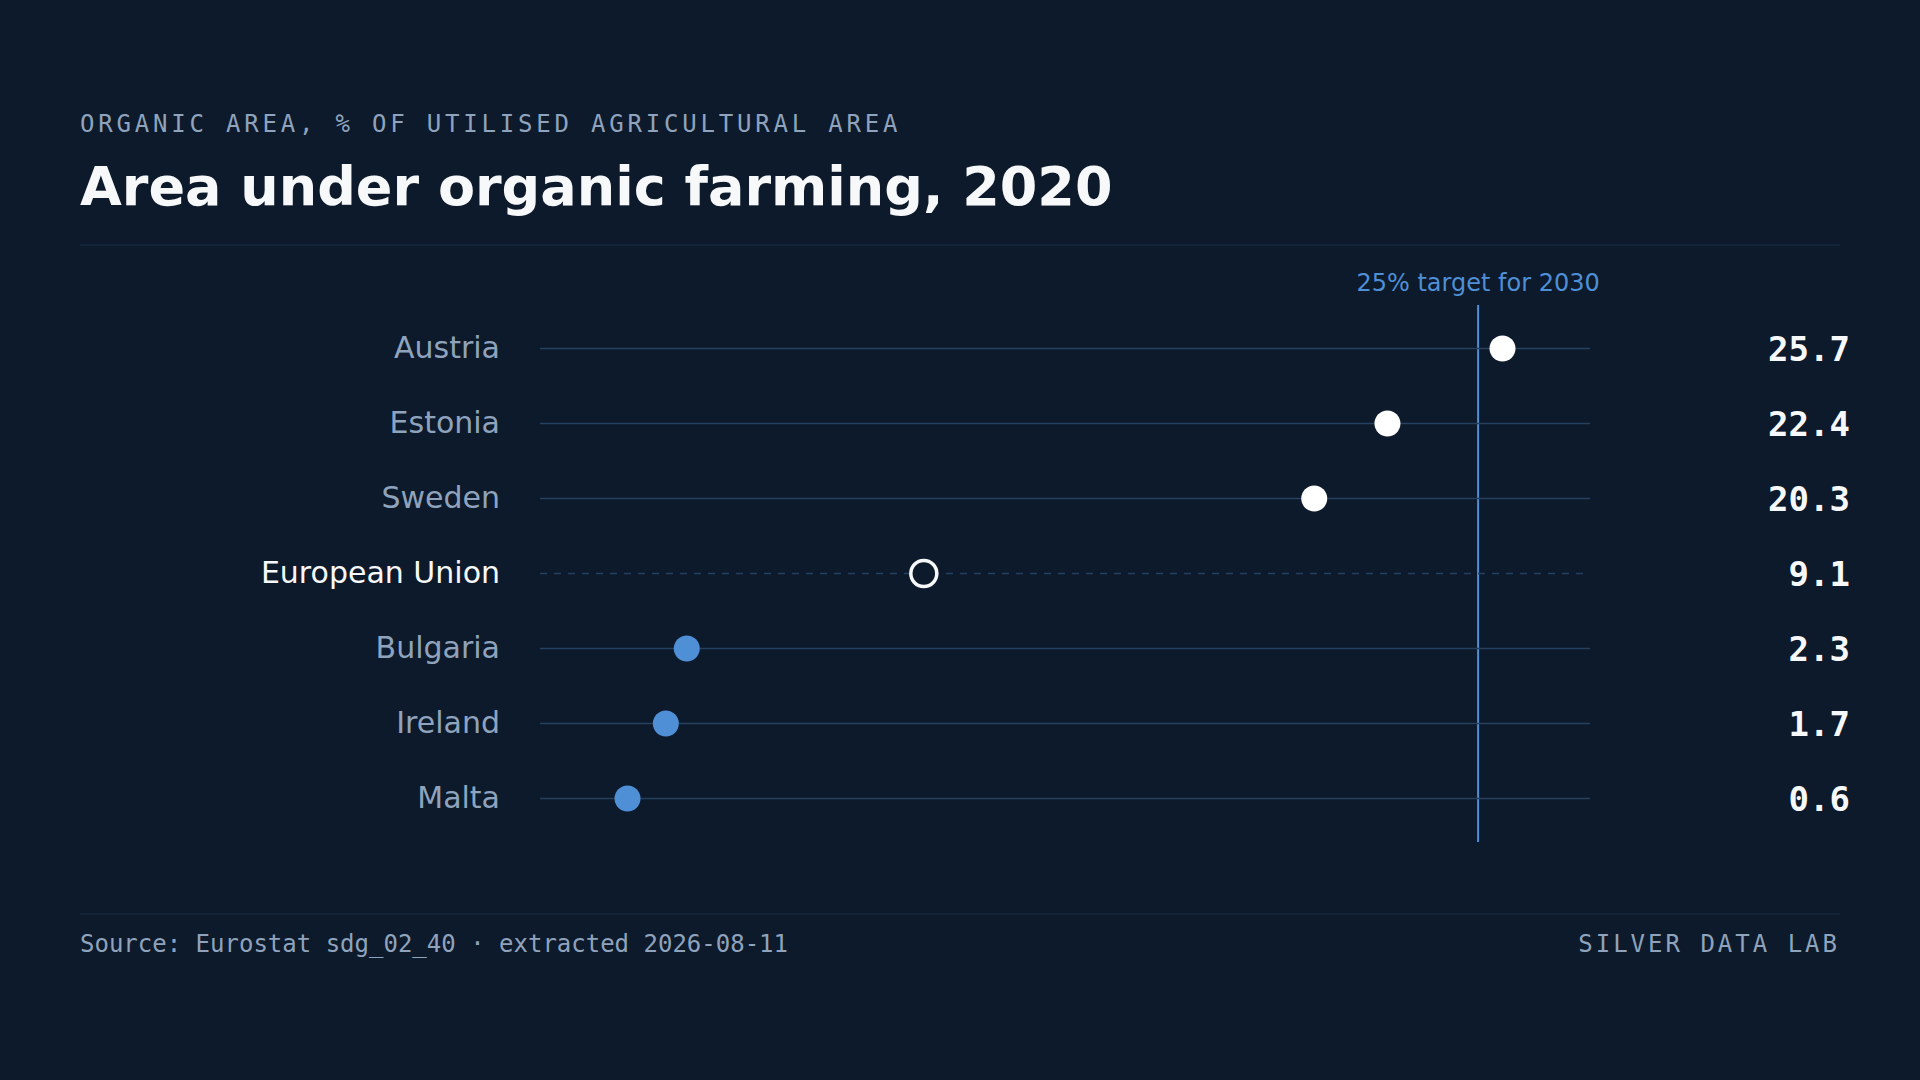
Austria Already Farms a Quarter of Its Farmland Organically
9.1% of the EU's utilised agricultural area was under organic management in 2020, against a target of 25% by 2030.
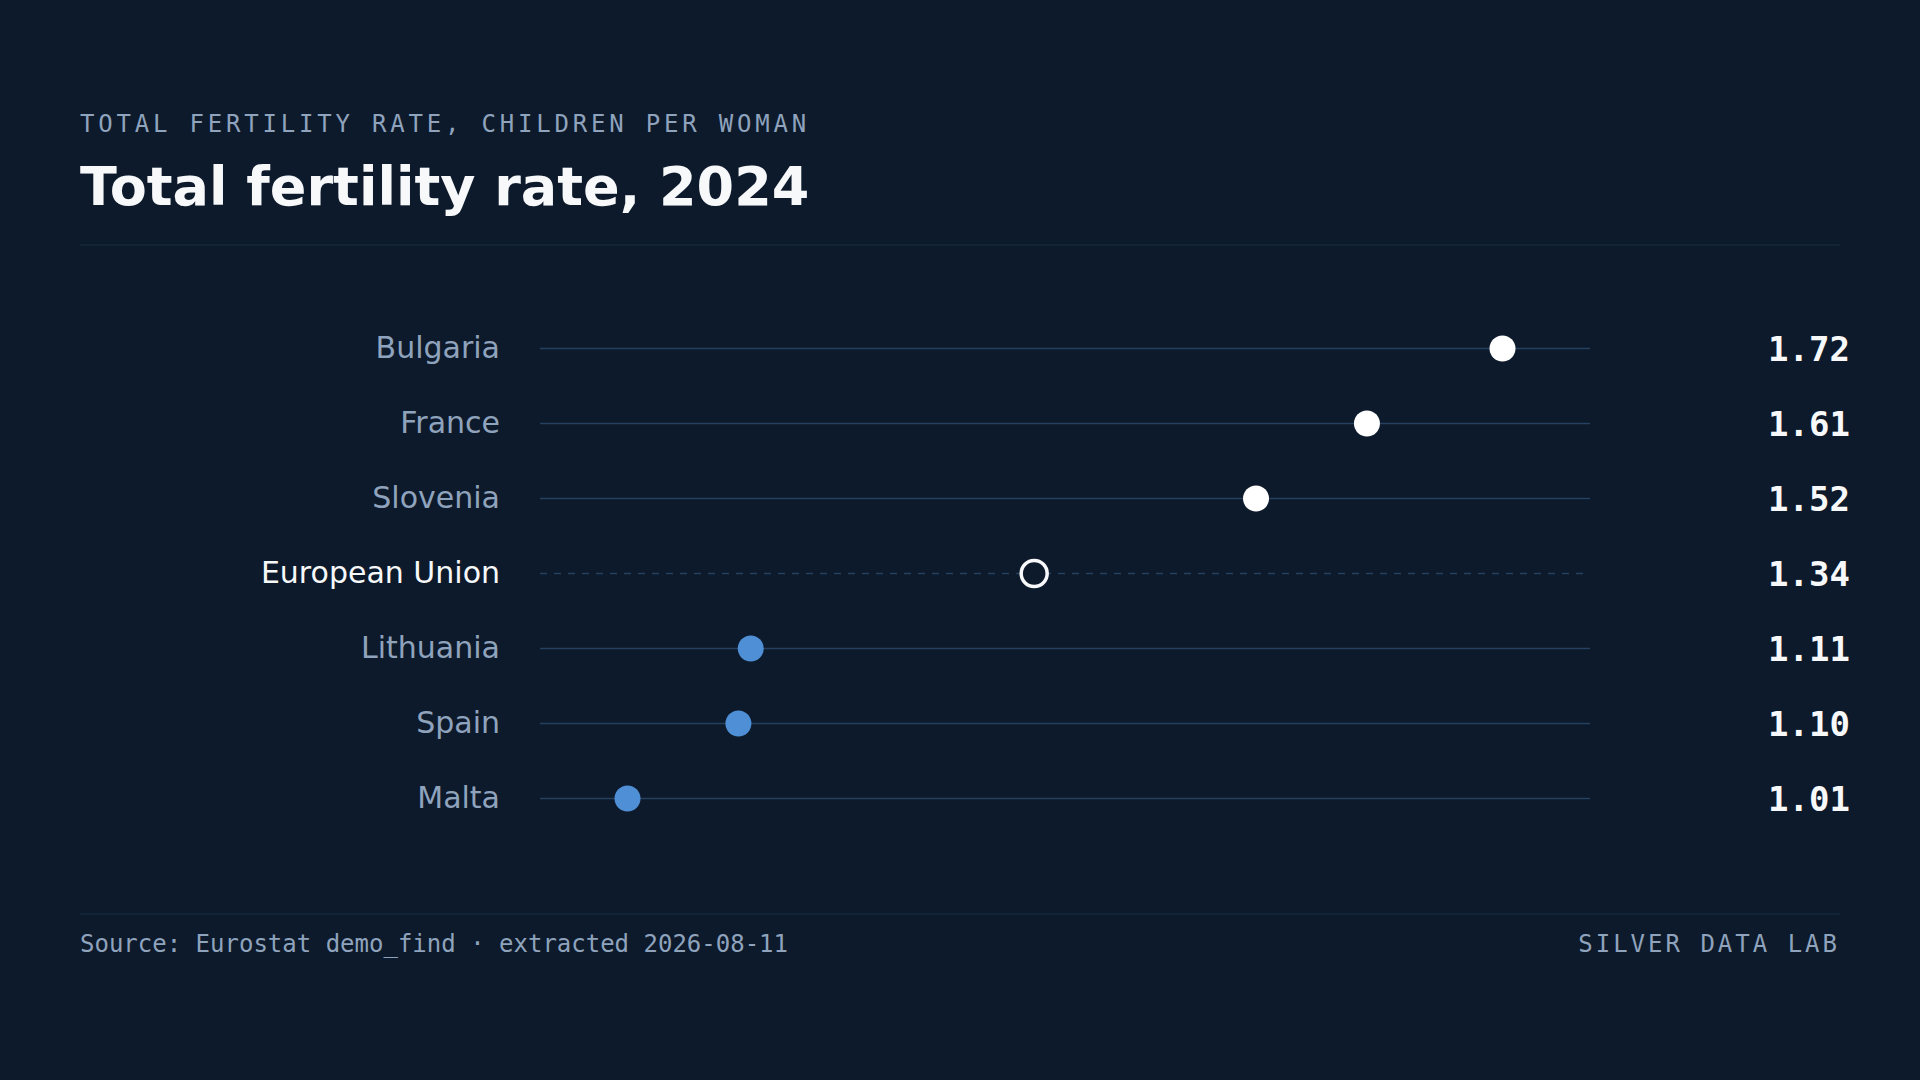
In No EU Country Are Enough Babies Born to Replace Their Parents
The EU total fertility rate was 1.34 children per woman in 2024, against the 2.1 conventionally taken as replacement level.
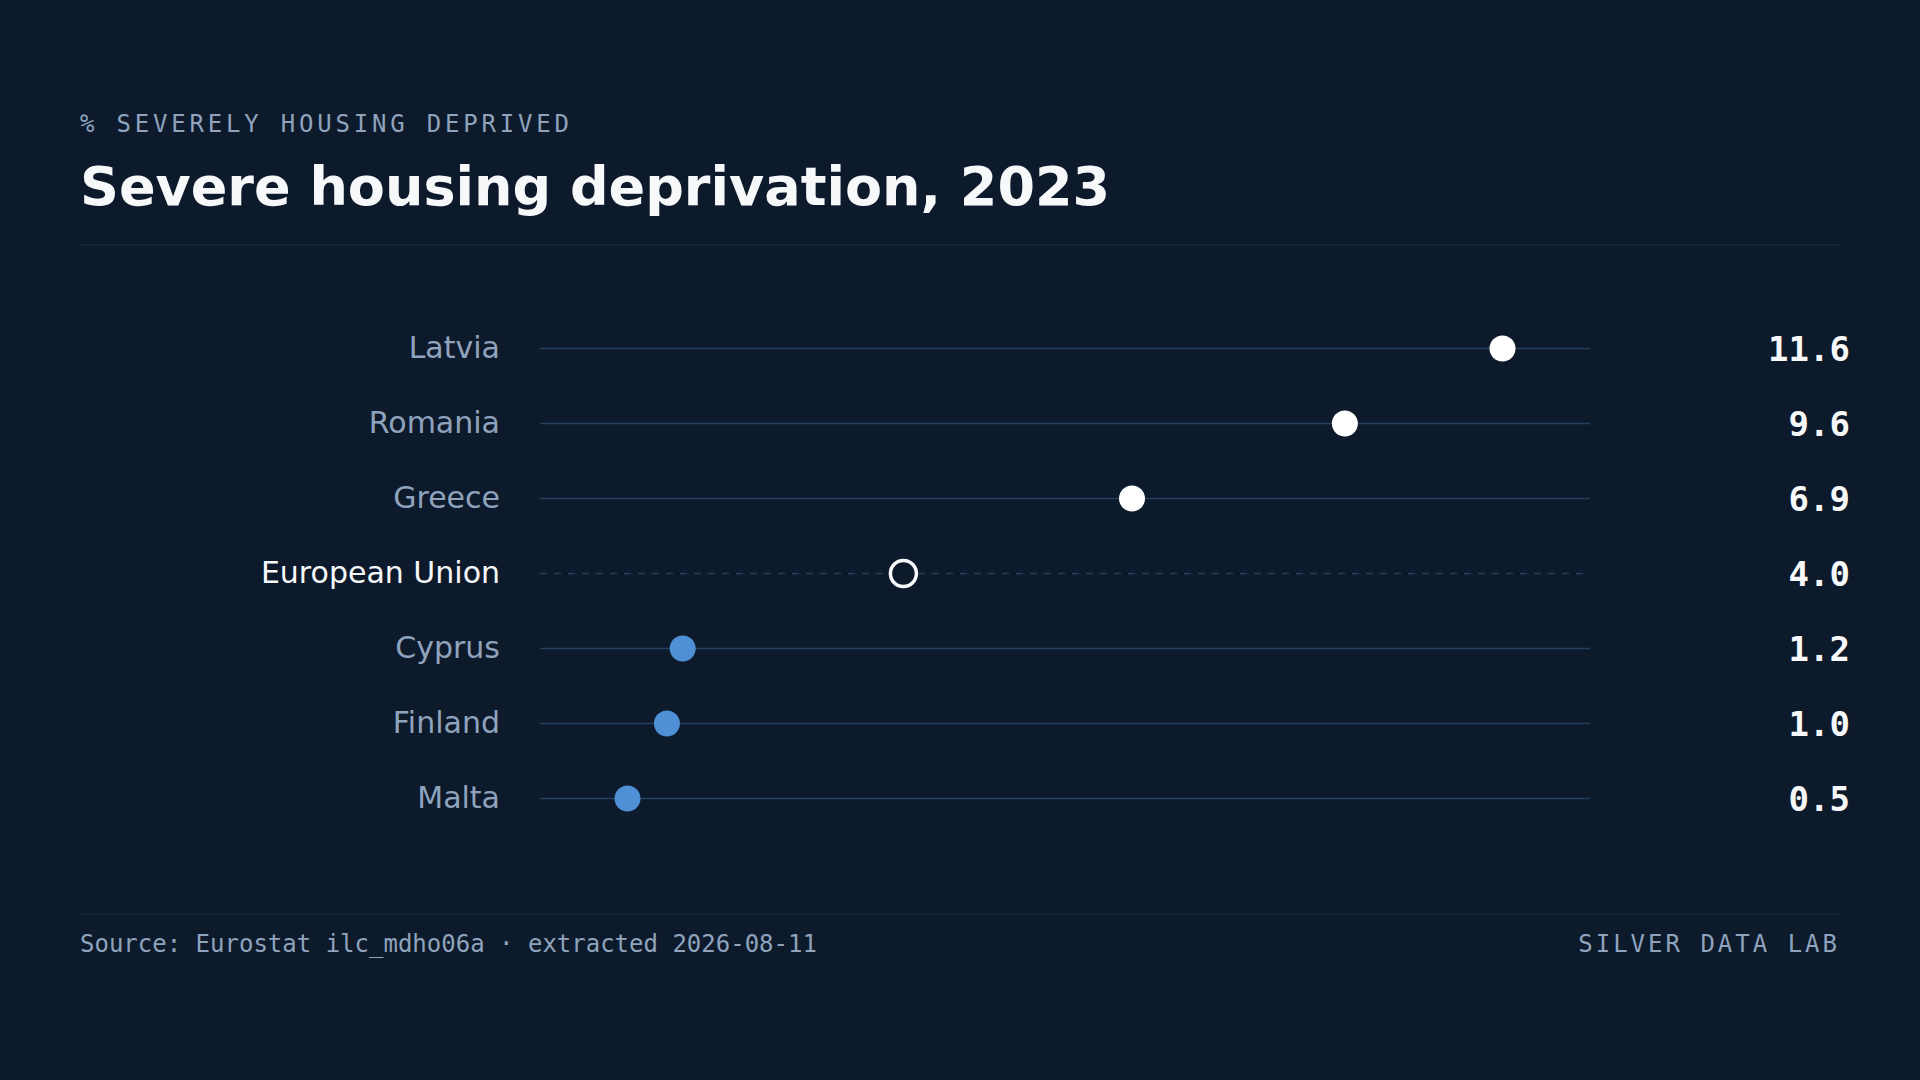
More Than One Latvian in Nine Lives in a Crowded, Run-Down Home
4.0% of the EU population lived in severely deprived housing in 2023.