EU Travellers Cover Seven in Ten Kilometres by Car Rather Than Bus or Train
Silver Data Lab Research Desk · Statistical analysis · Published on 26 July 2026
This study is open to members only
Its sources, filters and extraction date are declared above, as they are for every study. Sign in to read the analysis in full.
- Data source
- Eurostat
- Reference period
- 2024
- Last updated
- 12 October 2026
Re-checked against the source on 12 October 2026. No value in its datasets has moved between the snapshots we hold. Every revision we have observed →
Key estimates
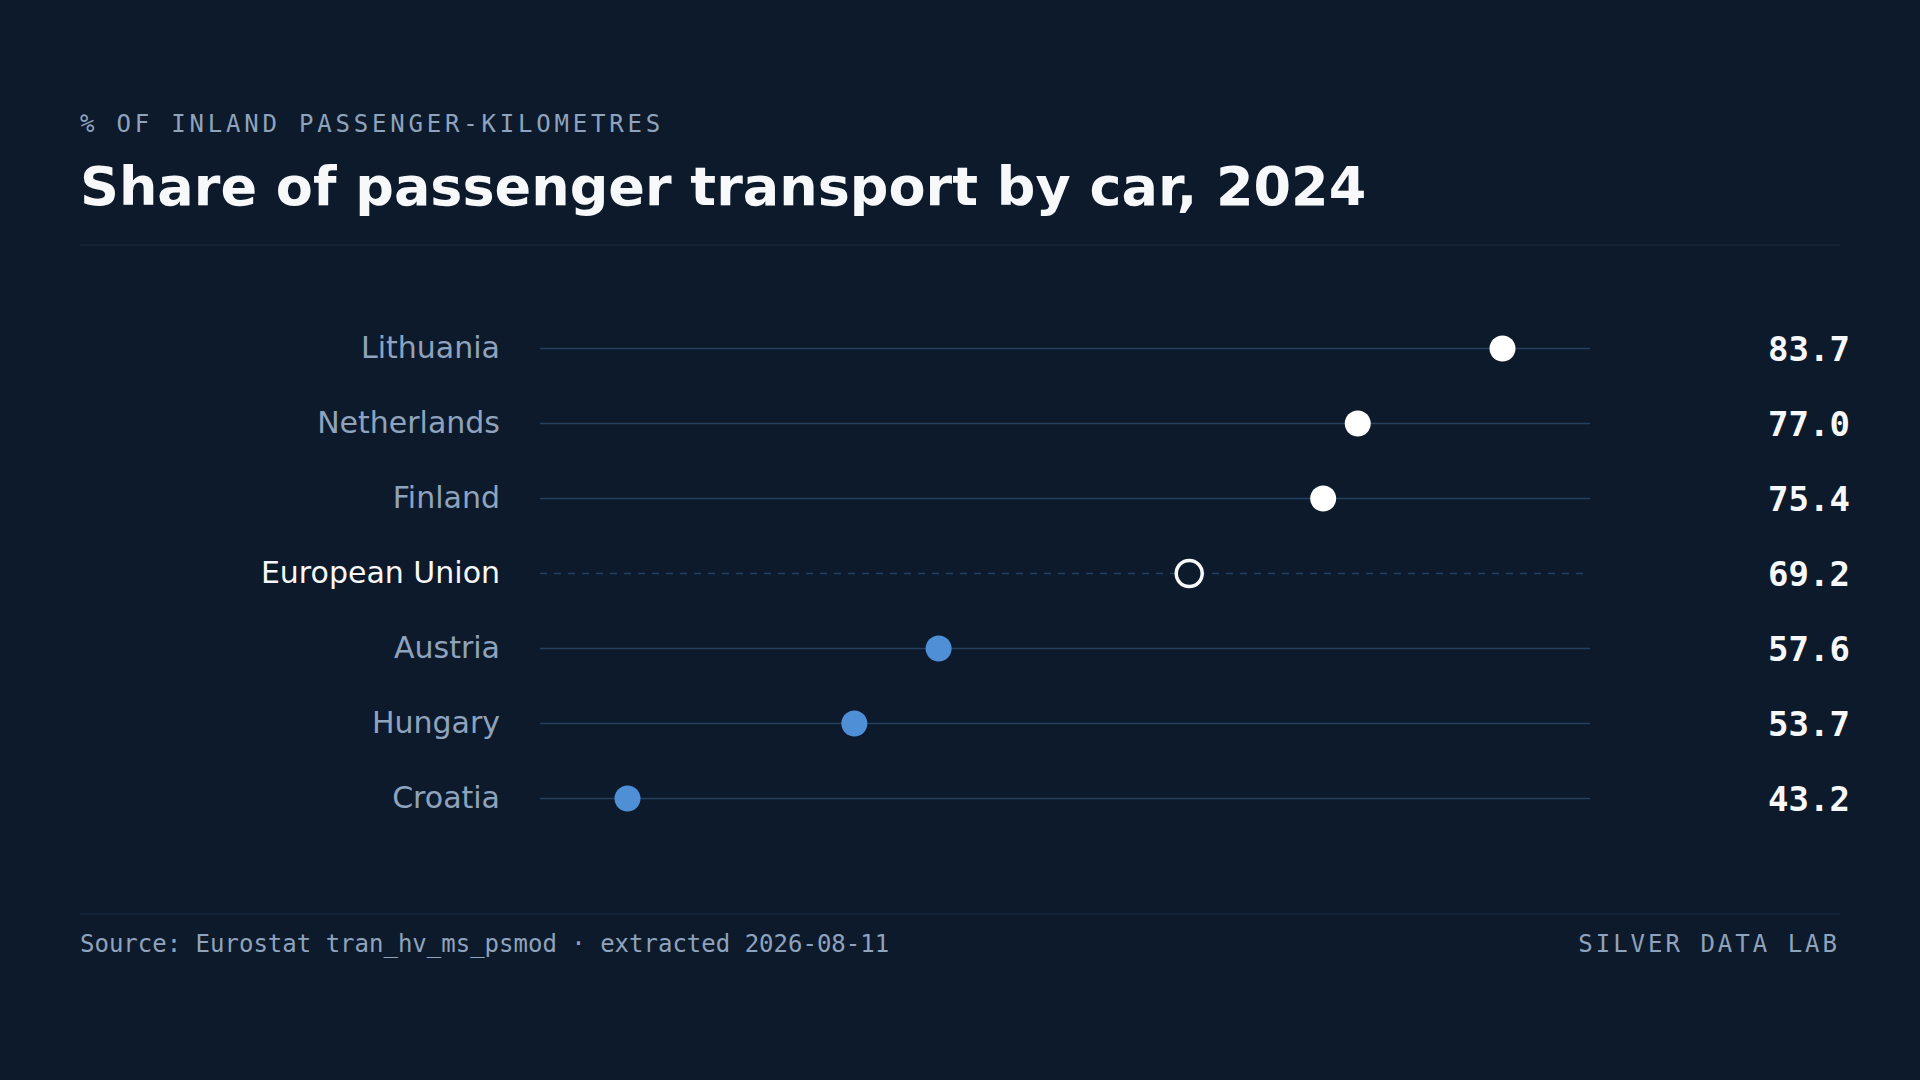
- Cars accounted for 69.2% of EU passenger-kilometres in 2024, on a measure that counts flights and ferries alongside cars, buses and trains.
- Lithuania is the most car-dependent Member State at 83.7%, followed by the Netherlands at 77.0% and Finland at 75.4%.
- Croatia is the only Member State below half, at 43.2% — because 45.6% of Croatian passenger-kilometres are flights.
- Hungary at 53.7% and Austria at 57.6% are the only others below 60%.
- The Netherlands ranks second for car use despite its cycling reputation — because this measure counts distance, not trips.
A measure of distance, not of trips
Modal split describes how a country's passenger transport divides between cars, buses and coaches, trains, ferries and aircraft. It is measured in passenger-kilometres: one person travelling one kilometre.
That construction matters more than it first appears. A short cycle to a shop and a two-hundred-kilometre drive are not weighted equally, and cycling does not appear in this indicator at all. The measure describes where distance is covered, not how often people choose each mode.
Across the EU, cars carried 69.2% of passenger-kilometres in 2024, on the measure that counts flights and ferries alongside the inland modes.
The most car-dependent Member States
Lithuania records 83.7%, the highest in the Union. The Netherlands follows at 77.0%, Finland at 75.4%, Germany at 74.6% and Italy at 74.0%.
The Netherlands in second place is the observation that catches attention, given its reputation for cycling. It is not a contradiction: cycling covers short distances that contribute little to total passenger-kilometres, and Dutch cars still cover the long ones. A country can be known for cycling and remain heavily car-dependent by this measure, because the measure is about kilometres.
The exceptions
Croatia records 43.2%, the only Member State where cars carry less than half of passenger transport. Hungary follows at 53.7% and Austria at 57.6%.
Hungary and Austria are first and second in the Union on rail, at 11.3% and 10.4% of passenger-kilometres, and that is where part of their displaced distance goes. Croatia's figure is a different thing altogether. Its rail share is 2.1%, twenty-first of the twenty-five Member States that report the mode, and its buses and coaches carry 6.8%, below the Union's 7.3%. What fills the gap is flying: 45.6% of Croatian passenger-kilometres are covered by aircraft, against 15.8% for the EU. On the inland modes alone Croatian cars carry 83.0%, and no Member State falls below half.
Across the Union the two rankings are unrelated. The rank correlation between car share and rail share is close to zero, so a low car share tells you nothing on its own about the strength of a railway.
What the indicator cannot settle
A high car share can reflect geography, settlement density, the state of public transport, or income. This measure records the outcome without separating those causes, and countries at similar levels may arrive there for opposite reasons: a sparsely populated country where alternatives are impractical, and a dense one where they exist but are not used.
Share of passenger transport by car, 2024
| Country | % of passenger-kilometres | Gap to EU averagepercentage points, derived |
|---|---|---|
| Lithuania | 83.7e | +14.5 |
| Netherlands | 77.0e | +7.8 |
| Finland | 75.4 | +6.2 |
| European Unionaggregate | 69.2be | — |
| Austria | 57.6e | −11.6 |
| Hungary | 53.7ep | −15.5 |
| Croatia | 43.2 | −26.0 |
Flags carried by the source on these values: be break in time series, estimated · e estimated · ep estimated, provisional
This table as data: CSV · JSON
Every Member State for this indicator+
Members see every Member State for this indicator here, not only the rows the ranking prints. Become a Member
What these figures cannot tell you
- Passenger-kilometres, not journeys
- One person travelling one kilometre is the unit, so long journeys dominate the measure. Short trips by any mode contribute little, which is why a country can be both cycling-intensive and car-dependent on this indicator.
- Cycling and walking are absent
- The indicator covers cars, buses and coaches, trains, ferries and aircraft. Active travel does not appear, so the shares here describe the division of motorised distance rather than of all mobility.
- Air and sea are counted in the total
- The table used here divides each mode by all passenger-kilometres, flights and ferries included, so a Member State where much distance is flown records a lower car share than it would on the inland modes alone. Eurostat publishes both, and the EU reads 69.2% here against 82.5% with air and sea taken out. The ranking changes with the basis: Croatia is last here and above the Union figure on the inland one.
- Estimation methods differ
- Passenger-kilometres by car are estimated rather than counted, using vehicle surveys and traffic models that vary between Member States. Small differences in the ranking should not be over-read.
Frequently asked questions
- What share of EU transport is by car?
- 69.2% of all passenger-kilometres in 2024, with flights and ferries counted in the total. The measure counts distance travelled, not the number of journeys, so it is not the same as the share of trips made by car.
- Which EU country is most car-dependent?
- Lithuania, at 83.7% of all passenger-kilometres in 2024, ahead of the Netherlands at 77.0% and Finland at 75.4%.
- Why does the Netherlands rank so high despite its cycling?
- Because the indicator measures distance. Cycling covers short journeys that add little to total passenger-kilometres, while Dutch cars still cover the long ones. Cycling is not counted in this measure at all.
- Which EU country uses cars least?
- Croatia, at 43.2% in 2024 — the only Member State where cars carry less than half of all passenger-kilometres. The reason is aviation: 45.6% of Croatian passenger-kilometres are flown. On the inland modes alone Croatian cars carry 83.0%.
Methodological note
Modal split is published by Eurostat as the share of each mode in total passenger transport, measured in passenger-kilometres. This study uses the table that covers air, sea and inland transport together, so its five modes are passenger cars, motor coaches and buses, trains, seagoing vessels and aircraft, and they sum to 100%. Eurostat publishes a second table restricted to the inland modes; the figures quoted from it come from its own extraction, declared below.
Values are for 2024, the most recent year with complete coverage of the 27 Member States at the extraction date.
The rail shares quoted for comparison come from the same dataset, extracted separately and declared below, and are the series used by the rail study on this site. The rank correlation between the car and rail rankings is computed by Silver Data Lab across the twenty-five Member States reporting both, and is reported as a correspondence rather than as a causal claim.
Source data
This study draws on 2 datasets from Eurostat. Each can be inspected and re-downloaded from its catalogue, and the filters below are the ones applied.
Modal split of air, sea and inland passenger transport
tran_hv_ms_psmod
- Filters applied:
- freq=A · vehicle=CAR, TRN · unit=PC · time=2024
- Extracted:
- 2026-08-27
- Source last updated:
- 2026-08-26
Modal split of inland passenger transport
tran_hv_psmod
- Filters applied:
- freq=A · vehicle=CAR · unit=PC · time=2024
- Extracted:
- 2026-10-12
- Source last updated:
- 2026-08-26
Download the data
The data the study you have just read is built on, exactly as it was downloaded and archived.
Yours as a Member.
Data downloadable by Members
How to cite
Record the vintage as well as the study: the figures on this page are the ones extracted on the dates below.
Silver Data Lab Research Desk (2026). EU Travellers Cover Seven in Ten Kilometres by Car Rather Than Bus or Train. Silver Data Lab, published 26 July 2026, last updated 12 October 2026. https://www.silverdatalab.com/studies/car-dependency-in-the-eu
- Data: Eurostat, Modal split of air, sea and inland passenger transport (tran_hv_ms_psmod), filters freq=A, vehicle=CAR, TRN, unit=PC, time=2024; extracted 2026-08-27; source last updated 2026-08-26. https://doi.org/10.2908/tran_hv_ms_psmod
- Data: Eurostat, Modal split of inland passenger transport (tran_hv_psmod), filters freq=A, vehicle=CAR, unit=PC, time=2024; extracted 2026-10-12; source last updated 2026-08-26. https://doi.org/10.2908/tran_hv_psmod
Silver Data Lab's analysis is licensed CC BY 4.0. The statistics remain their publisher's and keep its terms of reuse.
Ask the research desk
A question about this study — a definition, a filter, a break in the series, what the figures can and cannot support — answered by the desk that made the extraction.
Members can write to the research desk
Other studies on the same dataset
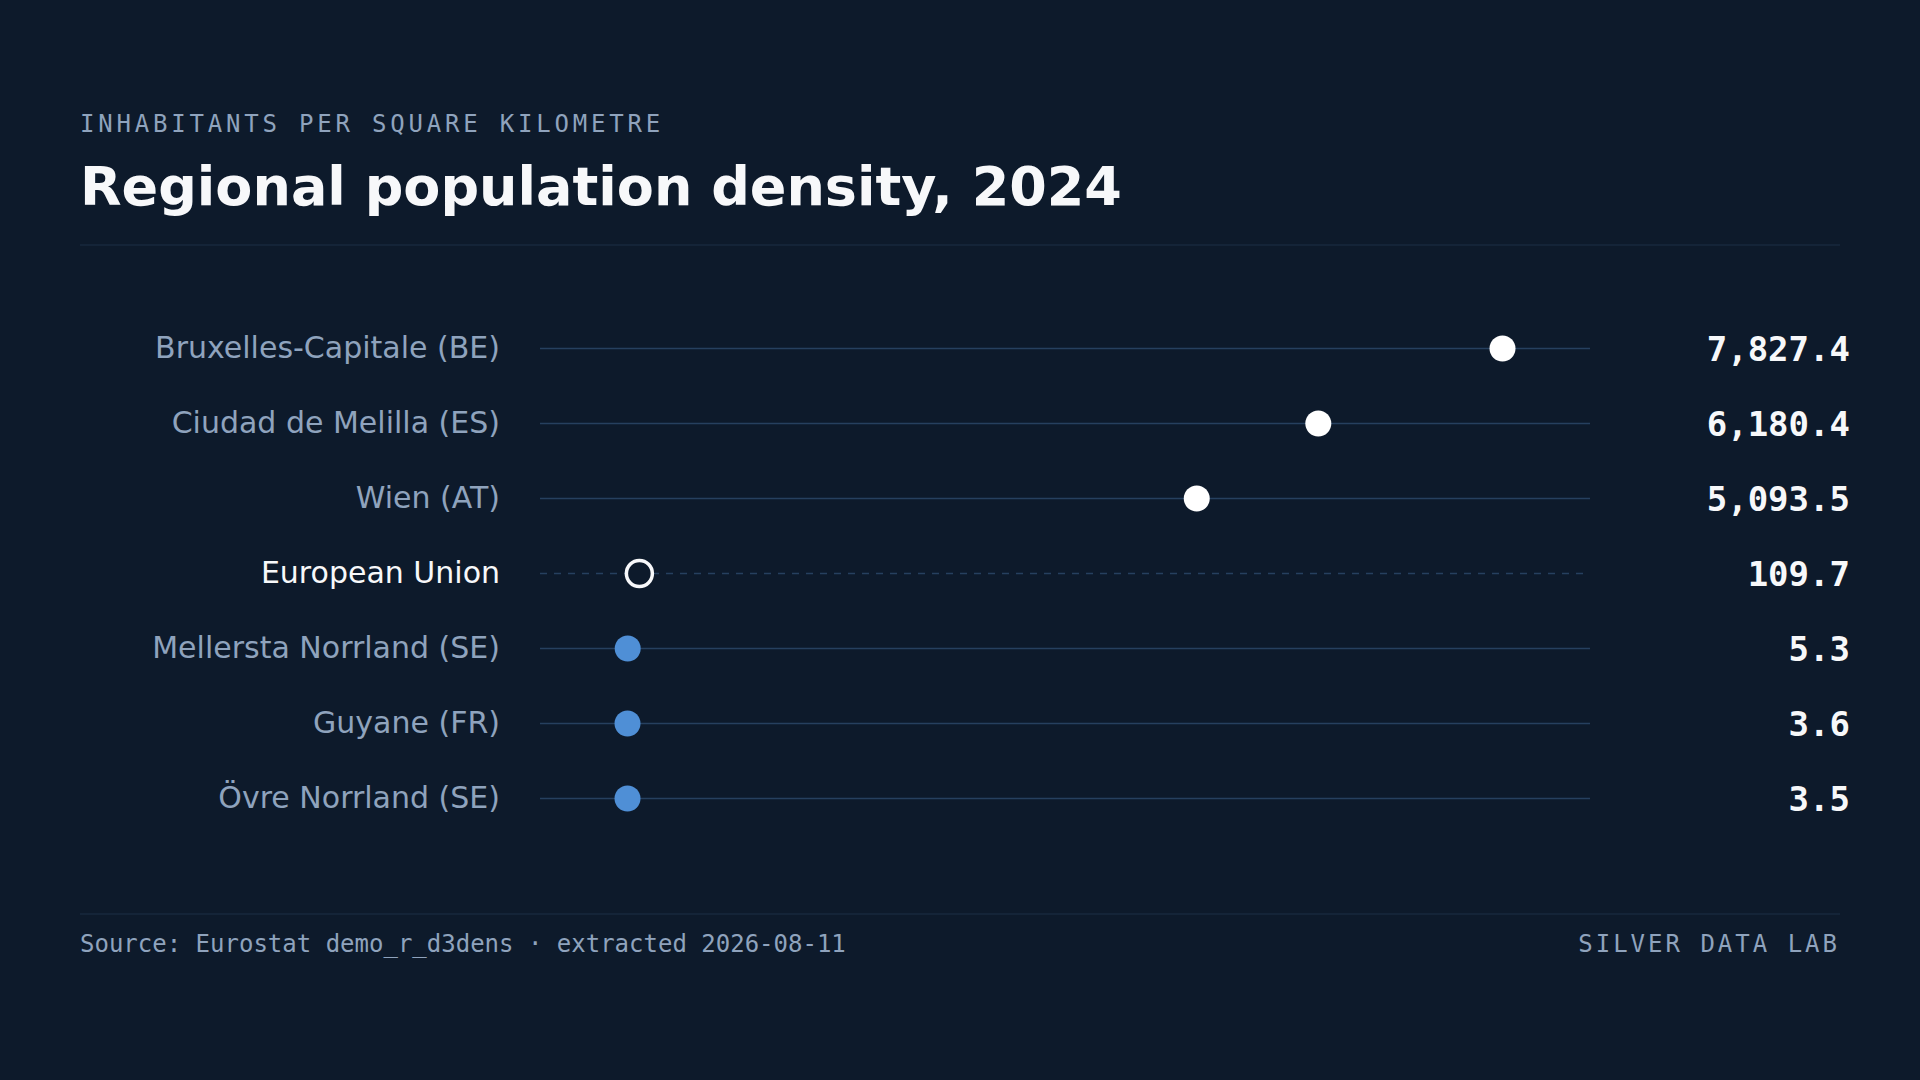
Brussels Is 2,200 Times More Crowded Than Northern Sweden
The EU averages 109.7 inhabitants per square kilometre.
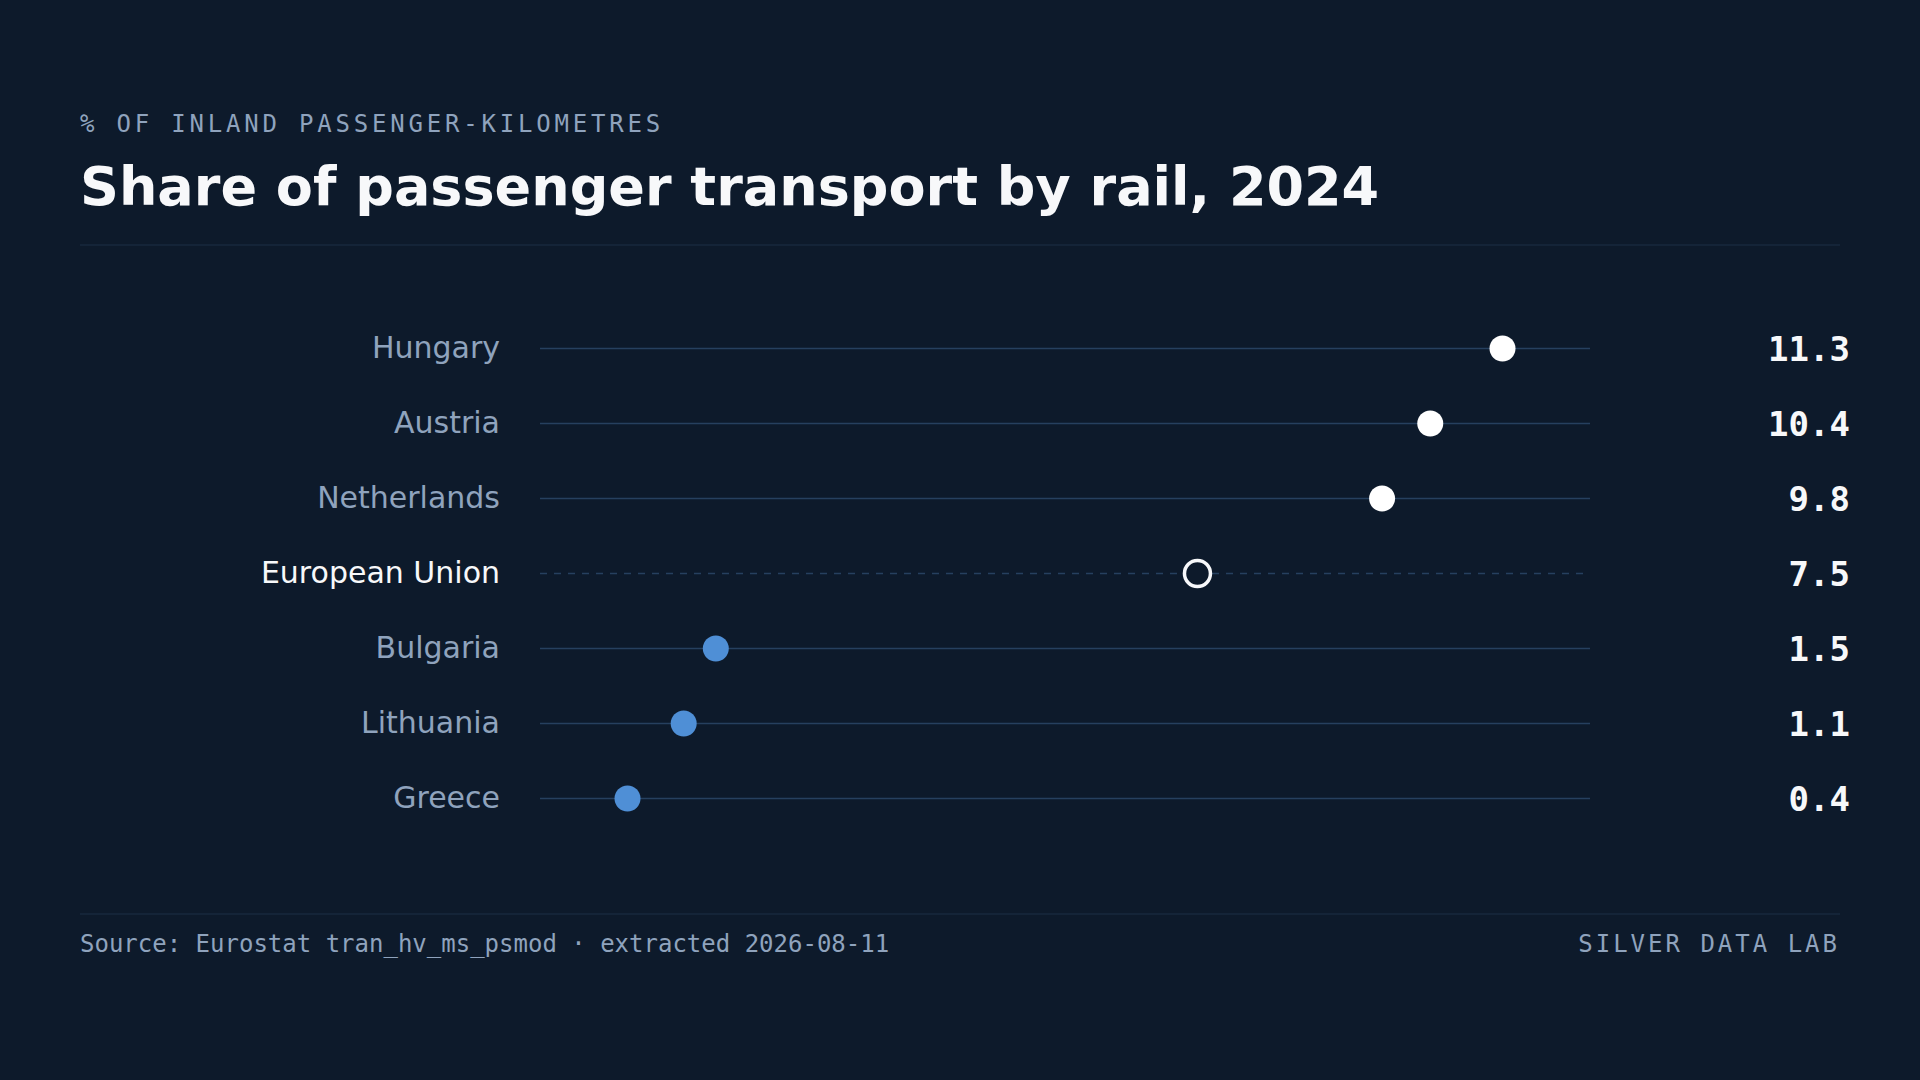
Two EU Countries Have No Railway at All
Trains carried 7.5% of EU passenger-kilometres in 2024, on a measure that counts flights and ferries alongside cars, buses and trains.
Studies where the same country leads or trails
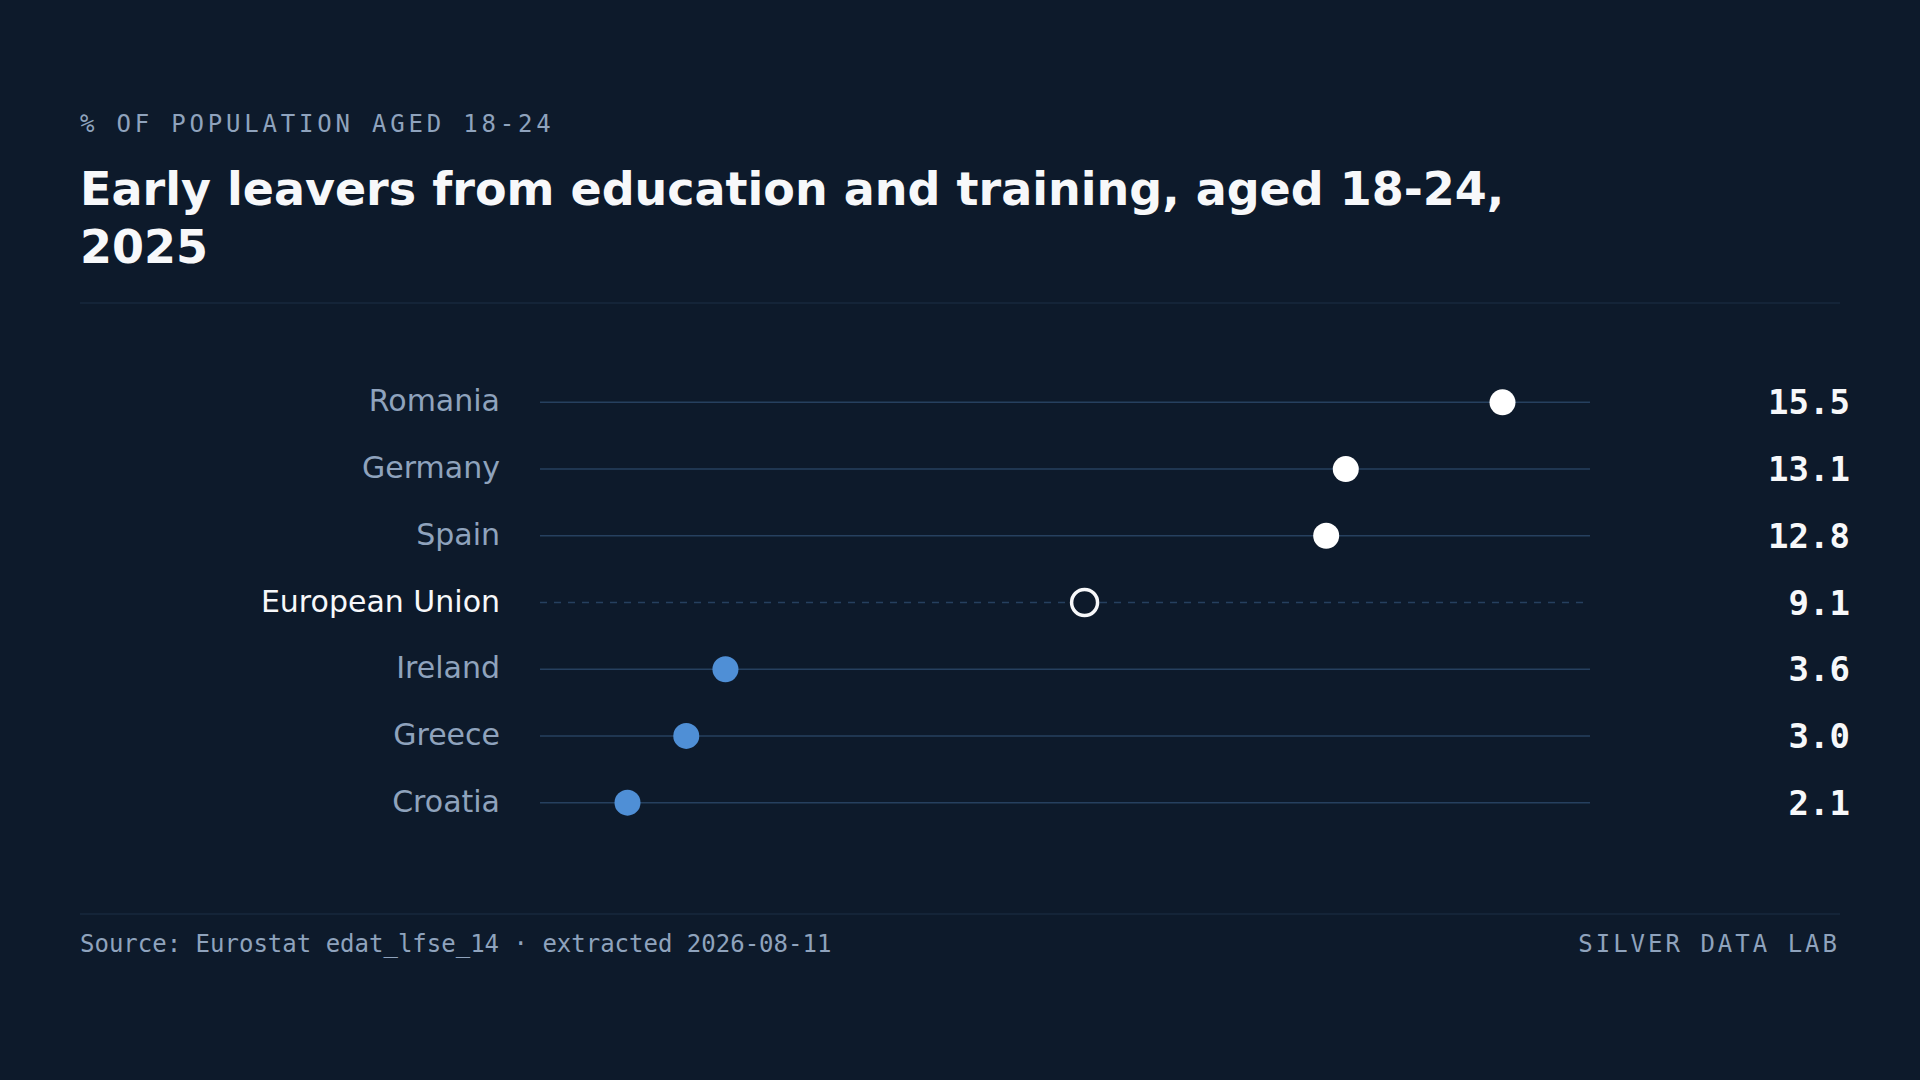
Germany Has the EU's Second-Worst School Dropout Rate
9.1% of people aged 18 to 24 in the EU had left education with at most lower secondary schooling in 2025.
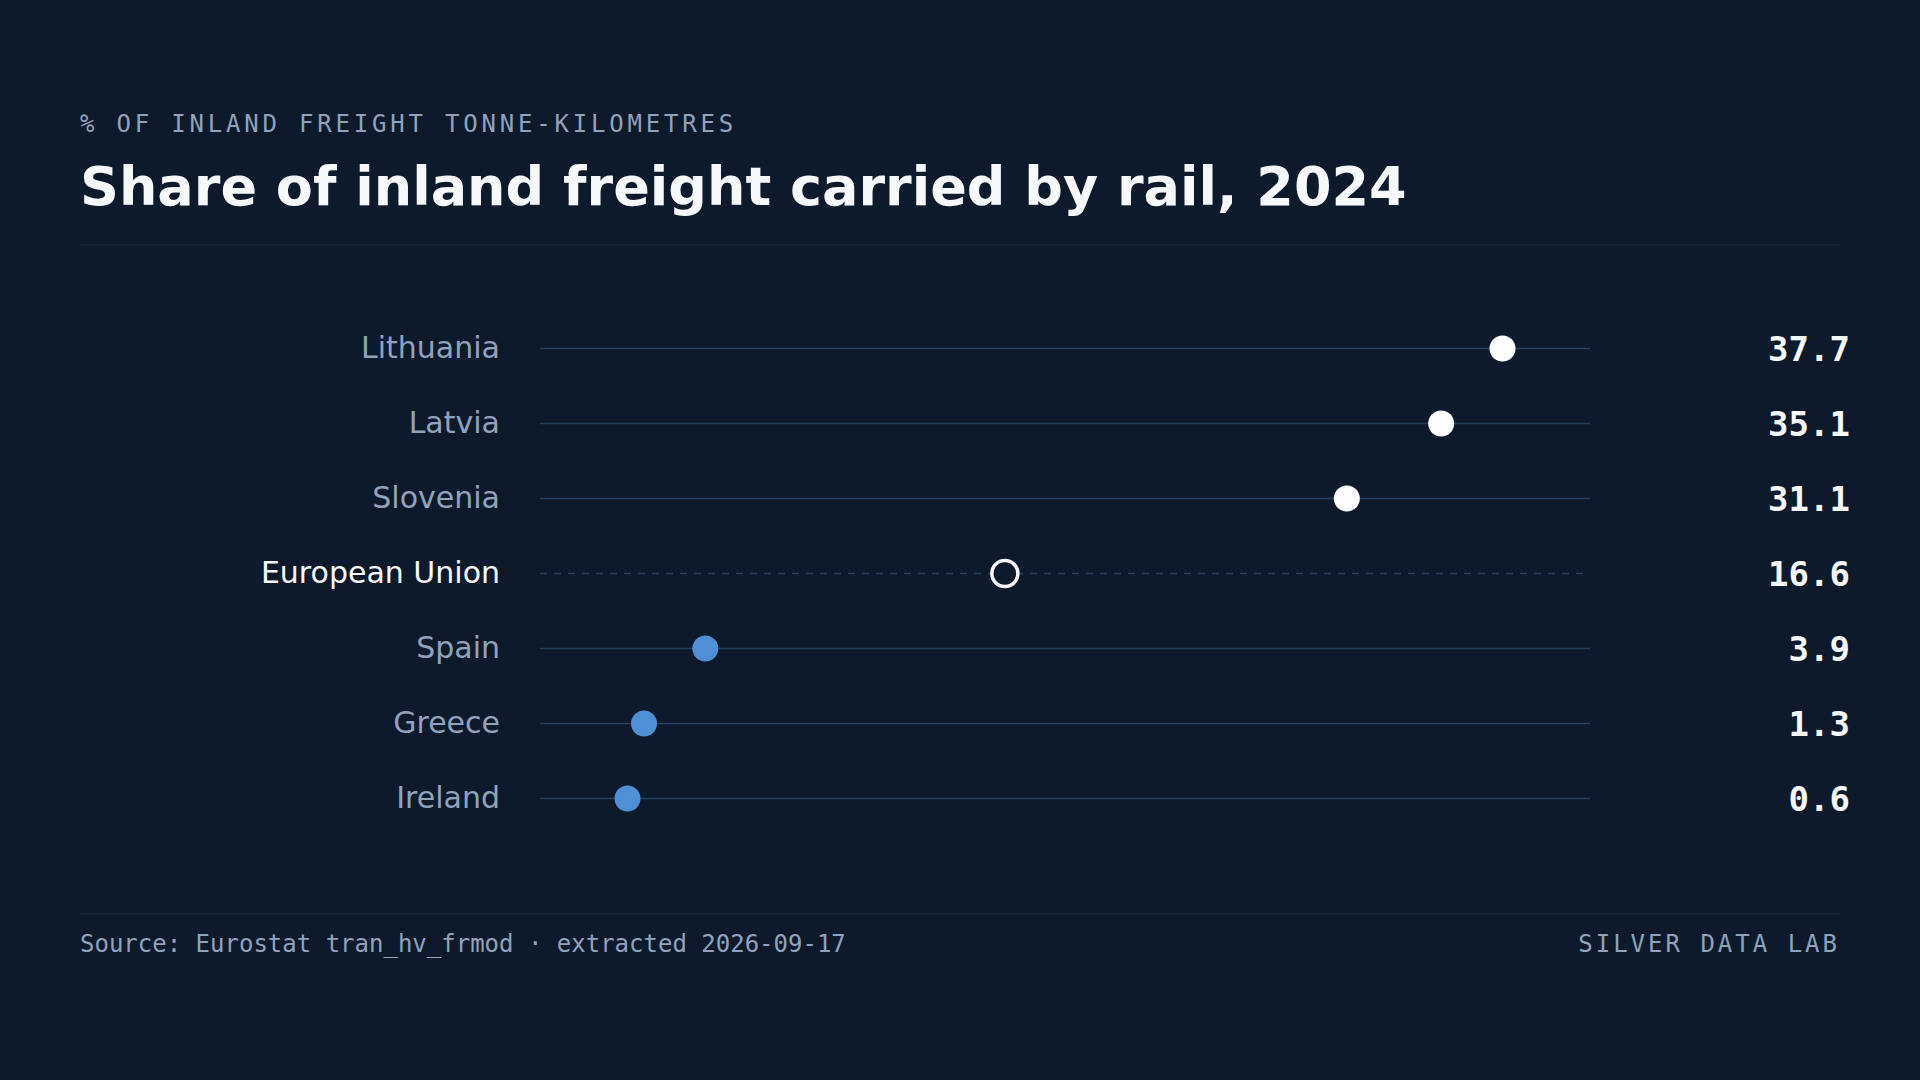
Lithuania Moves More of Its Freight by Rail Than Any Other EU Country
Rail carried 16.6% of inland freight across the EU in 2024, measured in tonne-kilometres; road carried 78.2% and inland waterways 5.2%.
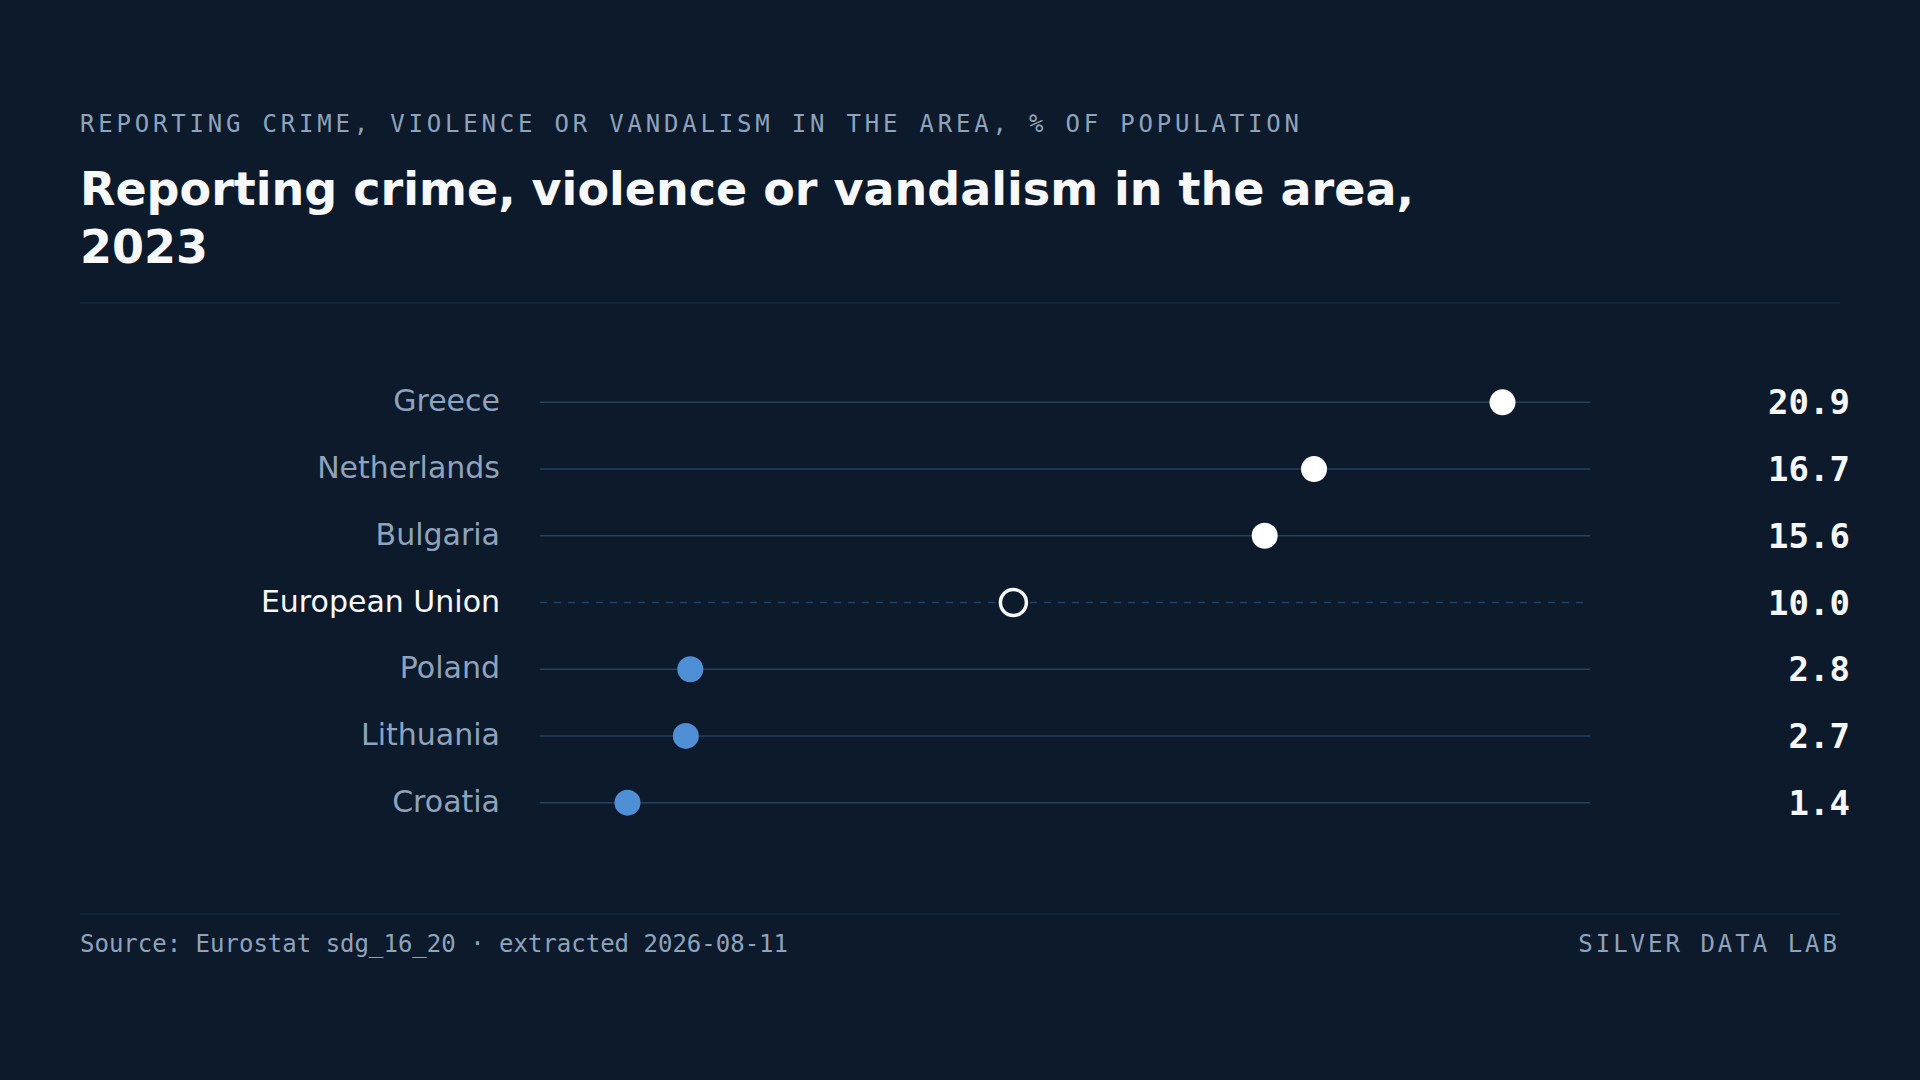
The Dutch Are Likelier Than Bulgarians to Say Crime Is a Problem Locally
10.0% of the EU population reported crime, violence or vandalism in their area in 2023.