Poland Gives Families More of Its Social Spending Than Any Other EU Country
Silver Data Lab Research Desk · Statistical analysis · Published on 08 October 2026
- Data source
- Eurostat
- Reference period
- 2025
- Last updated
- 24 October 2026
Re-checked against the source on 24 October 2026. 561 values in its datasets moved between snapshots, 132 of them figures stated on this page. Every revision we have observed →
Key estimates
- In 2025 the EU paid 8.7% of its social protection benefits under the family and children function, against 8.0% in 2015. Like every 2025 value in both Eurostat tables, it is an estimate.
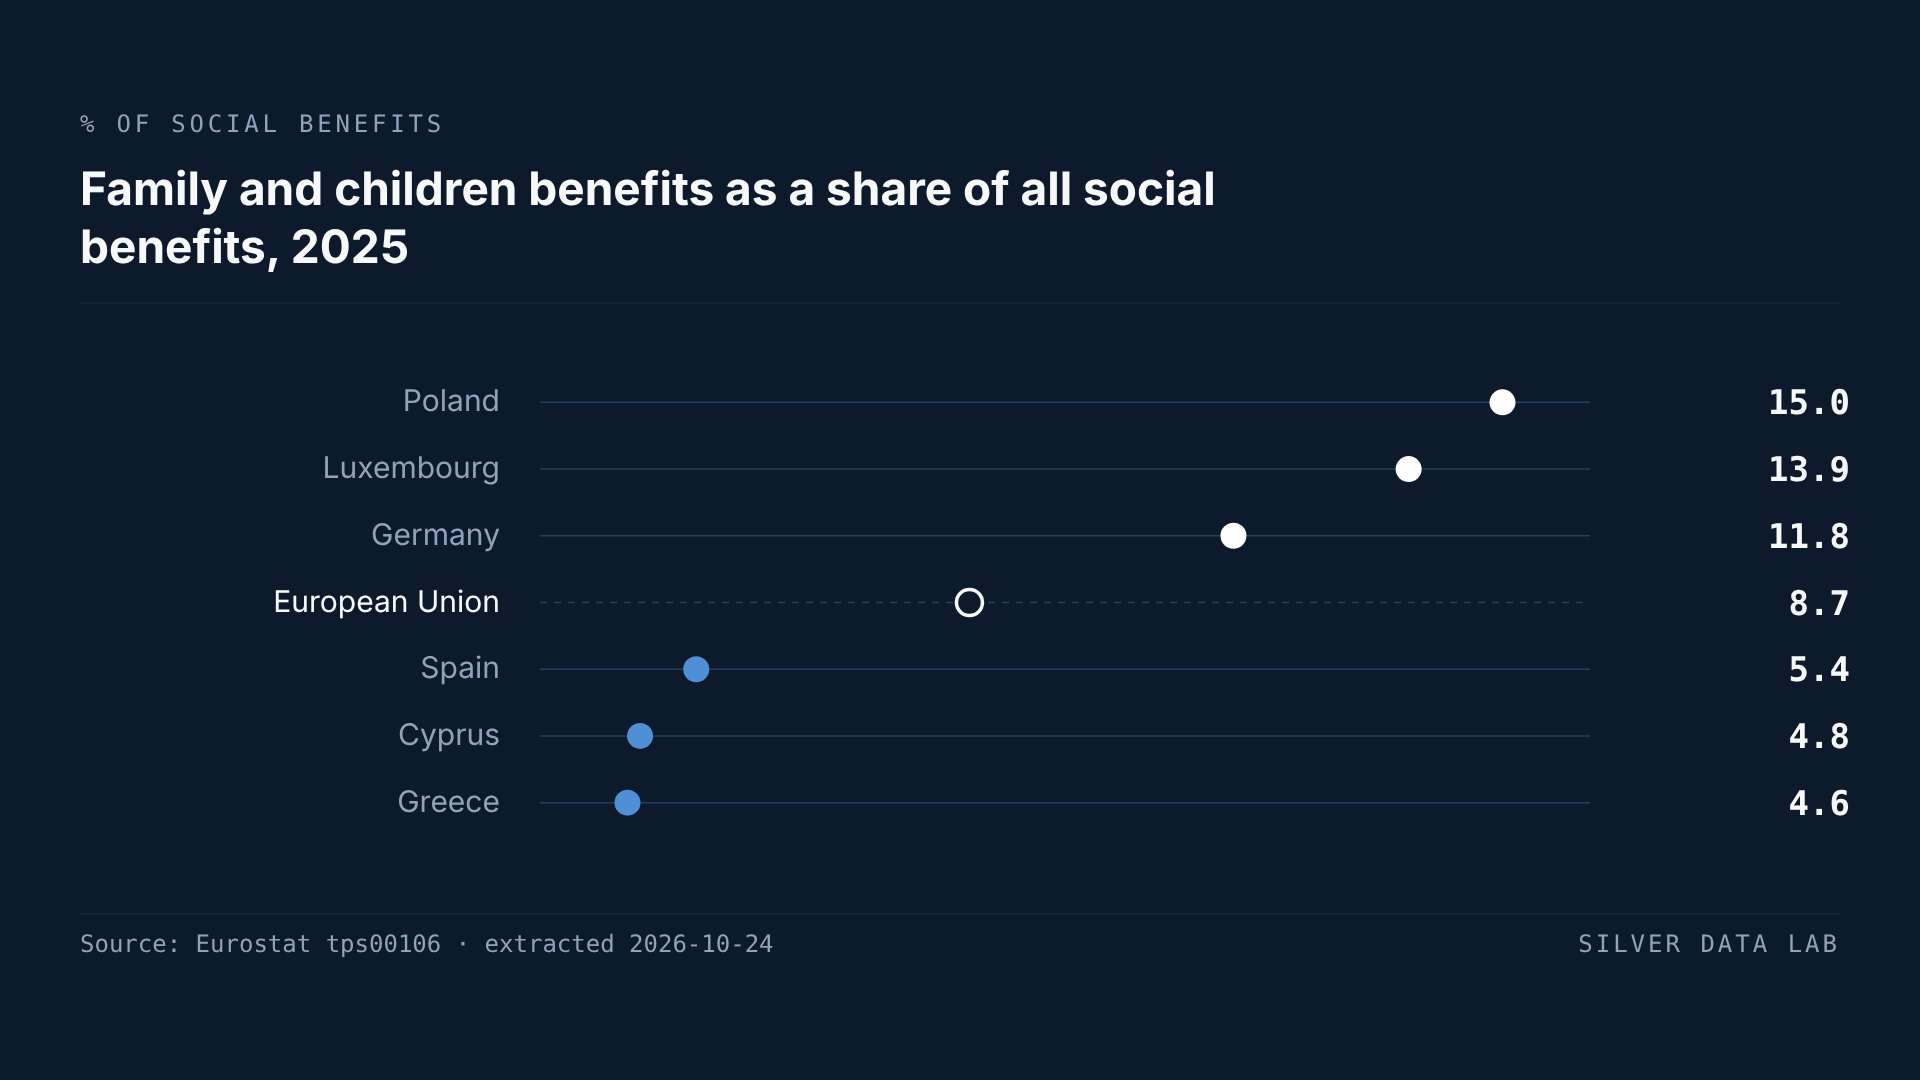
- Poland gave families the largest share, 15.0%, followed by Luxembourg at 13.9% and Germany at 11.8%. Greece gave the smallest, 4.6%, after Cyprus at 4.8% and Spain at 5.4%.
- Counted per inhabitant in purchasing power standards, a unit that removes price differences between countries, the order changes: Luxembourg spent 2,882, Germany 1,782 and Denmark 1,495, against 996 for the EU. Poland drops to fifth, at 1,312, just ahead of Finland.
- Thirteen Member States give families a larger share of their benefits than the EU does, but only seven of them also spend more per inhabitant. The other six are above the EU on the first measure and below it on the second, and Bulgaria's share matches the EU's to the hundredth of a point; the counts are derived by Silver Data Lab.
- Greece is last on both measures, at 288 PPS per inhabitant. Luxembourg's amount is almost ten times Greece's, while the largest share is a little over three times the smallest, two ratios derived by Silver Data Lab. Eurostat notes that per-inhabitant values overstate Luxembourg, which pays a significant part of its benefits to people living abroad.
What the family function covers
Every Member State reports its social protection spending to Eurostat in a shared set of accounts called ESSPROS, the European System of integrated Social Protection Statistics. The accounts file each benefit under the need it responds to, and there are eight of those needs, known as functions: sickness and health care, disability, old age, survivors, family and children, unemployment, housing, and social exclusion not covered elsewhere.
This page follows the family and children function. On the cash side it takes in family and child allowances, benefits paid during parental leave and income support around the birth of a child; on the side of services it takes in child day care, accommodation and home help for families.
Eurostat publishes the function in two forms, and this page uses both. The first is a share: family and children benefits as a percentage of all social protection benefits, which shows how a country divides what it pays out. The second is a level: the amount per inhabitant, expressed in purchasing power standards (PPS). The PPS is an artificial currency unit. Converting into it removes the differences in price levels between countries, so that one PPS buys the same quantity of goods and services in any Member State, and an amount in PPS can be compared across borders. The share speaks to priorities, the level to how much support there is, and the two need not agree. Both tables now hold a 2025 value for every Member State and for the EU, so 2025 is the year read here, and Eurostat flags every one of those 2025 values as an estimate.
Poland first by share
In 2025 Poland gave 15.0% of its social benefits to families and children, the largest share in the EU. Luxembourg followed at 13.9%, Germany at 11.8%, Romania at 11.5% and Estonia at 10.9%. Across the EU as a whole the share was 8.7%. Thirteen Member States sat above it and 13 below, while Bulgaria's share matched it to the hundredth of a point.
Greece had the smallest share, 4.6%, below Cyprus at 4.8%. Spain, at 5.4%, the Netherlands, at 5.5%, and Italy, at 5.9%, complete the five lowest.
Luxembourg first per inhabitant
Per inhabitant the top of the table looks different. Luxembourg spent 2,882 PPS on family and children benefits in 2025, Germany 1,782, Denmark 1,495, Austria 1,349, Poland 1,312 and Finland 1,310. Sweden, at 1,151, is the seventh and last Member State above the EU figure of 996 PPS. All seven also give families a larger share of their benefits than the EU does. Poland and Finland are less than two PPS apart, a gap computed here between two estimates and too small to settle which of the two spends more.
The bottom changes less. Greece spent 288 PPS per inhabitant, Cyprus 345 and Malta 425. Luxembourg's amount is almost ten times Greece's, a ratio computed here, whereas Poland's share is a little over three times Greece's.
Eurostat's metadata for these accounts states that values per inhabitant are overestimated for Luxembourg compared with other countries, because a significant proportion of its benefits, family benefits among them, is paid to people living outside the country. Its first place on this measure is partly an effect of dividing by the resident population alone.
Why the two orders part company
The amount per inhabitant is, in effect, the share applied to everything a country pays in social benefits per inhabitant, and that total differs widely between Member States. The per-inhabitant table publishes the eight functions one by one and no total, so Silver Data Lab added them up. Poland's benefits came to 8,721 PPS per inhabitant in 2025, against 11,477 for the EU. A share of 15.0% of that smaller total still put Poland above the EU per inhabitant, yet behind four other Member States. Luxembourg's eight functions alone sum to 20,694 PPS per inhabitant.
Six Member States give families a larger share than the EU but spend less per inhabitant than the EU: Romania, Estonia, Slovakia, Croatia, Lithuania and Hungary. Romania, the highest of the six by share, is fourth on that measure and thirteenth per inhabitant, at 662 PPS. Estonia is fifth by share and eighteenth per inhabitant, Slovakia seventh and fourteenth. Bulgaria, level with the EU by share, is twentieth per inhabitant. No Member State does the reverse, spending more than the EU per inhabitant on a smaller share.
The gap also opens in the opposite direction. The Netherlands gives families the fourth smallest share, yet ranks tenth per inhabitant at 790 PPS, because its benefits, summed the same way, total 14,404 PPS per inhabitant. Austria is thirteenth by share and fourth per inhabitant, Belgium seventeenth and eighth.
Greece is alone at the foot of both. Its benefits add up to 6,268 PPS per inhabitant, less than Poland's total, and it gives families the smallest share of them.
How the share has moved since 2015
The share can be followed from 2014, but Eurostat flags a break in the EU and Hungarian series in 2015, so the changes described here run from 2015 to 2025. Over that span the EU share rose from 8.0% to 8.7%. It rose in 14 Member States and fell in 13, and Belgium's barely moved, rising by less than a tenth of a point.
Poland's rise is more than twice the next largest. Its share went from 8.0% in 2015 to 12.5% in 2016 and reached 16.2% in 2020, the highest value any Member State records in the table for any year from 2014 to 2025. In 2025 it stood at 15.0%, just over seven points above the 2015 level. Luxembourg had the largest share in every year from 2014 to 2019 and again in 2023; Poland had it in 2020, 2021, 2022, 2024 and 2025. Romania's rise, from 8.8% to 11.5%, was the second largest, and Lithuania's, from 7.5% to 9.8%, the third.
Latvia's share fell furthest, from 10.9% to 8.2%. Czechia's, from 8.7% to 6.3%, and Ireland's, from 10.8% to 8.4%, dropped by the same amount to the hundredth of a point and tie for the next largest fall. Italy, which had the lowest share in the EU in six of the twelve years from 2014 to 2025, rose from 3.9% to 5.9%; its values for 2021 to 2024 are provisional and its 2025 value is an estimate.
A share moves when family benefits change and also when the other functions do. If old-age benefits grow faster than family benefits, the family share falls even when no family receives less. The table records the share, not which side of the division moved.
Family and children benefits as a share of all social benefits, 2025
| Country | % of social benefits | Gap to EU sharepercentage points, derived |
|---|---|---|
| Poland | 15.0e | +6.4 |
| Luxembourg | 13.9e | +5.2 |
| Germany | 11.8e | +3.2 |
| European Unionaggregate | 8.7e | — |
| Spain | 5.4e | −3.3 |
| Cyprus | 4.8e | −3.9 |
| Greece | 4.6e | −4.1 |
Flags carried by the source on these values: e estimated
This table as data: CSV · JSON
Every Member State for this indicator+
Members see every Member State for this indicator here, not only the rows the ranking prints. Become a Member
Embed this chart
Paste this code into a page. The frame carries the source and the extraction date, and links back to the study.
Family and children benefits per inhabitant, 2025
| Country | PPS per inhabitant | Gap to EU figurederived |
|---|---|---|
| Luxembourg | 2,882e | +1,885.3 |
| Germany | 1,782e | +786.1 |
| Denmark | 1,495e | +498.3 |
| European Unionaggregate | 996e | — |
| Malta | 425e | −571.5 |
| Cyprus | 345e | −650.9 |
| Greece | 288e | −708.0 |
Flags carried by the source on these values: e estimated
This table as data: CSV · JSON
Every Member State for this indicator+
Members see every Member State for this indicator here, not only the rows the ranking prints. Become a Member
Embed this chart
Paste this code into a page. The frame carries the source and the extraction date, and links back to the study.
What these figures cannot tell you
- A share of benefits, not of the economy
- The share divides family benefits by all social protection benefits, so it describes how a country splits its social spending and nothing more. A country with a small total can give families a large share and still spend less on each inhabitant than a country giving a small share of a large total, which is the pattern this page describes.
- Per inhabitant, not per child
- The level divides spending by the whole resident population, adults and children alike. A country with proportionally more children has more of them to support from the same amount, and neither table carries a measure per child or per family, so a high figure per inhabitant does not by itself mean more generous support for each child.
- Luxembourg pays across its borders
- Eurostat's metadata states that per-inhabitant values are overestimated for Luxembourg, because a significant proportion of its benefits, chiefly for health care, pensions and families, goes to people who live outside the country while the divisor is the resident population. Its first place per inhabitant therefore overstates what is spent on each resident.
- Most help through the tax system is left out
- Under the ESSPROS rules, tax breaks are kept out of the core accounts used here, with one exception: payable tax credits, which are paid out even when they exceed the tax a household owes, are counted in full. A country that supports families mainly by reducing the income tax they pay will look smaller in these tables than its support really is.
- Estimated 2025 values and a break in 2015
- Every 2025 value in both tables, for each of the 27 Member States and for the EU, is flagged by Eurostat as estimated, and an estimate can move when Eurostat publishes a later figure for the same year. 2025 is the year used here because it is the latest one that both tables now cover completely, every Member State and the EU aggregate included. The earlier shares behind the year-by-year comparisons carry provisional flags in places: the EU's from 2020 to 2024, Italy's from 2021 to 2024, Greece's for 2023 and 2024, Lithuania's and Slovenia's for 2020 and 2021, and those of Germany, Spain, France and Sweden for 2024. Eurostat flags a break in series in 2015 for the EU aggregate and for Hungary. Eurostat's metadata presents purchasing power standards as a unit for comparing countries with one another, which is why no amount per inhabitant is compared across years here.
Frequently asked questions
- What share of social benefits goes to families and children in the EU?
- 8.7% in 2025, a Eurostat estimate, up from 8.0% in 2015. Measured per inhabitant, the EU's family and children benefits came to 996 purchasing power standards in 2025, also an estimate.
- Which EU country devotes the largest share of its social benefits to families?
- Poland, at 15.0% in 2025, ahead of Luxembourg at 13.9% and Germany at 11.8%. Per inhabitant, though, Poland ranks fifth, at 1,312 PPS, because its social benefits as a whole come to less per inhabitant than in the four Member States ahead of it, and less than in the EU.
- Which EU country spends the most on family benefits per inhabitant?
- Luxembourg, at 2,882 PPS in 2025, followed by Germany at 1,782 and Denmark at 1,495. Eurostat notes that Luxembourg's per-inhabitant values are overestimated, because a significant proportion of its benefits, family benefits among them, is paid to people living outside the country. Greece spends the least, 288 PPS, and also gives families the smallest share.
- Why do the share and the amount per inhabitant put countries in a different order?
- Because the amount per inhabitant is the share applied to a country's whole social benefits bill per inhabitant, and that bill varies widely. Adding up the eight functions of the per-inhabitant table, a sum computed by Silver Data Lab, Poland paid 8,721 PPS of benefits per inhabitant in 2025 against 11,477 for the EU and 20,694 for Luxembourg. A large share of a smaller total can come to less than a modest share of a larger one.
Methodological note
The two tables measure the social protection benefits paid under the family and children function of ESSPROS, reported by every Member State and aggregated by Eurostat for the EU. One expresses those benefits as a percentage of all social protection benefits, for each year from 2014 to 2025; the other expresses every function's benefits in purchasing power standards per inhabitant, for 2025, converted with the purchasing power parities Eurostat computes for actual individual consumption and divided by the resident population.
2025 is the latest year with a value for every Member State and for the EU aggregate in both tables, and every value for that year carries Eurostat's estimated flag. Changes in the share are measured from 2015, the year of the break in series Eurostat flags for the EU and Hungary.
Eurostat publishes the shares to two decimals and the amounts to two decimals of a PPS. This page rounds the shares to one decimal and the amounts to whole units; every change, count, rank and ratio is computed from the published values before rounding.
Silver Data Lab derived the following from the published values: the total of social benefits per inhabitant for each Member State and the EU in 2025, as the sum of the eight functions in the per-inhabitant table, which publishes no total of its own, and which reproduces every published 2025 family share to the hundredth of a point when the family amount is divided by it; the change in each Member State's share between 2015 and 2025, in percentage points, with the counts of Member States whose share rose or fell; the counts of Member States above or below the EU on each measure, and of those above on one and below on the other; the ratio of Luxembourg's amount per inhabitant to Greece's, of Poland's share to Greece's and of Poland's rise in share to the next largest rise; the difference between Poland's and Finland's amounts per inhabitant; the rank positions on both measures; and the years in which a country had the largest or the smallest share. Any number on this page not listed here appears in Eurostat's tables, altered only by the rounding described above.
Source data
This study draws on 2 datasets from Eurostat. Each can be inspected and re-downloaded from its catalogue, and the filters below are the ones applied.
Social benefits by function - % of total benefits
tps00106
- Filters applied:
- freq=A · unit=PC_BEN · spdeps=SPR · spfunc=FAM · time=2014, 2015, 2016, 2017, 2018, 2019, 2020, 2021, 2022, 2023, 2024, 2025
- Extracted:
- 2026-10-24
- Source last updated:
- 2026-10-23
Social benefits by function - PPS per inhabitant
tps00107
- Filters applied:
- freq=A · unit=PPS_HAB · spdeps=SPR · spfunc=SICK, DIS, OLD, SRV, FAM, UNE, HOU, EXCL · time=2025
- Extracted:
- 2026-10-24
- Source last updated:
- 2026-10-23
Download the data
The data the study you have just read is built on, exactly as it was downloaded and archived.
Yours as a Member.
Data downloadable by Members
How to cite
Record the vintage as well as the study: the figures on this page are the ones extracted on the dates below.
Silver Data Lab Research Desk (2026). Poland Gives Families More of Its Social Spending Than Any Other EU Country. Silver Data Lab, published 08 October 2026, last updated 24 October 2026. https://www.silverdatalab.com/studies/family-benefits-in-the-eu
- Data: Eurostat, Social benefits by function - % of total benefits (tps00106), filters freq=A, unit=PC_BEN, spdeps=SPR, spfunc=FAM, time=2014, 2015, 2016, 2017, 2018, 2019, 2020, 2021, 2022, 2023, 2024, 2025; extracted 2026-10-24; source last updated 2026-10-23. https://doi.org/10.2908/tps00106
- Data: Eurostat, Social benefits by function - PPS per inhabitant (tps00107), filters freq=A, unit=PPS_HAB, spdeps=SPR, spfunc=SICK, DIS, OLD, SRV, FAM, UNE, HOU, EXCL, time=2025; extracted 2026-10-24; source last updated 2026-10-23. https://doi.org/10.2908/tps00107
Silver Data Lab's analysis is licensed CC BY 4.0. The statistics remain their publisher's and keep its terms of reuse.
Ask the research desk
A question about this study — a definition, a filter, a break in the series, what the figures can and cannot support — answered by the desk that made the extraction.
Members can write to the research desk
Studies where the same country leads or trails
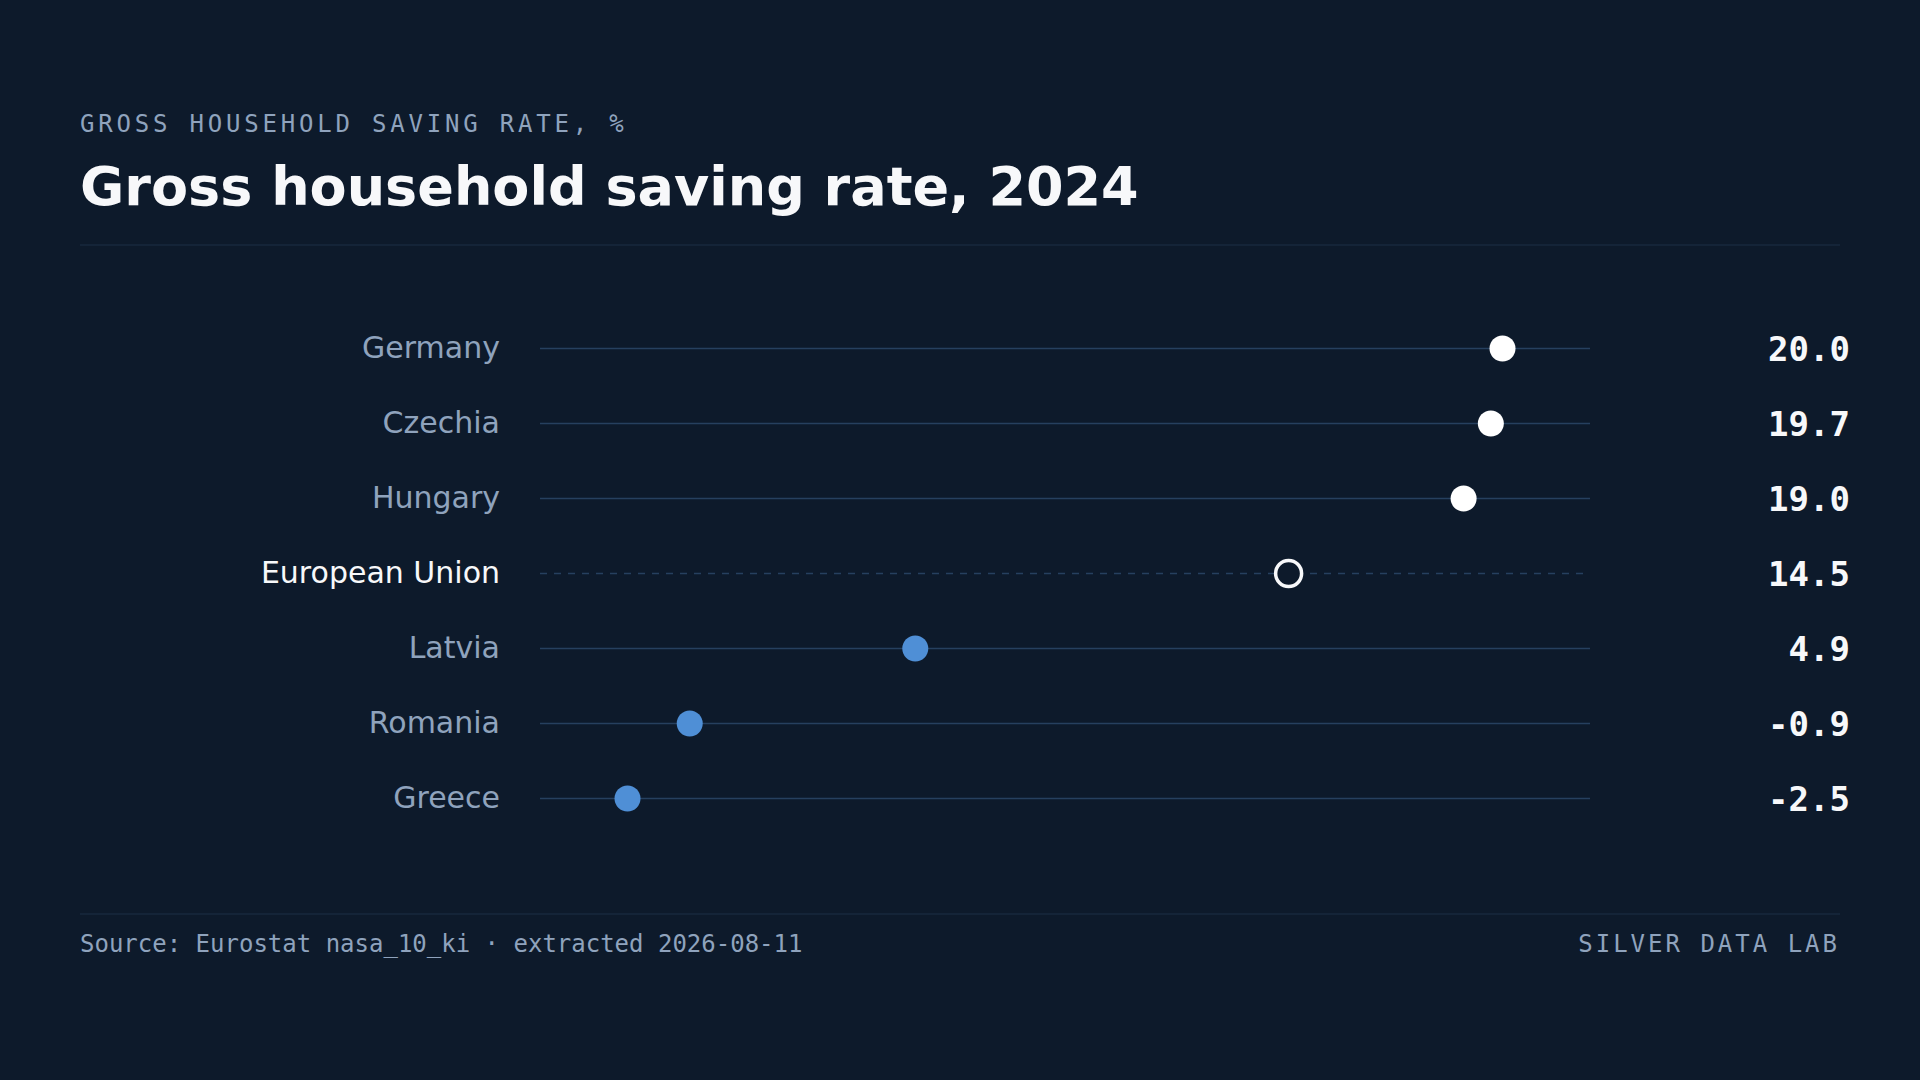
In Two EU Countries, Households Spend More Than They Earn
EU households saved 14.5% of their gross disposable income in 2024.
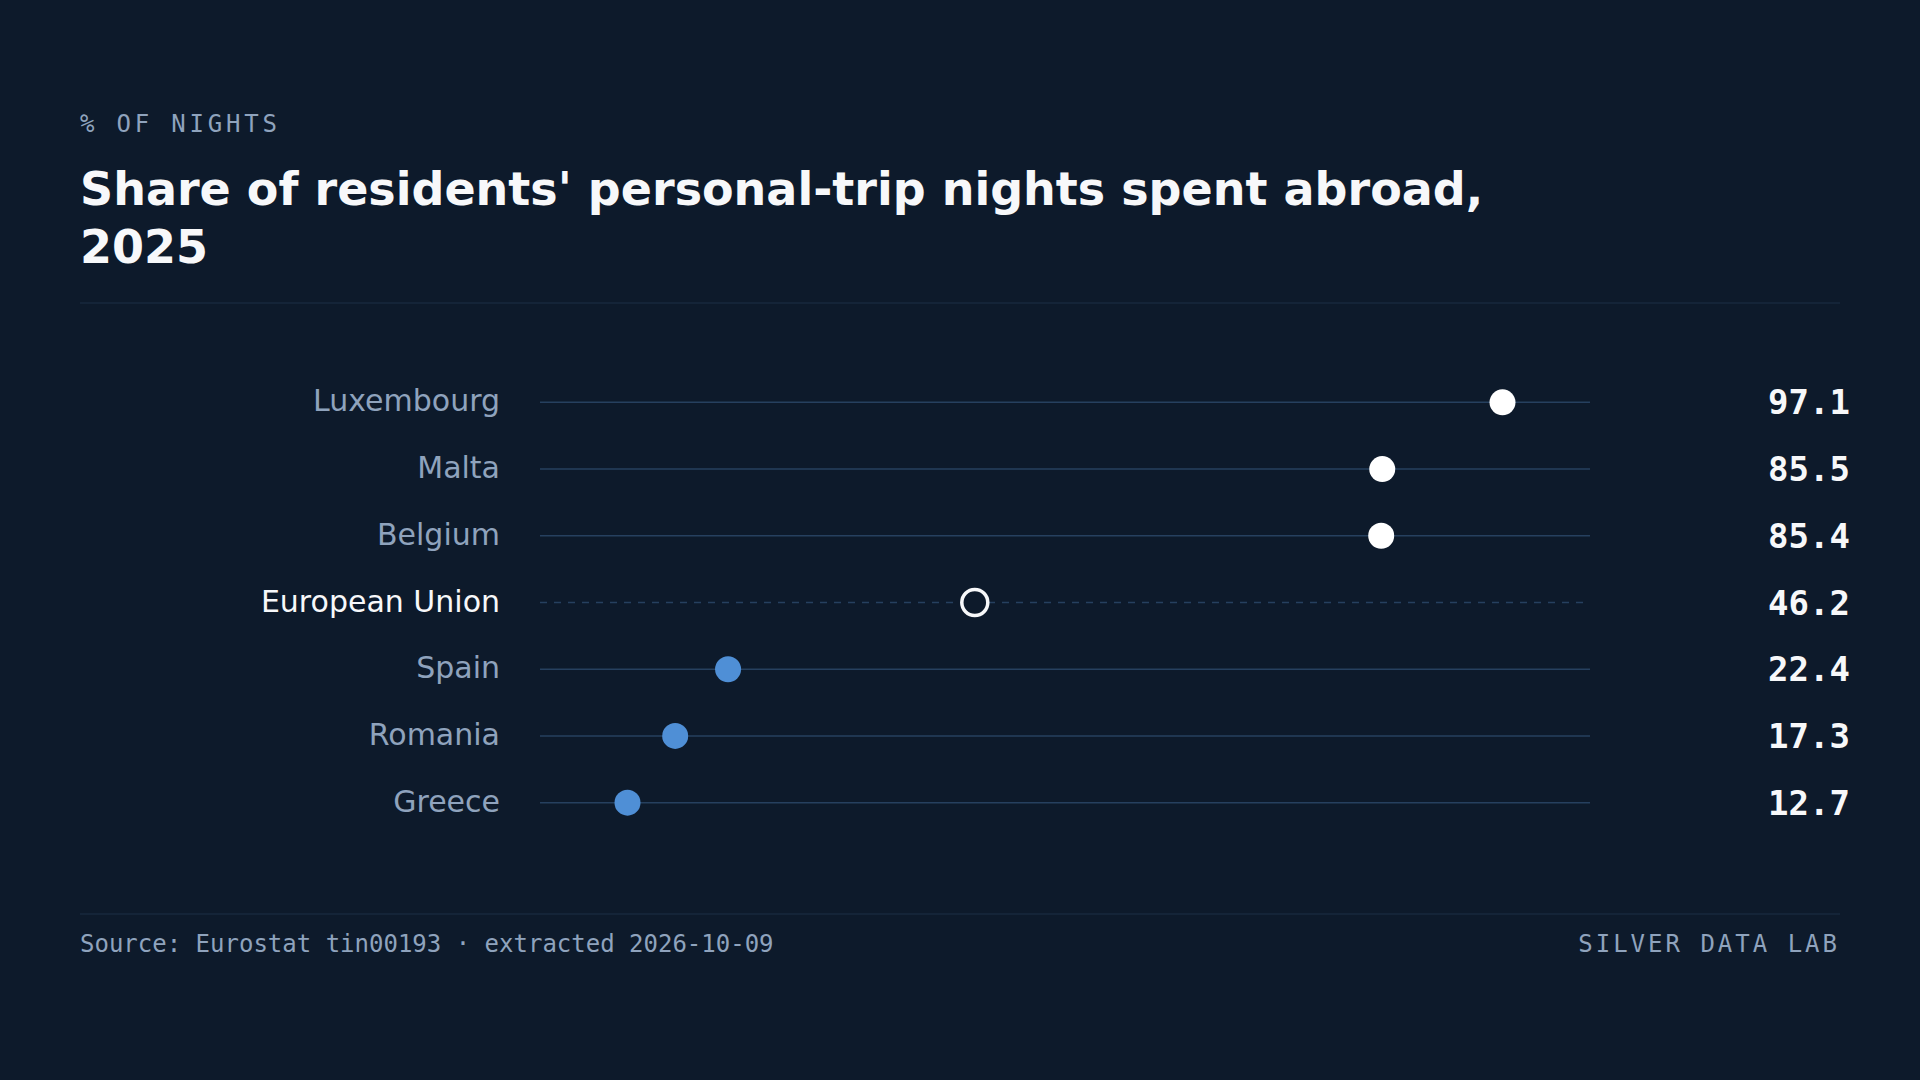
Luxembourg's Residents Spend Nearly All Their Holiday Nights Abroad
In 2025, 46.2% of the nights EU residents spent away from home on personal trips were spent in a country other than their own, against 42.3% in 2019. Both shares are derived by Silver Data Lab from Eurostat's counts of nights.
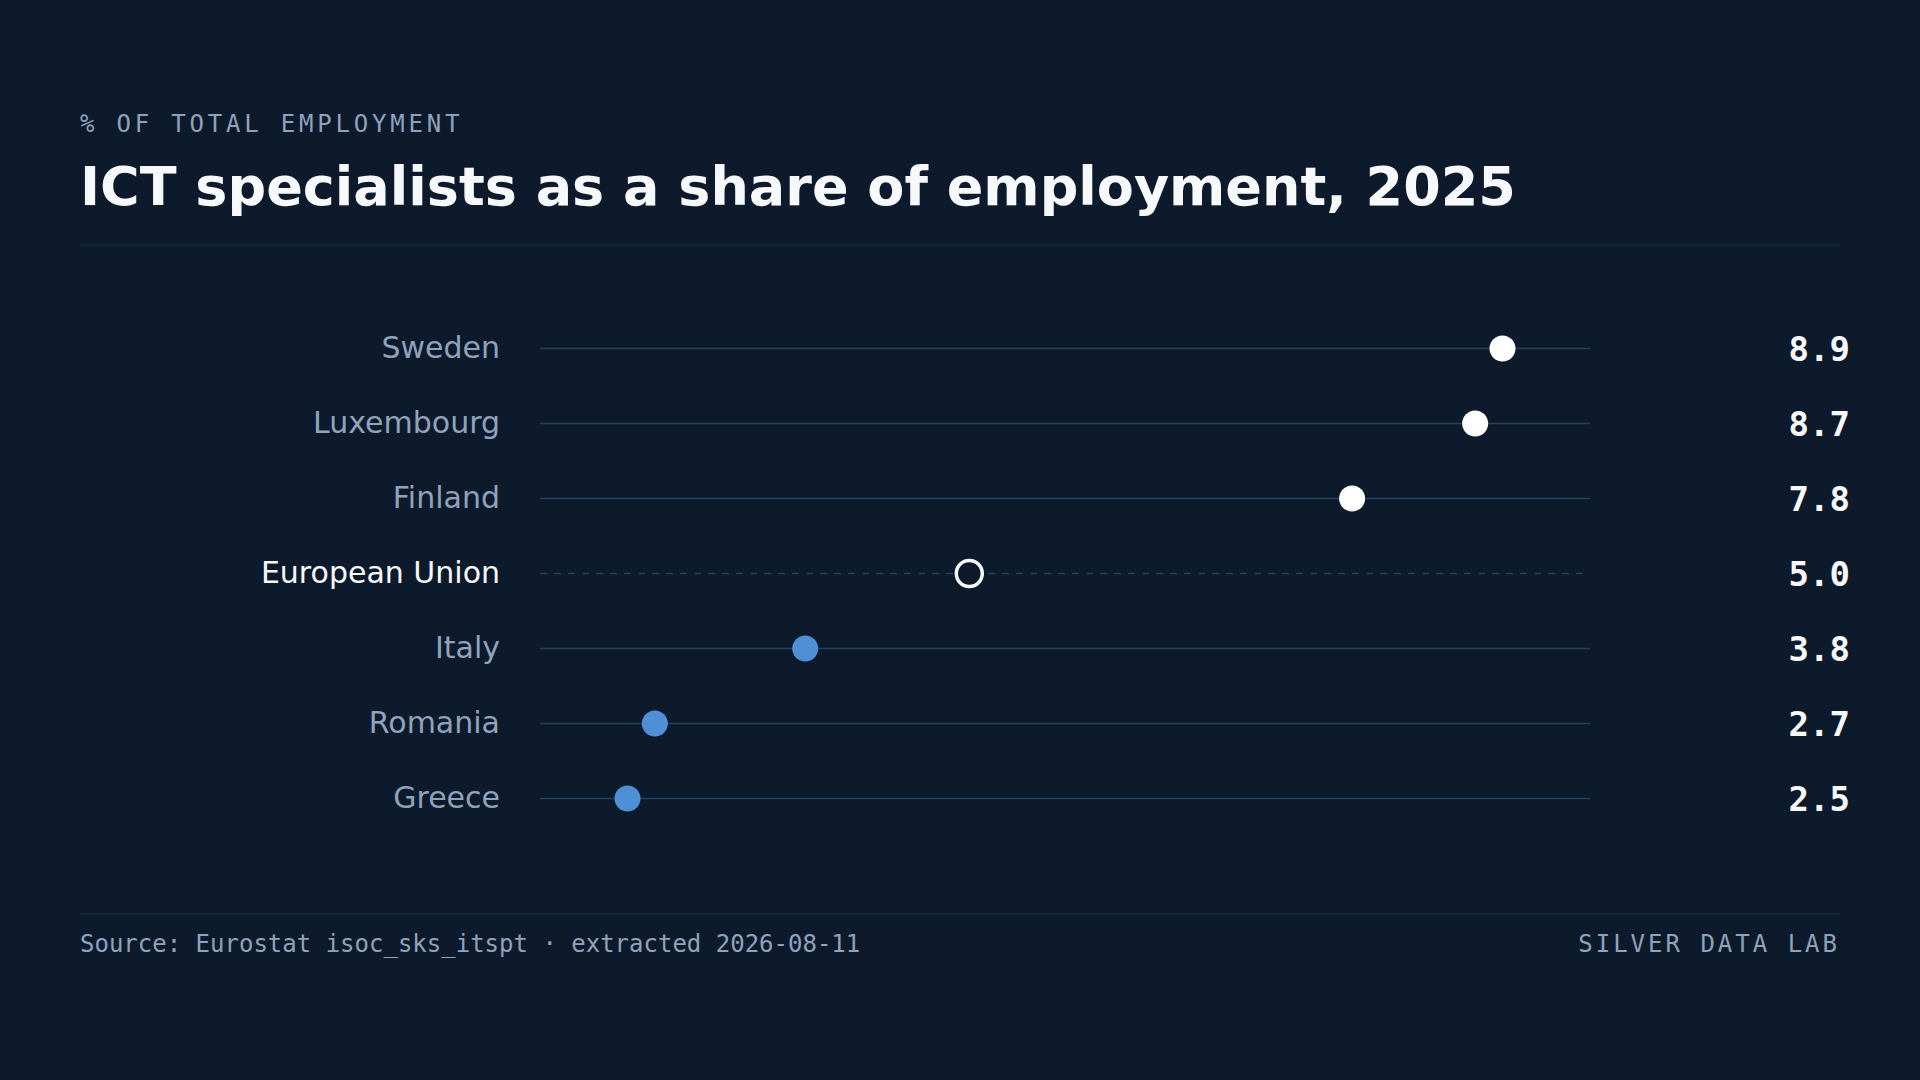
One in Twenty European Workers Is an ICT Specialist
ICT specialists made up 5.0% of employment across the EU in 2025.