Croatians Are the Least Likely in the EU to Go Without Essentials
Silver Data Lab Research Desk · Statistical analysis · Published on 09 May 2026
This study is open to members only
Its sources, filters and extraction date are declared above, as they are for every study. Sign in to read the analysis in full.
- Data source
- Eurostat
- Reference period
- 2025
- Last updated
- 11 October 2026
Re-checked against the source on 21 October 2026. 1 values in its datasets moved between snapshots; none is a figure stated on this page. Every revision we have observed →
Key estimates
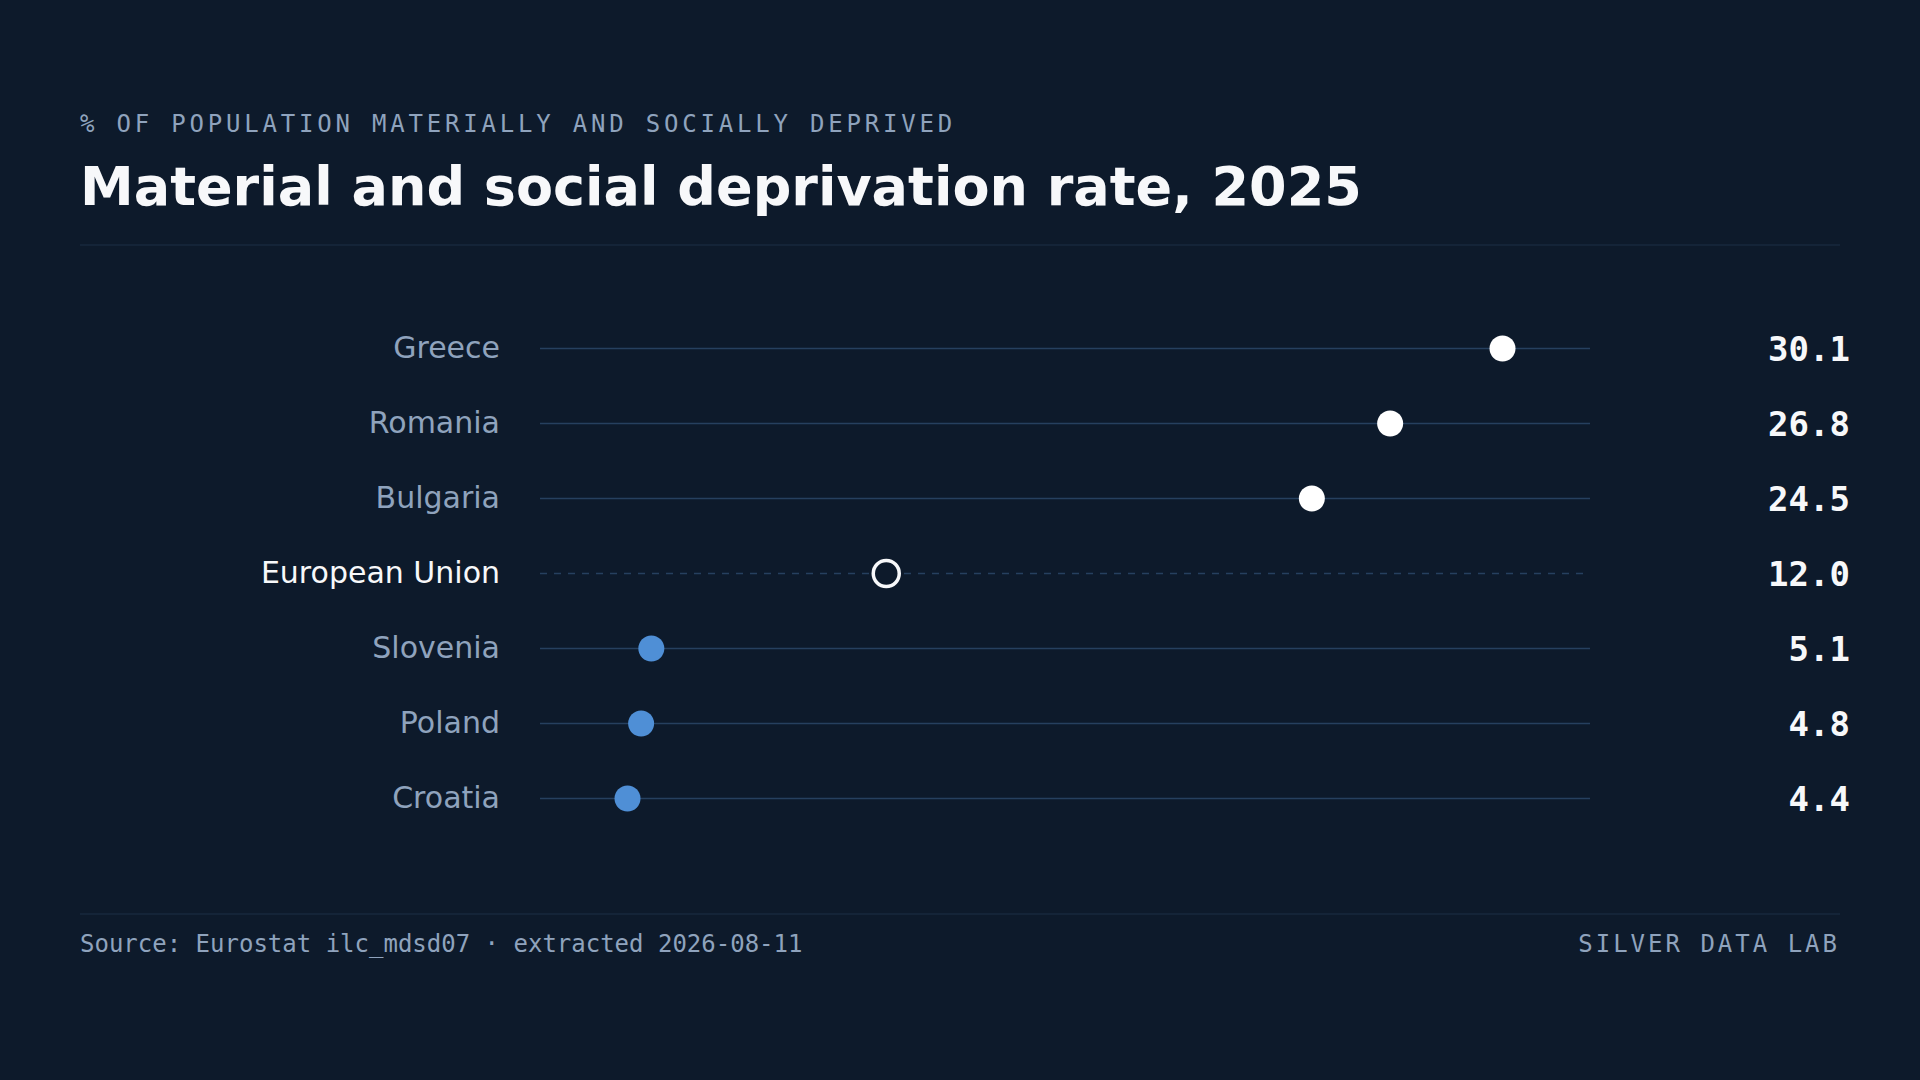
- 12.0% of the EU population was materially and socially deprived in 2025, against 20.9% at risk of poverty or social exclusion.
- Greece records the highest rate at 30.1% — higher than its own poverty-risk rate of 27.5%, the only such case among the leaders.
- Croatia records the lowest deprivation in the Union at 4.4%, while its poverty-risk rate of 20.7% sits close to the EU average.
- Deprivation counts what a household cannot afford, so it is comparable across countries in a way a relative income threshold is not.
- The two measures rank Member States differently, and the disagreements identify where relative and absolute hardship come apart.
Two questions that sound like one
Ask how many people in a country are poor and there are two defensible answers. One compares people to their neighbours: an income below some fraction of the national median. The other asks what they can actually afford: whether the household can keep the home warm, replace worn furniture, handle an unexpected expense, or spend a small amount on itself each week.
Eurostat publishes both. The relative measure sits inside the headline at-risk-of-poverty-or-social-exclusion rate; the absolute one is the material and social deprivation rate, which counts a person as deprived when their household lacks a set number of items from a standard list for reasons of affordability rather than choice.
Across the EU in 2025 that headline composite reads 20.9% and the deprivation rate 12.0%. They are not versions of the same number, and where they disagree is where the interesting cases are.
Greece, where deprivation exceeds poverty risk
Greece records 30.1% deprivation, the highest in the Union, against a poverty-risk rate of 27.5%.
That ordering is unusual. For every Member State but Greece the composite is the larger of the two, because it counts anyone meeting any one of its three conditions and deprivation is only one of them. Greece is the sole exception in the Union: more Greeks lack items on the standard list than the headline measure counts at all.
Romania at 26.8% and Bulgaria at 24.5% follow, both below their own poverty-risk rates but far above the EU deprivation average.
Croatia, where the two measures diverge most
Croatia records the lowest material and social deprivation rate in the European Union, at 4.4% — below Poland at 4.8% and Slovenia at 5.1%, and just over a third of the EU figure.
Its poverty-risk rate is 20.7%, essentially the EU average of 20.9%.
So on the headline measure Croatia is unremarkable, and on deprivation it is the best performer among twenty-seven countries. Both readings are correct. The composite is telling us that a fifth of Croatians meet at least one of its three conditions; the deprivation measure is telling us that very few Croatians cannot afford the items on the list. Income inequality and material hardship are describing different things, and Croatia is where the distance between them is widest.
Why the comparison is worth making
Deprivation is measured against a common European list of items rather than a national income distribution. That makes it the measure to reach for when the question is whether people in one Member State are materially worse off than in another — the question the relative rate cannot answer, because its threshold moves with each country's own median.
The reverse also holds. Deprivation says nothing about how far a household sits from the standard of living around it, which is the exclusion the European framework is built to capture. Neither measure is the true one, and reporting either alone produces a ranking that a second, equally official ranking contradicts.
Material and social deprivation rate, 2025
| Country | % of population | Gap to EU averagepercentage points, derived |
|---|---|---|
| Greece | 30.1 | +18.1 |
| Romania | 26.8 | +14.8 |
| Bulgaria | 24.5 | +12.5 |
| European Unionaggregate | 12.0 | — |
| Slovenia | 5.1 | −6.9 |
| Poland | 4.8 | −7.2 |
| Croatia | 4.4 | −7.6 |
This table as data: CSV · JSON
Every Member State for this indicator+
Members see every Member State for this indicator here, not only the rows the ranking prints. Become a Member
What these figures cannot tell you
- Deprivation is a threshold count, not a scale
- A person is deprived when their household lacks at least a set number of items from the standard list. Somebody lacking one item fewer than the threshold does not appear in the rate at all, and somebody lacking every item appears once. The measure is a headcount above a line, not a measure of how deprived those counted are.
- The list is common, the prices are not
- The items are the same across Member States, which is what makes the measure comparable, but affording them costs different amounts in different countries. Comparability is at the level of the list rather than of the underlying budgets.
- The two rates measure overlapping populations
- Severe material and social deprivation is one of the three components of the at-risk-of-poverty-or-social-exclusion measure, so the two indicators are not independent. This study compares a broader deprivation measure with the headline composite; the deprived population is largely, but not entirely, inside the composite.
- Survey data
- Figures come from EU-SILC, a sample survey. They are estimates rather than counts, and small differences between countries should not be over-interpreted.
Frequently asked questions
- What is the material and social deprivation rate?
- The share of the population whose household cannot afford a set number of items from a standard European list, covering both material goods and social participation. Unlike the poverty-risk rate it is measured against a common list rather than each country's own median income. It stood at 12.0% across the EU in 2025.
- Which EU country has the highest material deprivation?
- Greece, at 30.1% in 2025, ahead of Romania at 26.8% and Bulgaria at 24.5%. Greece is also the case where deprivation exceeds the country's own poverty-risk rate of 27.5%.
- Which EU country has the lowest material deprivation?
- Croatia, at 4.4% in 2025, followed by Poland at 4.8% and Slovenia at 5.1% — just over a third of the EU rate of 12.0%.
- Why do poverty and deprivation rankings disagree?
- Because they measure different things. Poverty risk is relative to each country's own median income, so it tracks inequality within a society; deprivation counts what households cannot afford against a common list. Croatia is the clearest divergence: an average poverty-risk rate of 20.7% alongside the lowest deprivation in the Union.
Methodological note
The material and social deprivation rate is Eurostat's measure of the share of the population unable to afford a set number of items from a standard list covering both material goods and social participation. It is published for the total population as a percentage, and is distinct from the severe deprivation variant used inside the headline composite.
Values are for 2025, matching the reference year of the at-risk-of-poverty-or-social-exclusion figures this study compares them against, so the two rankings describe the same year.
The comparisons of rank between the two indicators, and the observation that Greece is the only Member State whose deprivation rate exceeds the headline composite, are derived by Silver Data Lab from the two published series, both of which are declared and archived here. The headline composite counts a person if any one of three conditions applies — income below 60% of the national median, severe material and social deprivation, or very low work intensity — so it is not a measure of relative income alone.
Source data
This study draws on 2 datasets from Eurostat. Each can be inspected and re-downloaded from its catalogue, and the filters below are the ones applied.
Material and social deprivation rate by age and sex
ilc_mdsd07
- Filters applied:
- freq=A · age=TOTAL · sex=T · unit=PC · time=2025
- Extracted:
- 2026-10-21
- Source last updated:
- 2026-10-20
Persons at risk of poverty or social exclusion by age and sex
ilc_peps01n
- Filters applied:
- freq=A · age=TOTAL · sex=T · unit=PC · time=2025
- Extracted:
- 2026-10-21
- Source last updated:
- 2026-10-20
Download the data
The data the study you have just read is built on, exactly as it was downloaded and archived.
Yours as a Member.
Data downloadable by Members
How to cite
Record the vintage as well as the study: the figures on this page are the ones extracted on the dates below.
Silver Data Lab Research Desk (2026). Croatians Are the Least Likely in the EU to Go Without Essentials. Silver Data Lab, published 09 May 2026, last updated 11 October 2026. https://www.silverdatalab.com/studies/material-deprivation-in-the-eu
- Data: Eurostat, Material and social deprivation rate by age and sex (ilc_mdsd07), filters freq=A, age=TOTAL, sex=T, unit=PC, time=2025; extracted 2026-10-21; source last updated 2026-10-20. https://doi.org/10.2908/ilc_mdsd07
- Data: Eurostat, Persons at risk of poverty or social exclusion by age and sex (ilc_peps01n), filters freq=A, age=TOTAL, sex=T, unit=PC, time=2025; extracted 2026-10-21; source last updated 2026-10-20. https://doi.org/10.2908/ilc_peps01n
Silver Data Lab's analysis is licensed CC BY 4.0. The statistics remain their publisher's and keep its terms of reuse.
Ask the research desk
A question about this study — a definition, a filter, a break in the series, what the figures can and cannot support — answered by the desk that made the extraction.
Members can write to the research desk
Other studies on the same dataset
One in Five Europeans Is at Risk of Poverty or Exclusion
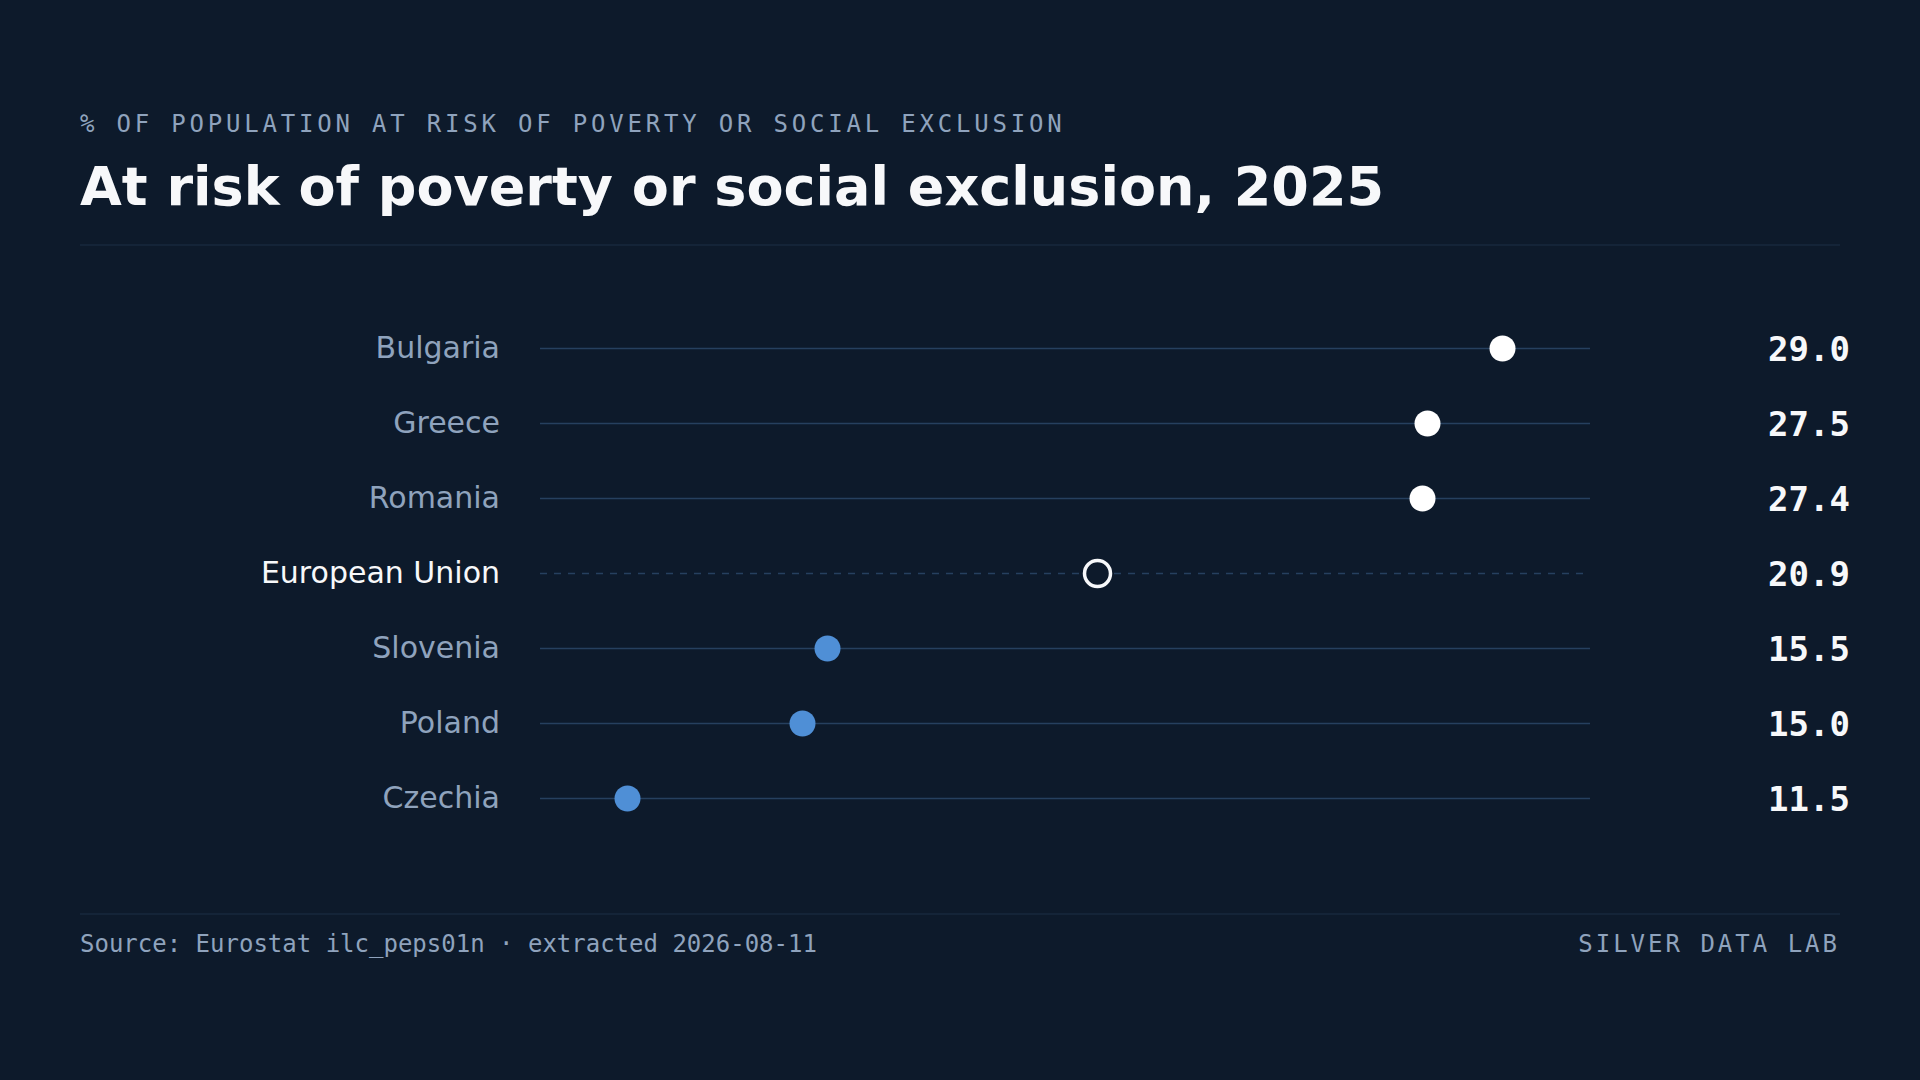
20.9% of the EU population was at risk of poverty or social exclusion in 2025 — roughly one person in five.
Romania Uses Less Energy per Person Than Any Other EU Country
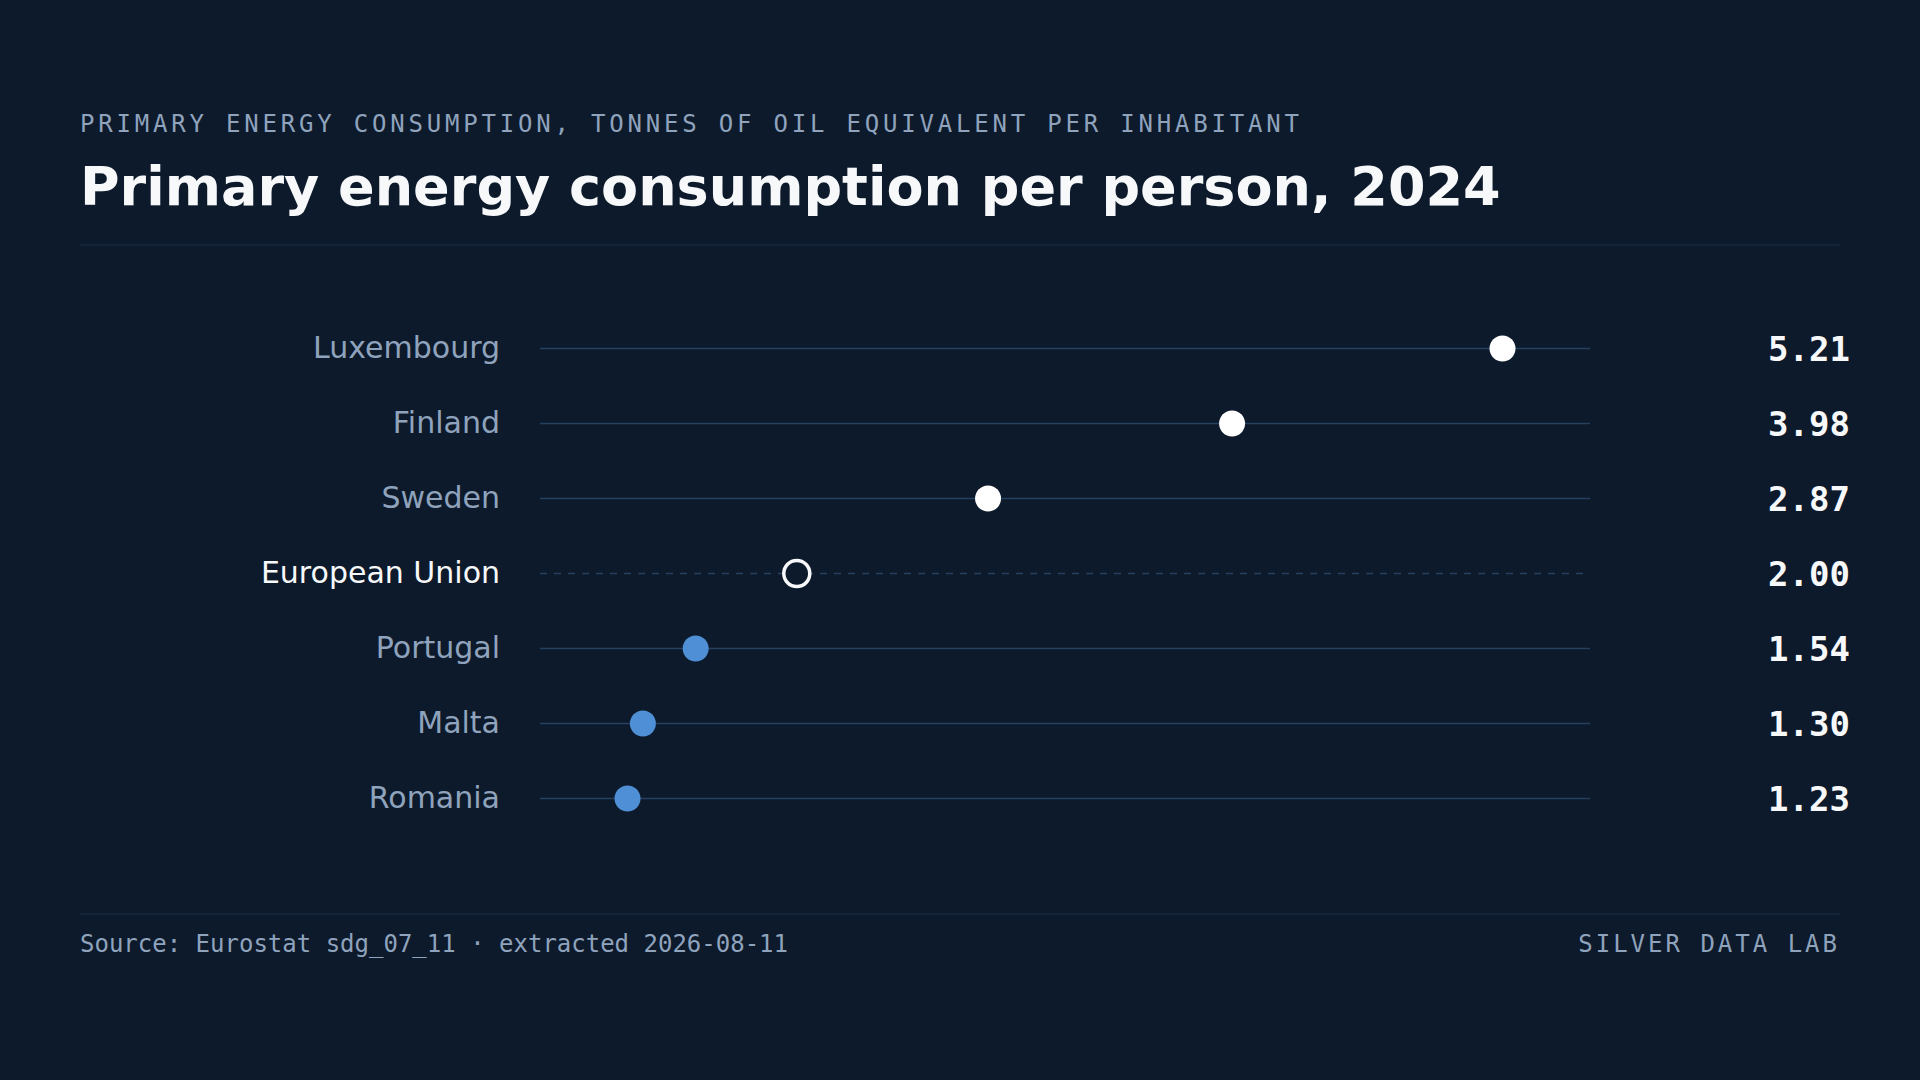
The EU consumed 2.0 tonnes of oil equivalent per inhabitant in final energy in 2024.
Spain's Children Face the EU's Highest Risk of Poverty or Social Exclusion
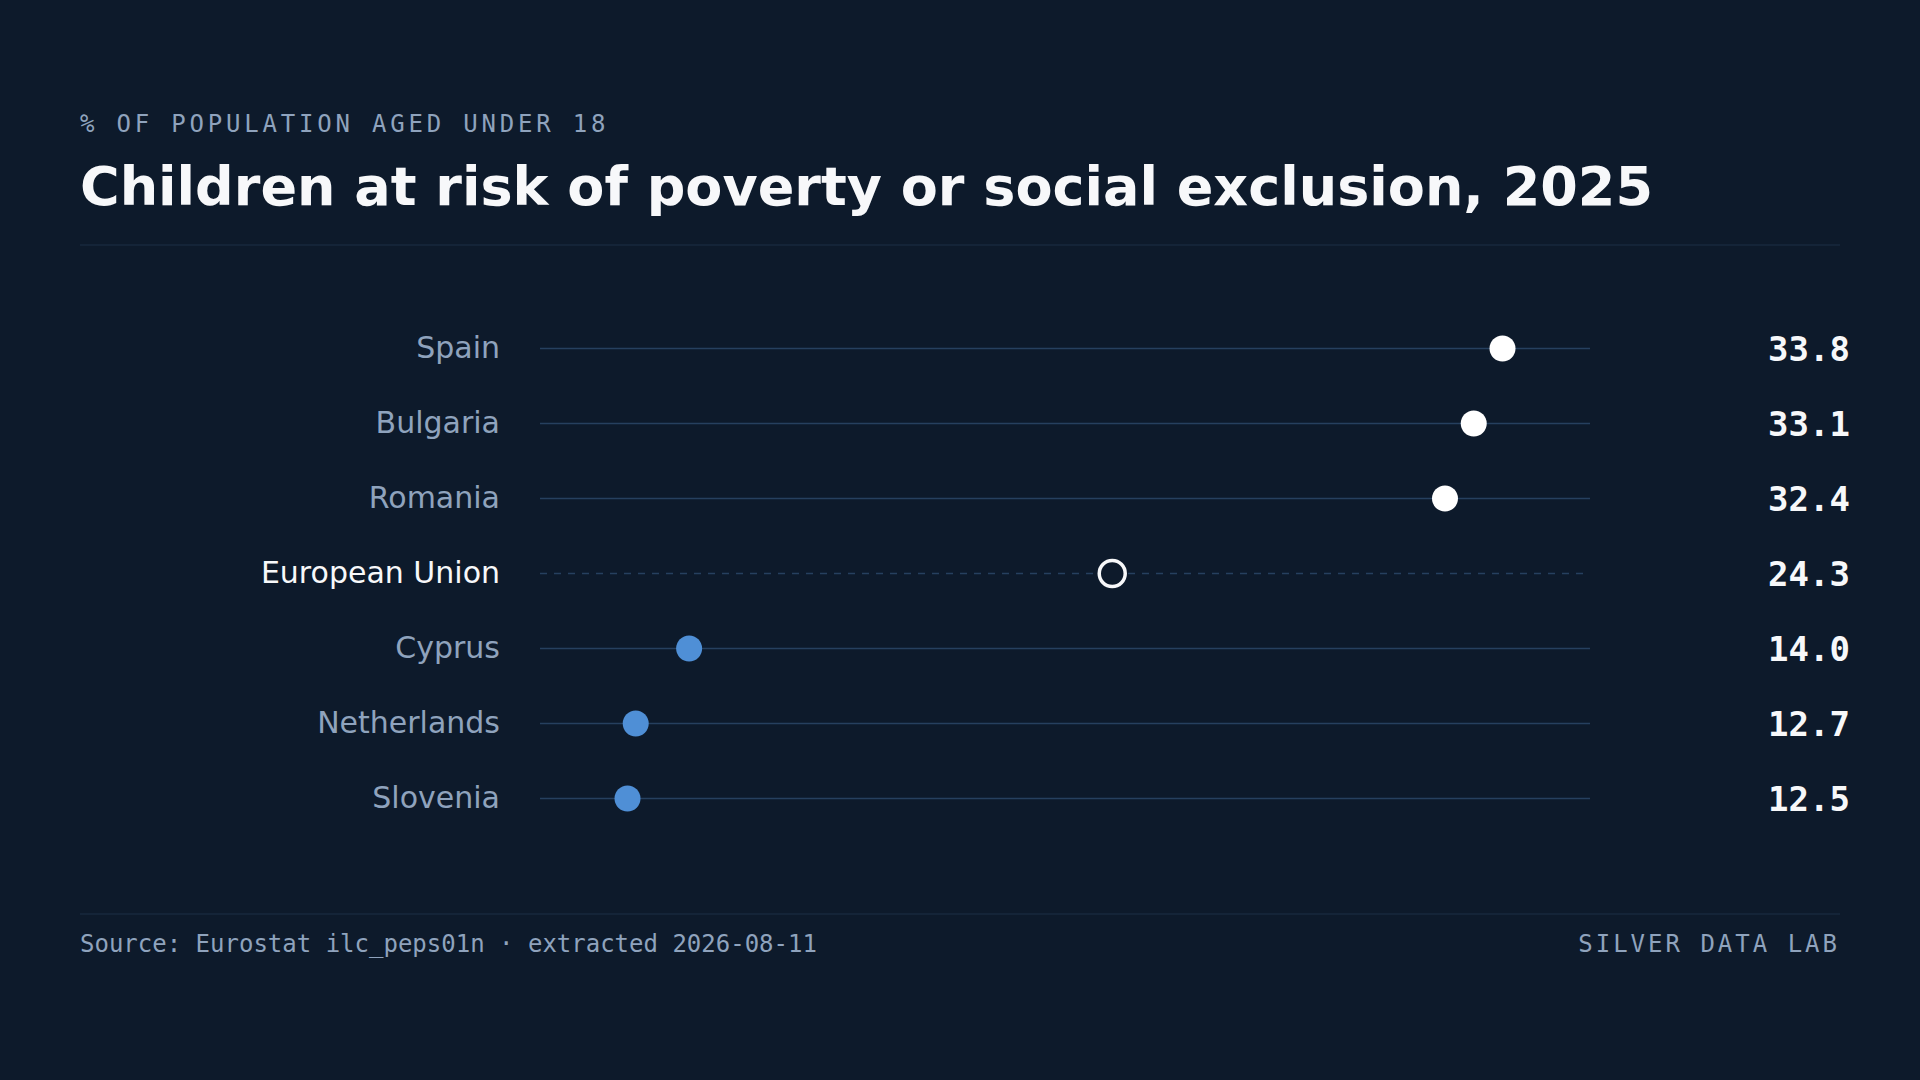
24.3% of children in the EU were at risk of poverty or social exclusion in 2025, against 20.9% for the population as a whole.
Studies where the same country leads or trails
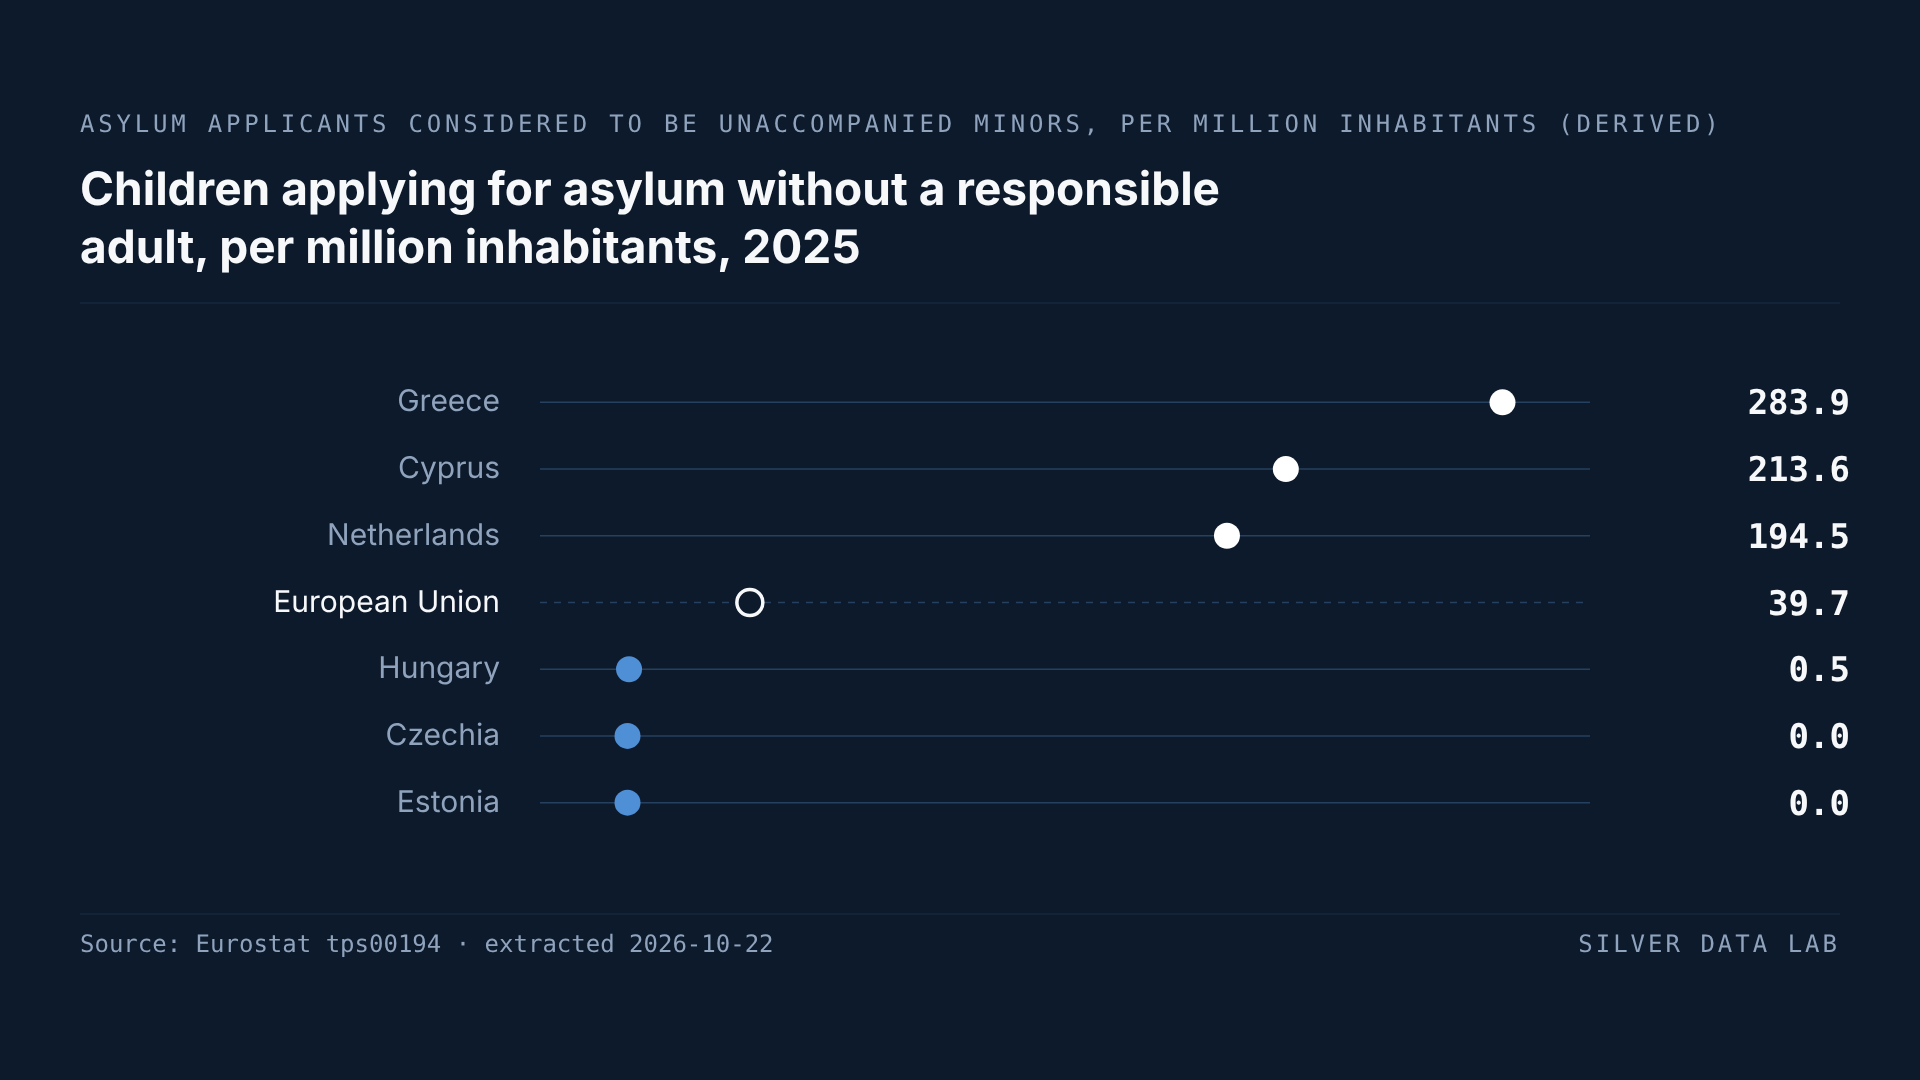
45.9% Fewer Children Sought Asylum Alone in the EU Than a Year Earlier
In 2025, 17,930 children applied for asylum in the EU without a parent or another adult responsible for them, against 33,160 in 2024: a derived fall of 45.9%, to the lowest figure since 2020.
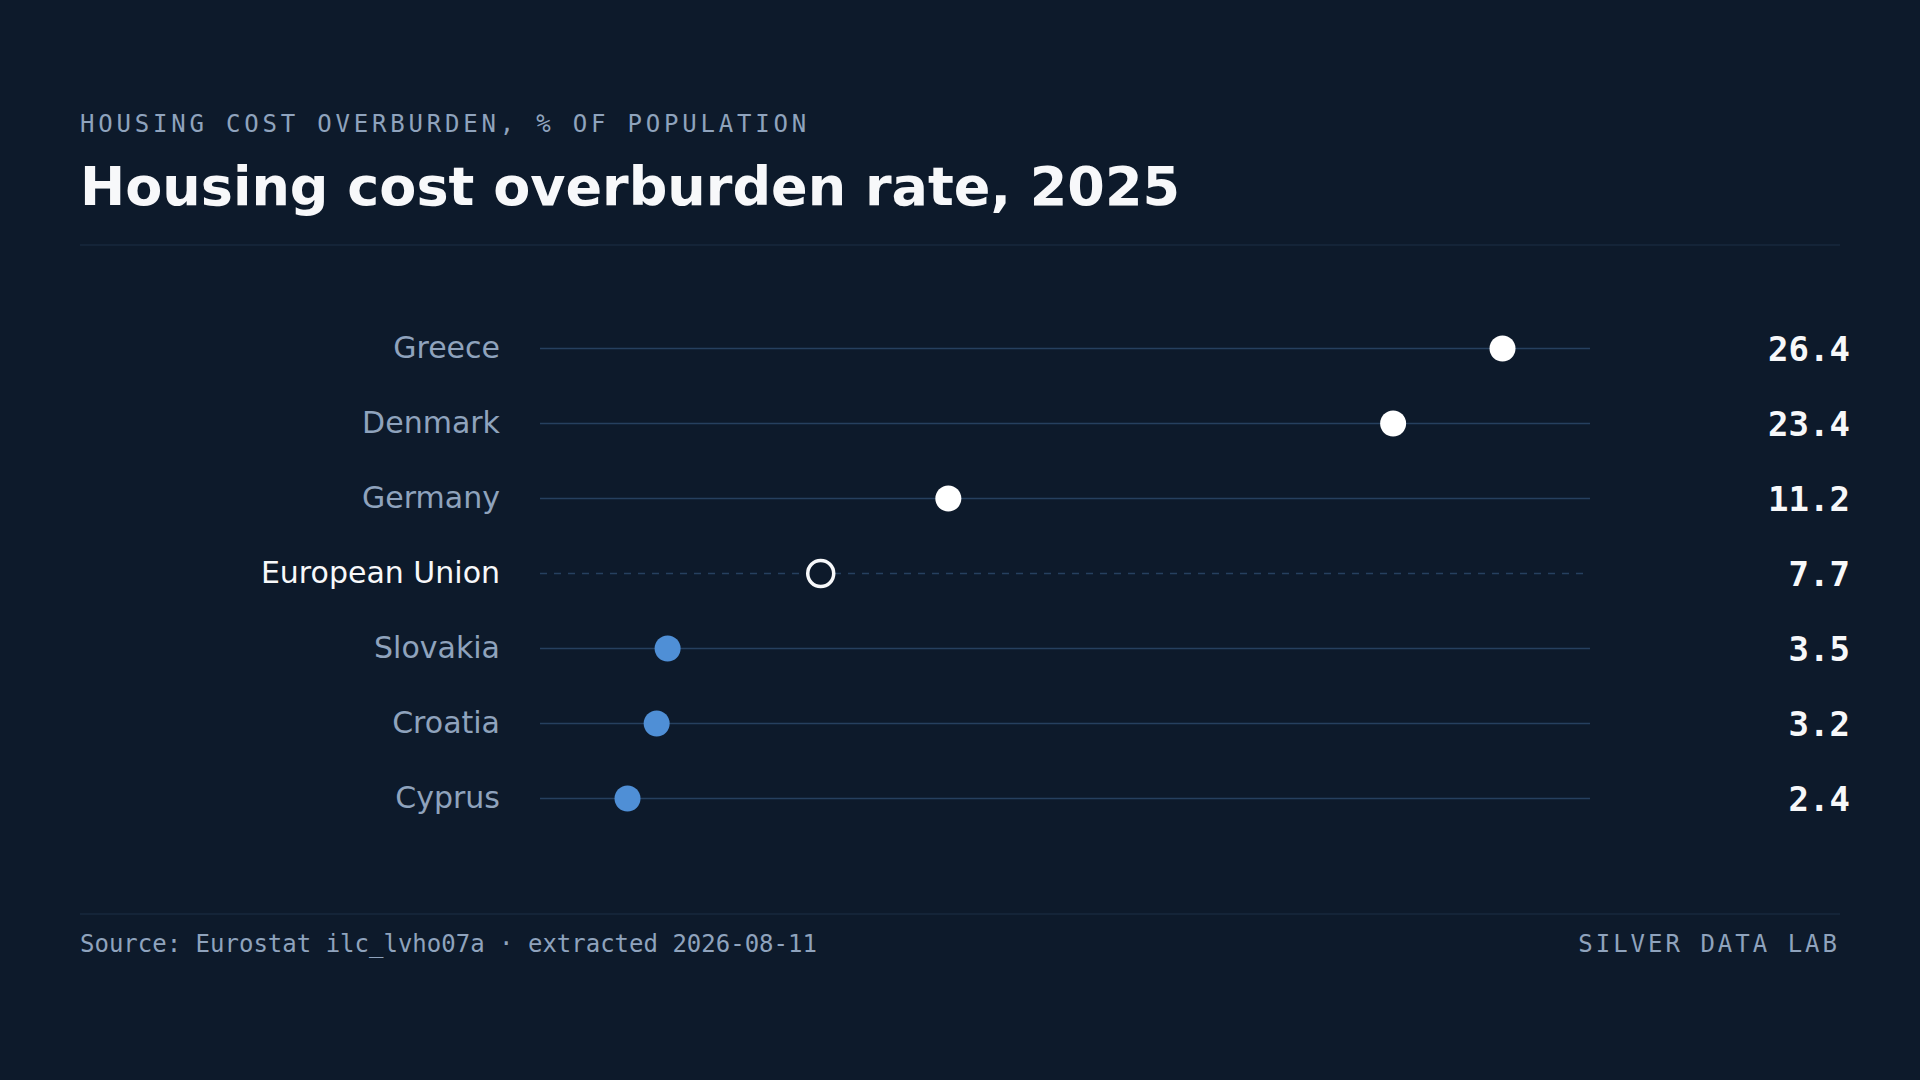
A Quarter of Greeks Spend More Than 40% of Income on Housing
7.7% of the EU population spent more than 40% of disposable income on housing in 2025.
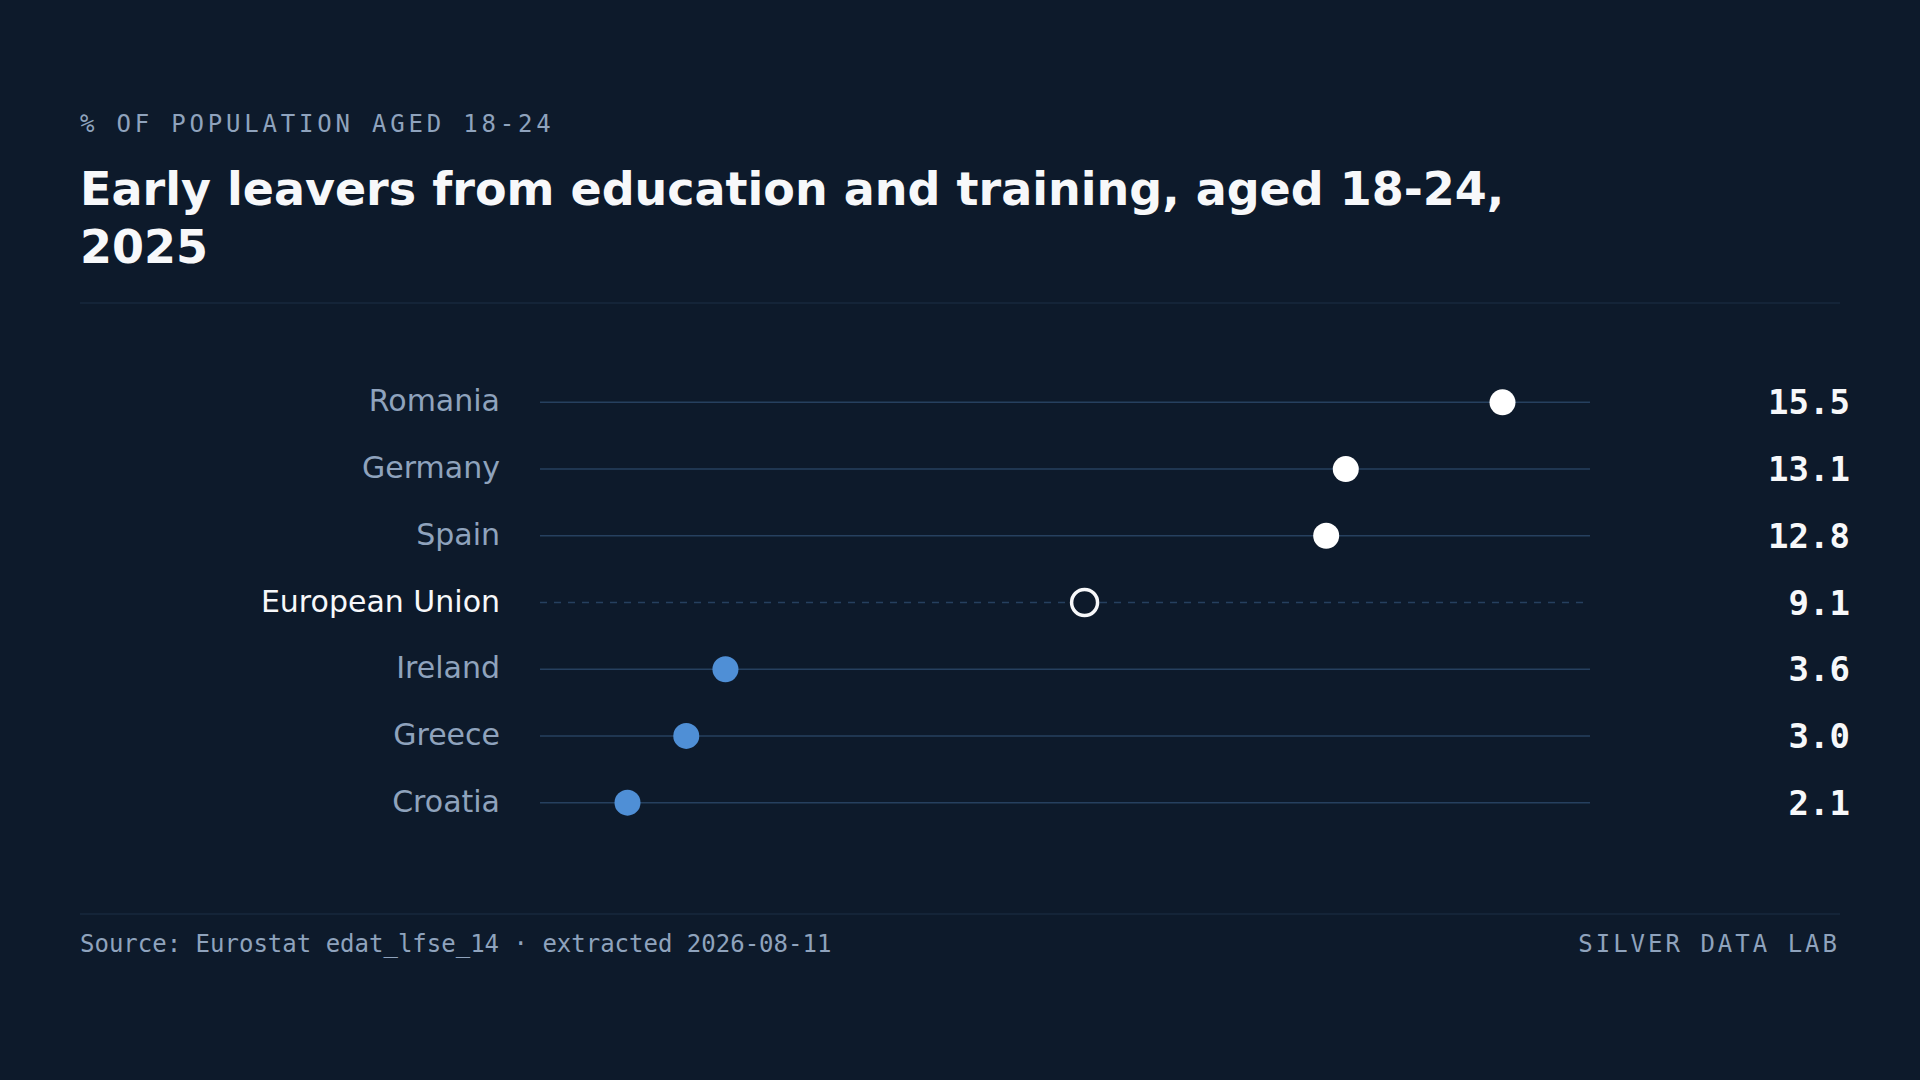
Germany Has the EU's Second-Worst School Dropout Rate
9.1% of people aged 18 to 24 in the EU had left education with at most lower secondary schooling in 2025.